. 2024 Aug 3;25(15):8488.
doi: 10.3390/ijms25158488.

Molecular Pro-Apoptotic Activities of Flavanone Derivatives in Cyclodextrin Complexes: New Implications for Anticancer Therapy

Affiliations

Molecular Pro-Apoptotic Activities of Flavanone Derivatives in Cyclodextrin Complexes: New Implications for Anticancer Therapy

Angelika A Adamus-Grabicka et al. Int J Mol Sci. .

Abstract

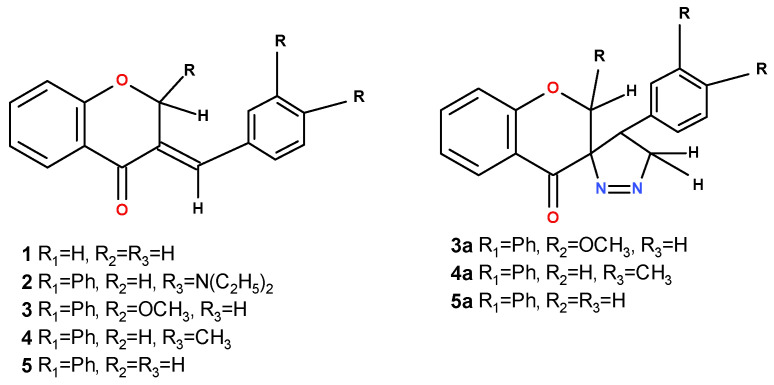
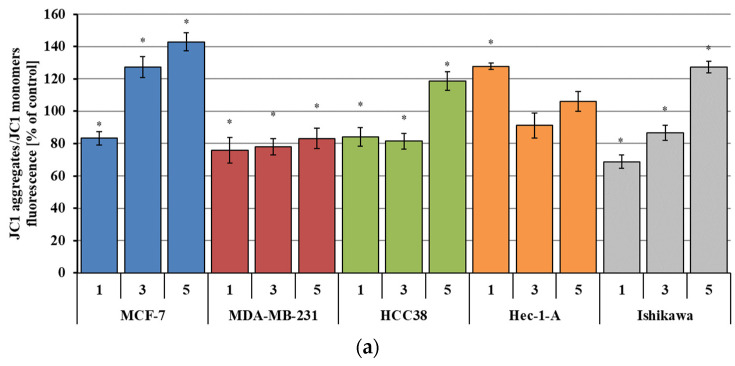
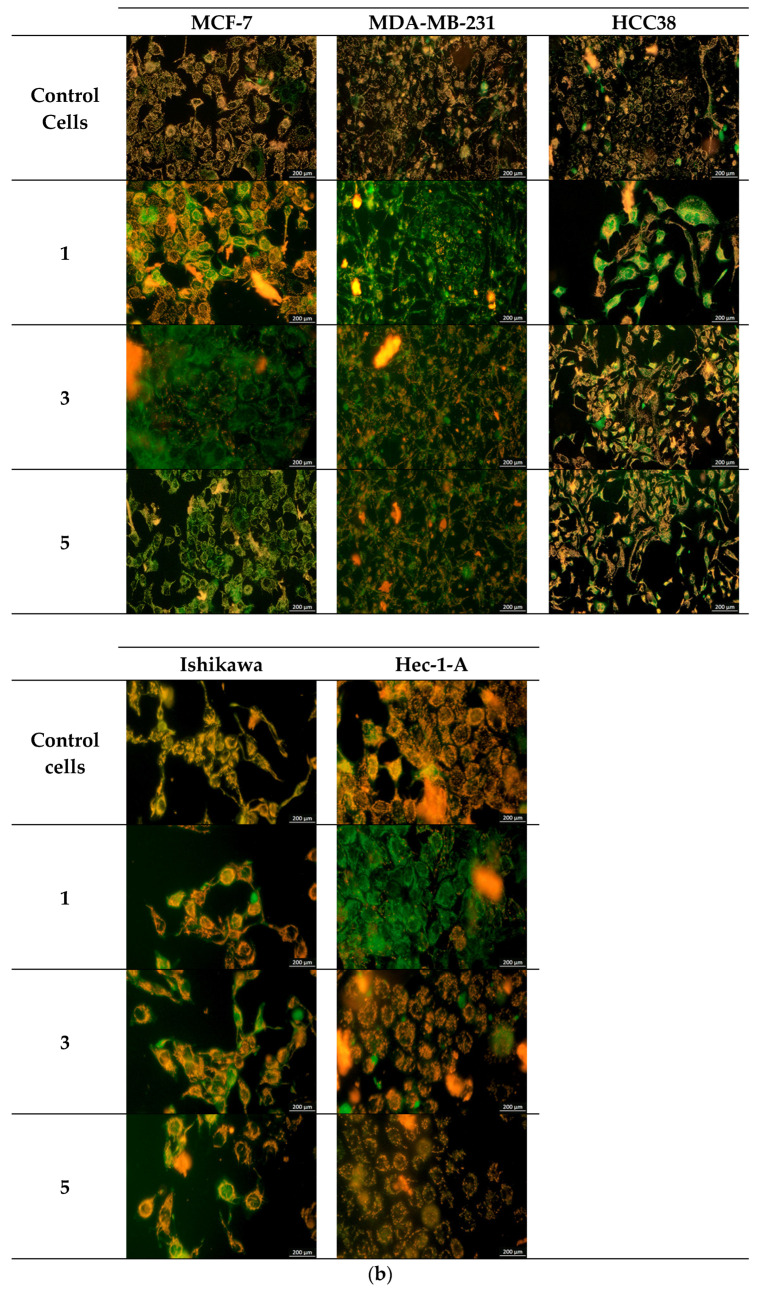
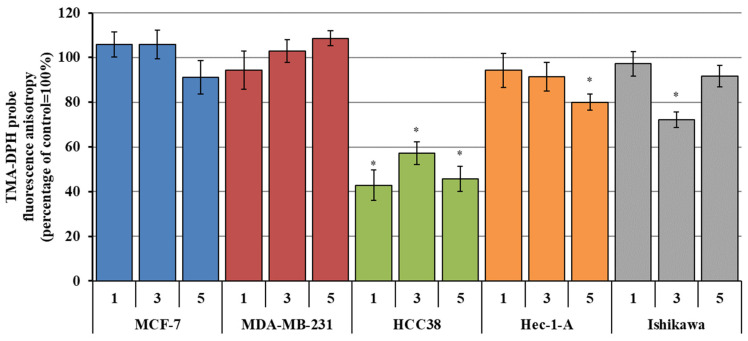
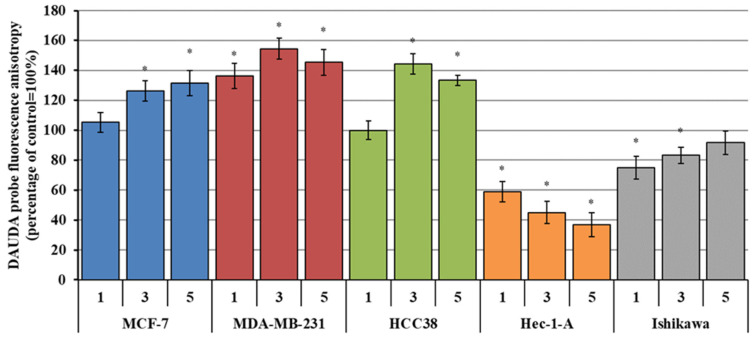
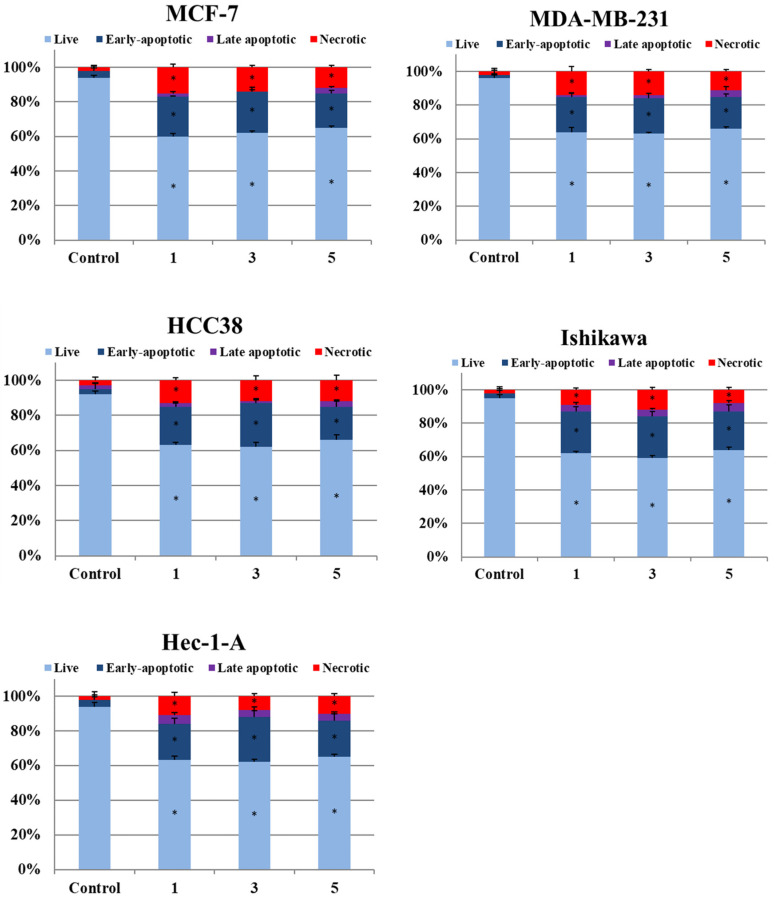
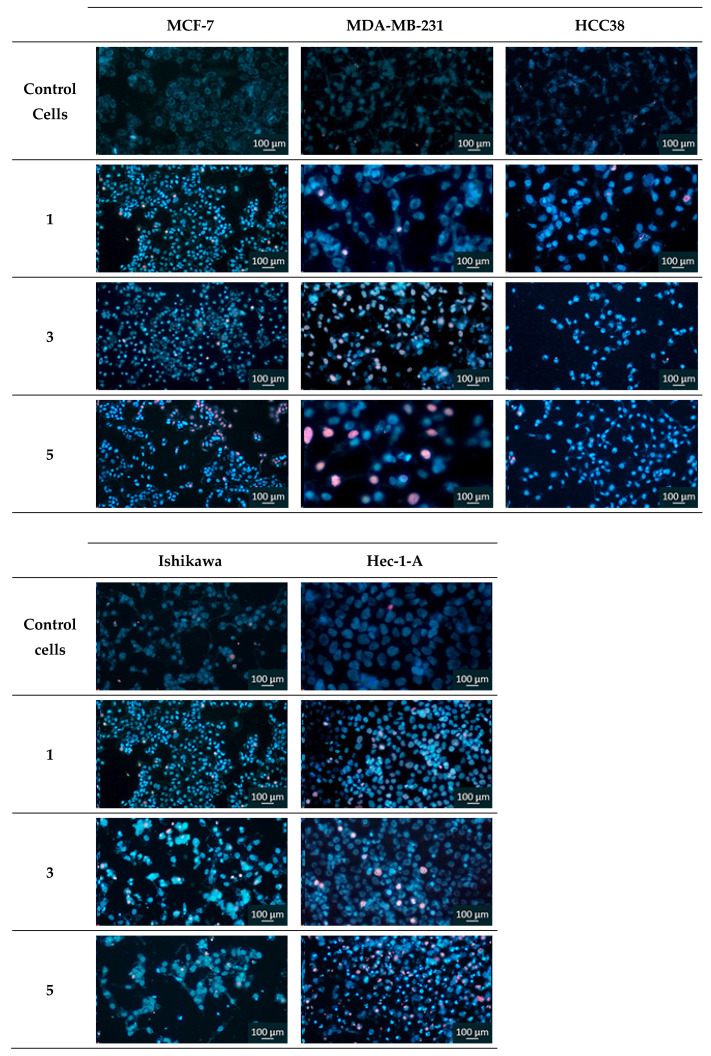
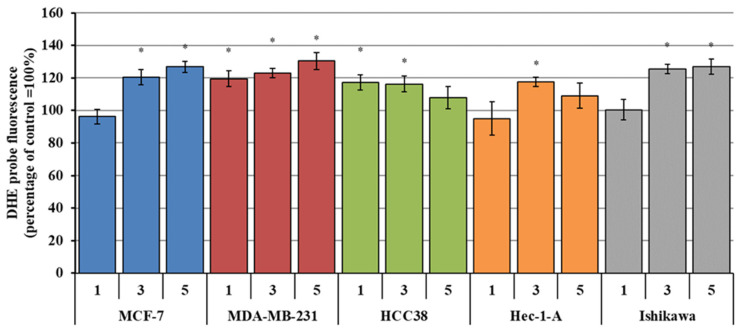
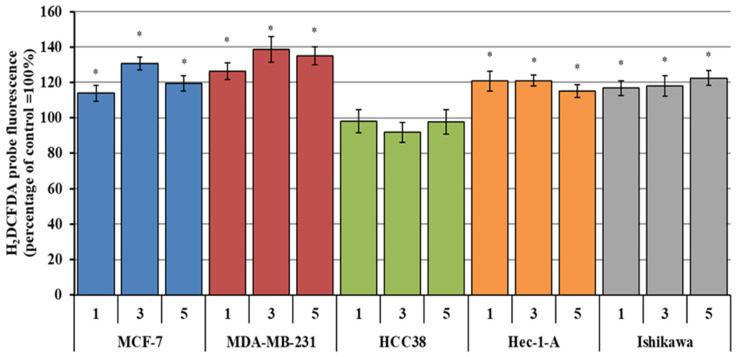
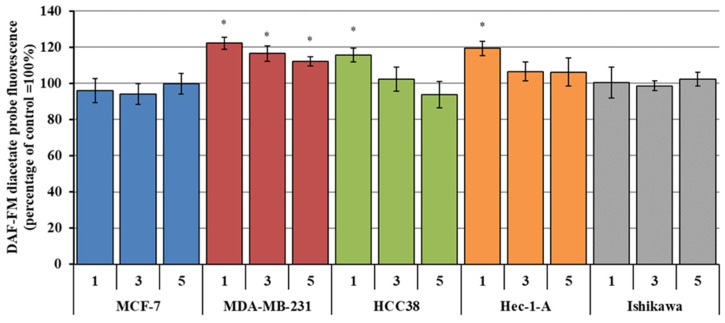
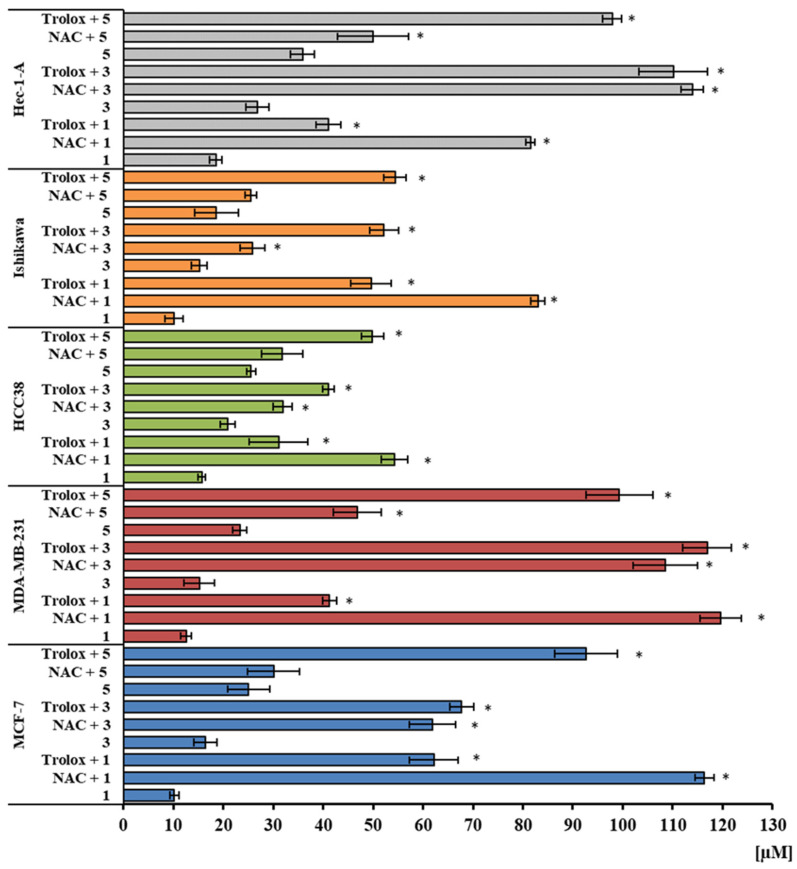
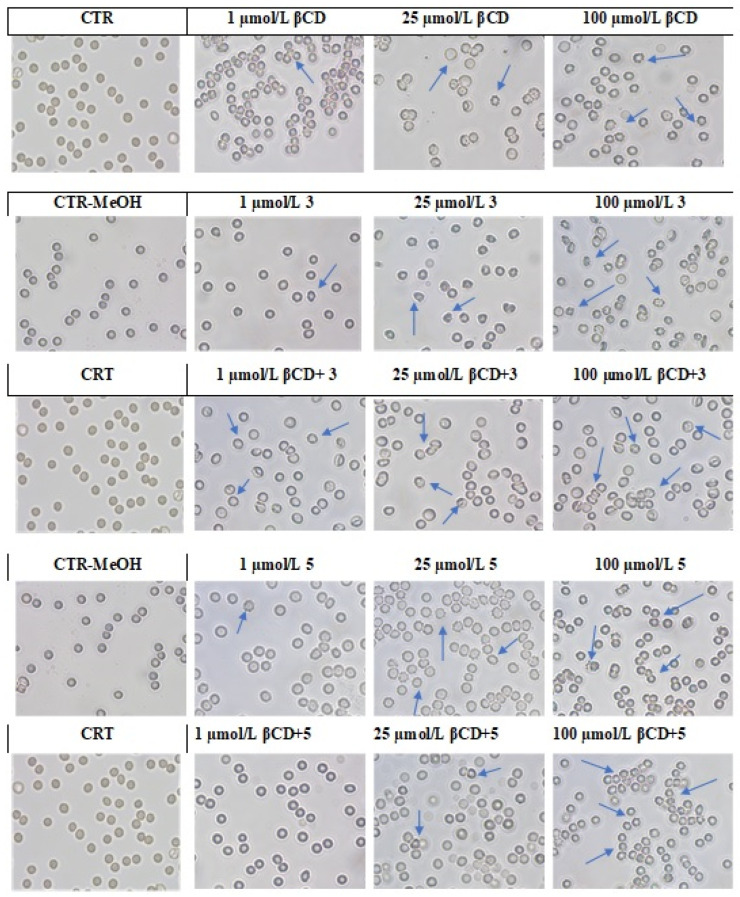
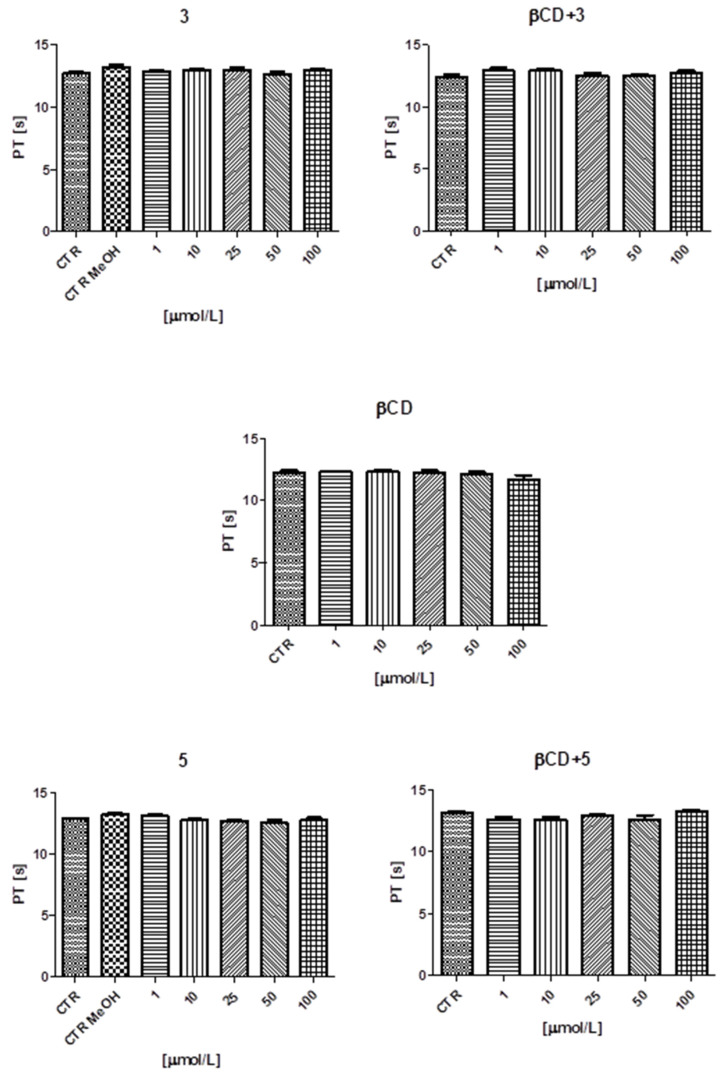
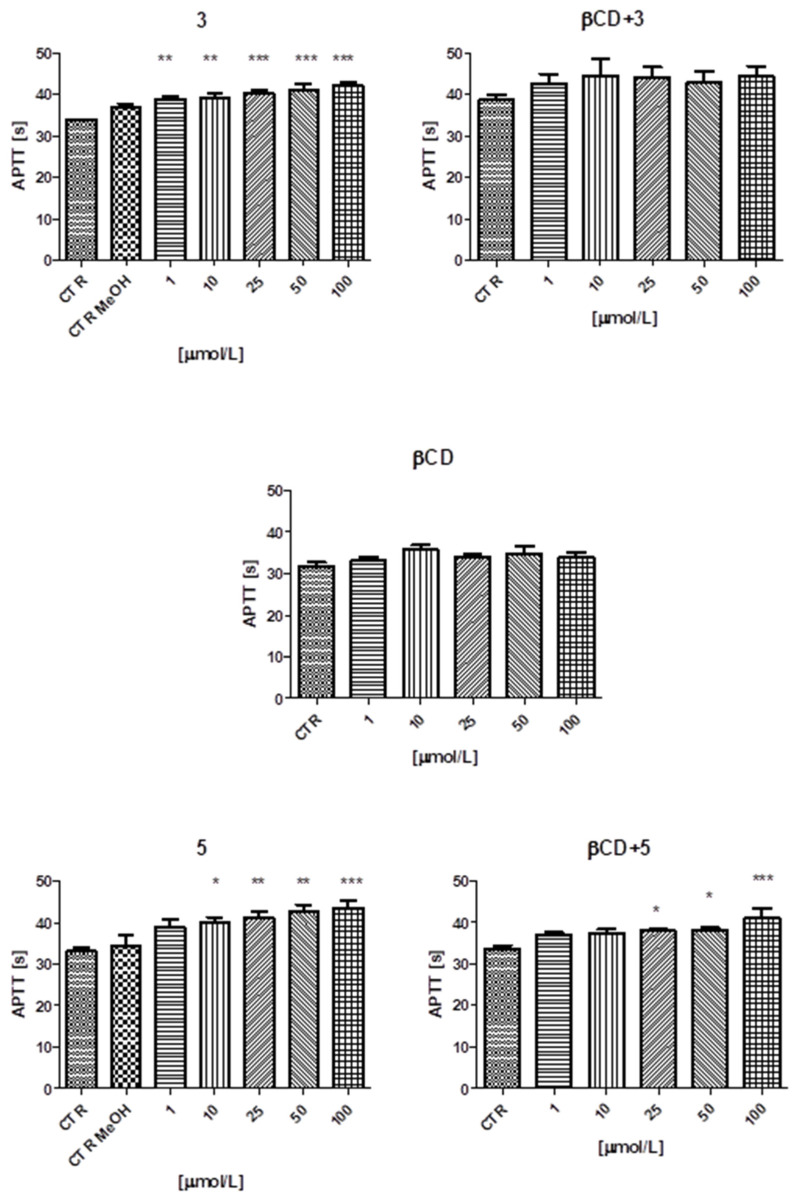
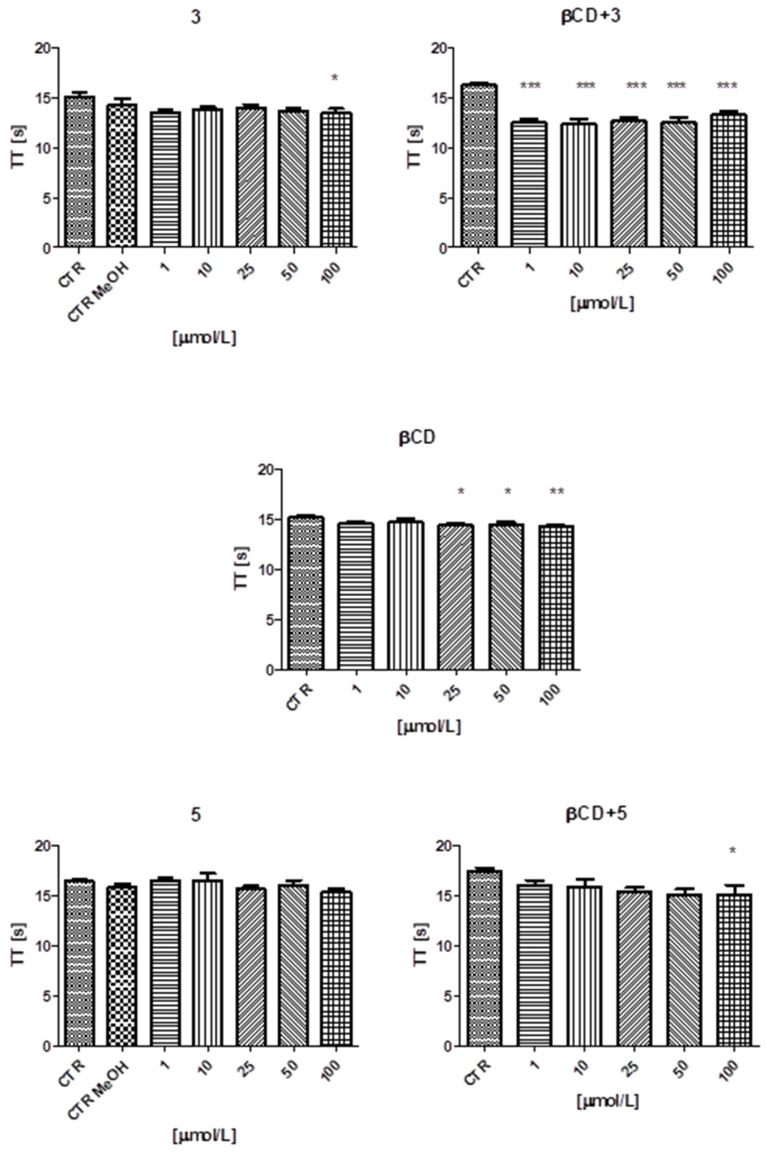
This study evaluates the antiproliferative potential of flavanones, chromanones and their spiro-1-pyrazoline derivatives as well as their inclusion complexes. The main goal was to determine the biological basis of molecular pro-apoptotic activities and the participation of reactive oxygen species (ROS) in shaping the cytotoxic properties of the tested conjugates. For this purpose, changes in mitochondrial potential and the necrotic/apoptotic cell fraction were analyzed. Testing with specific fluorescent probes found that ROS generation had a significant contribution to the biological anticancer activity of complexes of flavanone analogues. TT (thrombin time), PT (prothrombin time) and APTT (activated partial tromboplastin time) were used to evaluate the influence of the compounds on the extrinsic and intrinsic coagulation pathway. Hemolysis assays and microscopy studies were conducted to determine the effect of the compounds on RBCs.

Keywords: anticancer properties; biocompatibility; crystal structure; cyclodextrines; docking studies; flavonoid derivatives; inclusion complexes.


Conflict of interest statement

The authors declare no conflicts of interest.

Figures

Scheme 1
Scheme 1
The structures of tested compounds.
Figure 1
Figure 1
(a). Changes in the mitochondrial potential (fluorescence level of JC-1 aggregates/JC-1 monomers) of MCF-7, MDA-MB-231, HCC38, Hec-1-A and Ishikawa treated with investigated chromanone analogues condensed with pyrazolines at IC50. The results are presented as percentages of controls; the values were calculated by comparing the fluorescence intensity ratio of the test sample and the control (100%). Results represent mean ± SEM of the data from three individual experiments, * p < 0.05 vs. control (untreated cells). Designation of compounds on the chart: 1; 3; 5. (b). Changes in the mitochondrial potential (fluorescence level of JC-1 aggregates/JC-1 monomers) of MCF-7, MDA-MB-231, HCC38, Hec-1-A and Ishikawa treated with investigated chromanone analogues at IC50. The microscopic images were captured at a magnification of 20× with a Nikon Eclipse Te200 microscope with a ZEISS Axiocam 208 color microscope camera using a Nikon LWD Ph1 DL 20 × 0.40 lens.
Figure 1
Figure 1
(a). Changes in the mitochondrial potential (fluorescence level of JC-1 aggregates/JC-1 monomers) of MCF-7, MDA-MB-231, HCC38, Hec-1-A and Ishikawa treated with investigated chromanone analogues condensed with pyrazolines at IC50. The results are presented as percentages of controls; the values were calculated by comparing the fluorescence intensity ratio of the test sample and the control (100%). Results represent mean ± SEM of the data from three individual experiments, * p < 0.05 vs. control (untreated cells). Designation of compounds on the chart: 1; 3; 5. (b). Changes in the mitochondrial potential (fluorescence level of JC-1 aggregates/JC-1 monomers) of MCF-7, MDA-MB-231, HCC38, Hec-1-A and Ishikawa treated with investigated chromanone analogues at IC50. The microscopic images were captured at a magnification of 20× with a Nikon Eclipse Te200 microscope with a ZEISS Axiocam 208 color microscope camera using a Nikon LWD Ph1 DL 20 × 0.40 lens.
Figure 2
Figure 2
Fluorescence anisotropy of TMA-DPH probe in MCF-7, MDA-MB-231, HCC38, Ishikawa and Hec-1-A lines treated with investigated chromanone analogues condensed with pyrazolines at a concentration of IC50. The results are presented as percentages of controls; the results were calculated by comparing the fluorescence anisotropy intensity ratio of the test sample and the control (100%). Results represent mean ± SEM of the data from three individual experiments, * p < 0.05 vs. control (untreated cells). Designation of compounds on the chart: 1; 3; 5.
Figure 3
Figure 3
Fluorescence anisotropy of DAUDA probe in MCF-7, MDA-MB-231, HCC38, Ishikawa and Hec-1-A lines treated with investigated chromanone analogues condensed with pyrazolines at a concentration of IC50. The results are presented as percentages of controls; the data were calculated by comparing the fluorescence anisotropy intensity ratio of the test sample and the control (100%). Results represent mean ± SEM of the data from three individual experiments, * p < 0.05 vs. control (untreated cells). Designation of compounds on the chart: 1; 3; 5.
Figure 4
Figure 4
Induction of apoptotic and necrotic death of cancer cells of the MCF-7, MDA-MB-231, HCC38, Ishikawa and Hec-1-A lines treated with the test compounds at IC50. Fluorescence microscopy using double-staining with Hoechst 33258 fluorochromes and propidium iodide. * p < 0.05 vs. control (PBS-treated cells). Designation of compounds on the chart: 1; 3; 5.
Figure 5
Figure 5
Induction of apoptotic and necrotic death of cancer cells of the MCF-7, MDA-MB-231, HCC38, Ishikawa and Hec-1-A lines treated with investigated compounds at IC50. Fluorescence microscopy using double-staining with Hoechst 33258 fluorochromes and propidium iodide. To visualize changes in cell death, microscopic images were captured with a Nikon Eclipse Te200 microscope with a ZEISS Axiocam 208 color microscope camera. Pictures were taken at a magnification of 20× with a Nikon LWD Ph1 DL 20 × 0.40 lens.
Figure 6
Figure 6
Relative amounts of ROS (superoxide anion O2•−; DHE probe) generated in MCF-7, MDA-MB-231, HCC38, Hec-1-A and Ishikawa lines treated with investigated chromanone analogues condensed with pyrazolines at a concentration of IC50. The results are presented as percentages of controls; these were calculated by comparing the fluorescence intensity ratio of the test sample and the control (100%). Results represent mean ± SEM of the data from three individual experiments, * p < 0.05 vs. control (untreated cells). Designation of compounds on the chart: 1; 3; 5.
Figure 7
Figure 7
Relative amounts of ROS (hydrogen peroxide H2O2; H2DCFDA probe) generated in MCF-7, MDA-MB-231, HCC38, Hec-1-A and Ishikawa lines treated with investigated chromanone analogues condensed with pyrazolines at a concentration of IC50. The results are presented as percentages of controls; these were calculated by comparing the fluorescence intensity ratio of the test sample and the control (100%). Results represent mean ± SEM of the data from three individual experiments, * p < 0.05 vs. control (untreated cells). Designation of compounds on the chart: 1; 3; 5.
Figure 8
Figure 8
Relative amounts of RNS (nitric oxide NO; DAF-FM diacetate probe) generated in MCF-7, MDA-MB-231, HCC38, Hec-1-A and Ishikawa lines treated with investigated chromanone analogues condensed with pyrazolines at a concentration of IC50. The results are presented as percentages of controls; these were calculated by comparing the fluorescence intensity ratio of the test sample and the control (100%). Results represent mean ± SEM of the data from three individual experiments, * p < 0.05 vs. control (untreated cells). Designation of compounds on the chart: 1; 3; 5.
Figure 9
Figure 9
Comparison of IC50 concentration values for individual compounds in cancer lines MCF-7, MDA-MB-231, HCC38, Hec-1-A and Ishikawa in experimental variants without or with one hour pre-incubation with antioxidants: N-acetylcysteine (NAC) and vitamin E (Trolox). The cells were incubated with the investigated compounds for 24 h. Results are expressed as the mean ± SEM of three repeated experiments. IC50 values (µM) indicate the concentration of a tested compound required to reduce the fraction of surviving cells to 50% compared to the control probe (untreated cell). Results represent the mean ± SEM of the data from three individual experiments, * p < 0.05 vs. tested derivative used without antioxidants. Designation of compounds on the chart: 1; 3; 5.
Figure 10
Figure 10
Effects of tested compounds (3; 5, β-CD and their combinations β-CD + 3 and β-CD + 5) on the morphology of red blood cells in vitro after 24 h incubation at 37 °C. Representative phase-contrast images are shown (magnification = 400 times). Examples of echinocytes, stomatocytes and eryptotic erythrocytes are marked with arrows.
Figure 11
Figure 11
The influence of the tested compounds (3; 5; β-CD and the combinations β-CD + 3 and β-CD + 5) in the concentration range of 1–100 µmol/L on the extrinsic coagulation pathway expressed as prothrombin time (PT). No statistically significant differences were noted compared to controls. Results are presented as mean values ± standard deviation (SD) from three independent experiments.
Figure 12
Figure 12
The influence of the tested compounds (3; 5; β-CD and their combinations β-CD + 3 and β-CD + 5) in the concentration range of 1–100 µmol/L on the intrinsic coagulation pathway expressed as activated partial thromboplastin time (APTT). A statistically significant difference was noted compared to control values *—p = 0.05; **—p = 0.01–0.001; ***—p < 0.001. Results are presented as mean values ± standard deviation (SD) from three independent experiments.
Figure 13
Figure 13
The influence of the tested compounds (3; 5; β-CD and their combinations β-CD + 3 and β-CD + 5) in the concentration range of 1–100 µmol/L on the common pathway, expressed as thrombin time (TT). The results significantly differed with controls *—p = 0.05; **—p = 0.01–0.001; ***—p < 0.001. Results are presented as mean values ± standard deviation (SD) from three independent experiments.
Figure 14
Figure 14
Direct effects of interaction between 0.2 mM 3 and 5 mM cyclodextrin (■—α-CD, ■—β-CD, ■—HP-β-CD). Solid lines were calculated assuming one type of active site.
Figure 15
Figure 15
Direct effects of interaction between 0.2 mM 3a and 5 mM cyclodextrin (■—α-CD, ■—β-CD, ■—HP-β-CD). Solid lines were calculated assuming one type of active site.
Figure 16
Figure 16
Direct effects of interaction between 0.2 mM 5 and 5 mM cyclodextrin (■—α-CD, ■—β-CD, ■—HP-β-CD). Solid lines were calculated assuming one type of active site.
Figure 17
Figure 17
Dependence of increasing the solubility of 3 in water on the increasing concentration of α-CD (•), β-CD (♦) and HP-β-CD (■).
Figure 18
Figure 18
Dependence of increasing the solubility of 3 in water on the increasing concentration of α-CD (•), β-CD (♦) and HP-β-CD (■).
Figure 19
Figure 19
Dependence of increasing the solubility of 5 in water on the increasing concentration of α-CD (•), β-CD (♦) and HP-β-CD (■).
Figure 20
Figure 20
Illustration of the docking results based on the example of the most strongly interacting complex. (4a in Ledrob dextrin). The side view is given in the left panel and the top view in the right panel. Hydrogen atoms in the ligand have been omitted for clarity.
Figure 21
Figure 21
Calibration curve of ligands.

Similar articles

Cited by

References

    1. Siegel R.L., Giaquinto A.N., Jemal A. Cancer Statistics, 2024. CA Cancer J. Clin. 2024;74:12–49. doi: 10.3322/caac.21820. - DOI - PubMed
    1. Wéber A., Vignat J., Shah R., Morgan E., Laversanne M., Nagy P., Kenessey I., Znaor A. Global Burden of Bladder Cancer Mortality in 2020 and 2040 According to GLOBOCAN Estimates. World J. Urol. 2024;42:237. doi: 10.1007/s00345-024-04949-8. - DOI - PMC - PubMed
    1. Kerru N., Gummidi L., Maddila S., Gangu K.K., Jonnalagadda S.B. A Review on Recent Advances in Nitrogen-Containing Molecules and Their Biological Applications. Molecules. 2020;25:1909. doi: 10.3390/molecules25081909. - DOI - PMC - PubMed
    1. Sidhu J.S., Singla R., Mayank, Jaitak V. Indole Derivatives as Anticancer Agents for Breast Cancer Therapy: A Review. Anti-Cancer Agents Med. Chem. 2015;16:160–173. doi: 10.2174/1871520615666150520144217. - DOI - PubMed
    1. Jicsinszky L., Fenyvesi E., Hashimoto H., Ueno A. Chapter 4. Cyclodextrin derivatives. Cyclodextrins. In: Szejtli J., Osa T., editors. Comprehensive Supramolecular Chemistry. Pergamon; Oxford, UK: 1996. pp. 57–188.

MeSH terms

LinkOut - more resources