. 2024 Aug 27;43(8):114601.
doi: 10.1016/j.celrep.2024.114601. Epub 2024 Aug 8.

Functional genomic analysis of genes important for Candida albicans fitness in diverse environmental conditions

Affiliations

Functional genomic analysis of genes important for Candida albicans fitness in diverse environmental conditions

Emily H Xiong et al. Cell Rep. .

Abstract

Fungal pathogens such as Candida albicans pose a significant threat to human health with limited treatment options available. One strategy to expand the therapeutic target space is to identify genes important for pathogen growth in host-relevant environments. Here, we leverage a pooled functional genomic screening strategy to identify genes important for fitness of C. albicans in diverse conditions. We identify an essential gene with no known Saccharomyces cerevisiae homolog, C1_09670C, and demonstrate that it encodes subunit 3 of replication factor A (Rfa3). Furthermore, we apply computational analyses to identify functionally coherent gene clusters and predict gene function. Through this approach, we predict the cell-cycle-associated function of C3_06880W, a previously uncharacterized gene required for fitness specifically at elevated temperatures, and follow-up assays confirm that C3_06880W encodes Iml3, a component of the C. albicans kinetochore with roles in virulence in vivo. Overall, this work reveals insights into the vulnerabilities of C. albicans.

Keywords: CP: Genomics; CP: Microbiology; Candida albicans; DNA damage repair; Galleria mellonella; fitness; functional genomics; fungal pathogen; kinetochore; virulence.


Conflict of interest statement

Declaration of interests L.E.C. is a co-founder and shareholder in Bright Angel Therapeutics, a platform company for the development of novel antifungal therapeutics. L.E.C. is a Science Advisor for Kapoose Creek, a company that harnesses the therapeutic potential of fungi.

Figures

Figure 1.
Figure 1.. Pooled screening of the GRACE library in diverse growth conditions identifies genes important for fitness in condition-independent and condition-dependent manners
(A) Simplified schematic of the pooled screening experimental pipeline. (B) Simplified schematic of the pooled screening computational analysis pipeline. A fitness score was calculated for each strain using the log2FC in barcode read counts between “no DOX” compared to DOX conditions. Significance is determined by comparing each strain’s fitness score to the median fitness score in each condition using a moderated t test with Benjamini-Hochberg correction. Strains with LFC ≧ 2.0 and FDR ≦ 0.05 are deemed hits. (C) Pooled screening in eight growth conditions identifies hundreds of genes important for fitness in each condition. Numbers reflect the number of genes identified as hits in each condition. All screening was performed with technical triplicates in biological duplicate, except for the baseline condition performed in biological quintuplicate. See also Figures S1 and S2.
Figure 2.
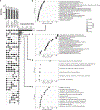
Figure 2.. Identification of condition-specific hits and functional enrichment analysis
(A) Upset plot highlighting genes important for fitness in specific conditions. Horizontal bars represent the total number of hits for each unique combination of conditions, indicated by dots below the column. Vertical bars indicate total number of hits for each specific condition. (B–E) Dot plots representing GO enrichment results for (B) 171 condition-independent hits, (C) 36 genes important for fitness in all conditions except YPD, (D) 18 hits exclusively identified at high temperature, and (E) 12 genes important for fitness in YPD and YNB supplemented with 10% serum. FDR is shown on the color scale, with black being the most significant.
Figure 3.
Figure 3.. C1_09670C is important for C. albicans fitness in all conditions and encodes RFA3
(A) Strains were grown in various conditions of interest in the absence or presence of 100 μg/mL DOX for 24 h and then subcultured into fresh medium to a starting optical density 600 (OD600) of 0.05. OD was measured after an additional 48 h of growth after subculture. Heatmap values represent the mean of three biological replicates. (B) Protein structures of AlphaFold-generated C. albicans C1_09670c (UniProt: Q5APD5), S. pombe Ssb3 (UniProt: Q92374), and C. neoformans Rfa3 (UniProt: J9VL31) and protein structure of S. cerevisiae Rfa3 (PDB: 6I52) determined by cryoelectron microscopy. The color of regions in AlphaFold-predicted structures indicates the predicted local distance difference test (pLDDT), with a scale of dark blue to yellow to red indicating high to low confidence. TM score was calculated by TM-align. The TM score range is between 0 and 1, with 1 indicating a perfect match and <0.2 corresponding to randomly chosen unrelated structures. (C) Strains were grown overnight in YPD in the absence or presence of 0.05 μg/mL DOX and then subcultured into YPD supplemented with 0 or 0.5 μg/mL DOX. Images were taken after 4 h of growth at 30°C. The wild type (CaSS1) was also subcultured into YPD supplemented with 50 μM nocodazole. Scale bar corresponds to 10 μm. The experiment was performed in biological duplicates with similar results. (D) Strains were subcultured to an OD600 of 0.1 in fresh YPD and allowed to grow for 4 h before visualization by fluorescence microscopy, with Rfa3 shown in green and nuclei stained with Hoechst 33342 shown in blue. Insets show enlarged images of boxed area, with the cell outline overlayed in gray dashed lines. Scale bars corresponds to 10 μm or 5 μm for insets. The experiment was performed in biological duplicates with similar results. (E) Strains were grown overnight in YPD in the absence or presence of 0.05 μg/mL DOX, at which point they were spotted onto YPD agar supplemented with combinations of 0, 0.05, or 20 μg/mL DOX and 0 or 0.01% MMS, as indicated, in 2-fold dilutions starting from an OD600 of 10. Images were taken after 48 h of growth at 30°C. The experiment was performed in biological duplicates with similar results. (F) A strain expressing GFP-tagged Rfa3 was grown overnight in YPD at 30°C prior to subculture in fresh medium with or without 0.01% MMS, and images were taken after 4 h. The number of foci per nucleus was quantified from three images of non-overlapping fields of view, and the percentages of cells with no foci, a single focus, and multiple foci per nucleus were calculated based on total cells in each image. The scale bar corresponds to 10 μm. Representative images are shown and quantification results plotted as mean ± SD of three images from a single biological replicate. The experiment performed in biological duplicates with similar results. (G) AP-MS of GFP-tagged Rfa3. Cells were grown in YPD at 30°C, and statistically significant interactions were defined through SAINTexpress analysis compared to the Eno1-GFP control. All proteins represented in nodes were identified with high confidence (Bayesian false discovery rate [BFDR] threshold of <0.01, total spectral counts ≥ 5, and fold-change relative to Eno1 ≥ 50) and colored based on GO term annotations. Edge color reflects the fold change in peptide count of Rfa3 relative to Eno1, with darker colors representing greater fold change. Members of the RFA complex and RFC complex are outlined in red and orange, respectively. See also Figures S2–S4.
Figure 4.
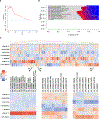
Figure 4.. Functional evaluation of mutant profile similarity and analysis of clusters
(A) Precision-recall (PR) performance analysis of the mutant profiles in comparison to established functional annotations (GO biological processes) using the FLEX software. The PR curve measures the extent to which gene pairs’ profile similarity across the conditions is predictive of co-annotation to a functional standard (in this case, annotations to specific GO terms). Strong PR performance indicates that profile similarity is identifying genes known to have common functions. The x axis represents the logarithmic scale of the total count of true positives (TPs), and the y axis measures precision. The dashed line corresponds to a random baseline expected of an uninformative similarity measure. (B) Diversity plot showing the contribution of GO biological processes to TP pairs identified in the PR analysis (i.e., pairs that are highly correlated in their profile and also co-annotated to a common GO term). The plot is generated by systematically adjusting a precision cutoff from high to low (corresponding to cutoffs high to low on the similarity score), as indicated on the y axis. At each cutoff point, a stacked bar plot is created along the x axis to report the number of gene pairs (TP) coming from each of the corresponding process terms. The legend includes the top 10 contributing GO terms, while the light gray category encompasses all other terms that appear less frequently. For example, the term capturing the most TP gene-pairs across a range of cutoffs is “amino acid metabolic process,” especially at higher correlation thresholds. This plot details which processes are responsible for the functionally related pairs correctly captured by the highest profile similarities. (C) Heatmaps visualizing the clusters from the modified hierarchical clustering algorithm. For visualization purposes, 48 clusters from this algorithm are shown in a single heatmap and were ordered by a standard hierarchical clustering of the cluster centroids (the resulting dendrogram is shown). Each mutant strain’s profile was Z score normalized across the conditions. The three clusters highlighted at the bottom are those that yield significant GO enrichment results given a cutoff of FDR < 0.05. Systematic and standard names of each gene are provided. S.cer represents the name of its S. cerevisiae ortholog.
Figure 5.
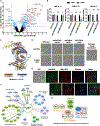
Figure 5.. C3_06880W encodes kinetochore component Iml3 and is specifically required for growth at physiological temperature
(A) Differential log2FC comparison between 37°C and 30°C revealed C3_06880W among top genes required for growth at 37°C. The differential log2FC (dLFC) indicates the mean difference in log2FC for each gene between 30°C and 37°C. Genes with dLFC that differ significantly from zero were identified using a moderated t test, generating a p value with Benjamin-Hochberg correction (padj). Significance and effect size thresholds are applied at FDR = 0.05 and dLFC = |2.0|, respectively. (B) Strains were grown at 30°C, 37°C, and 42°C in the absence or presence of 100 μg/mL DOX for 24 h and then subcultured into fresh medium to a starting OD600 of 0.05. OD was measured after an additional 48 h of growth after subculture. The plot shows mean ± SD of growth relative to the wild type in the absence of DOX for biological triplicates. Statistical significance was assessed using two-way ANOVA with Bonferroni correction for multiple comparisons: *p < 0.05, ***p < 0.0005, ****p < 0.0001; n = 3. (C) Pairwise structure alignment and TM-align reveal a high degree of overlap in superimposed protein structures of AlphaFold-predicted C3_06880w (orange; UniProt: Q5ADM8) and crystallized Iml3 of S. cerevisiae (blue; PDB: 4JE3) and favorable template modeling (TM) scores. (D) Strains were grown overnight in the absence or presence of 0.05 μg/mL doxycycline (DOX). Strains were subsequently subcultured at a starting OD600 of 0.1 in fresh YPD in the absence or presence of 5 μg/mL DOX as indicated. The wild-type strain in the absence of DOX was treated with 50 μM nocodazole. Scale bar corresponds to 10 μm. The experiment was performed in biological duplicates with similar results. (E) Strains were subcultured to an OD600 of 0.1 in fresh YPD and allowed to grow for 4 h before visualization by fluorescence microscopy. Shown are Iml3 (green), Mtw1 (red), and nuclei (blue). Insets show enlarged images of boxed areas, with the cell outline overlayed in gray dashed lines. The scale bars correspond to 5 μm or 2 μm for the inset. The experiment was performed in biological duplicates with similar results. (F) AP-MS of affinity-tagged Iml3 identified kinetochore components. Cells were grown in YPD at 30°C, and statistically significant interactions were defined through SAINTexpress analysis compared with the Eno1-GFP control. All proteins were identified by AP-MS with high confidence (BFDR threshold < 0.01, total spectral counts ≥ 5, and fold change relative to Eno1 ≥ 50), with proteins as nodes colored based on GO term annotations. Edge color reflects the fold change in peptide count of Iml3 relative to Eno1, with darker colors representing greater fold change. Nodes are outlined if protein is a confirmed or putative homolog of an inner kinetochore component in S. cerevisiae. Outline color corresponds to protein complexes in (G). Source data are provided in Table S4. (G) Simplified schematic of the S. cerevisiae inner kinetochore. Colored circles represent proteins for which homologs have been identified and characterized in C. albicans, including Iml3 encoded by C3_06880W. See also Figure S4 and S5.
Figure 6.
Figure 6.. Depletion of C3_06880W attenuates virulence in a temperature-dependent manner
(A) Depletion of IML3 reduces virulence of C. albicans in a temperature-dependent manner in a G. mellonella larva model of infection. Transcriptional repression of IML3 by the addition of DOX to the inoculum of 1 × 10⁶ cells significantly improved survival of larvae when incubated at 39°C but not 28°C. Log rank (Mantel-Cox) test, **p < 0.0021. (B) Depletion of IML3 attenuates virulence of C. albicans in a mouse model of infection. Repression of Iml3 expression by the addition of DOX to the drinking water significantly improved survival relative to other conditions. Log rank (Mantel-Cox) test, ***p < 0.0001. Log rank test for trend, p = 0.0003.

References

    1. Blackwell M (2011). The fungi: 1, 2, 3 . 5.1 million species? Am. J. Bot. 98, 426–438. - PubMed
    1. Taylor LH, Latham SM, and Woolhouse ME (2001). Risk factors for human disease emergence. Philos. Trans. R. Soc. Lond. B Biol. Sci. 356, 983–989. - PMC - PubMed
    1. Brown GD, Denning DW, Gow NAR, Levitz SM, Netea MG, and White TC (2012). Hidden killers: Human fungal infections. Sci. Transl. Med. 4, 165rv13. - PubMed
    1. Gow NAR, van de Veerdonk FL, Brown AJP, and Netea MG (2011). Candida albicans morphogenesis and host defence: discriminating invasion from colonization. Nat. Rev. Microbiol. 10, 112–122. - PMC - PubMed
    1. Pfaller MA, and Diekema DJ (2007). Epidemiology of invasive candidiasis: a persistent public health problem. Clin. Microbiol. Rev. 20, 133–163. - PMC - PubMed

Publication types

Substances