. 2024 Aug 27;43(8):114607.
doi: 10.1016/j.celrep.2024.114607. Epub 2024 Aug 9.

Type I interferon governs immunometabolic checkpoints that coordinate inflammation during Staphylococcal infection

Affiliations

Type I interferon governs immunometabolic checkpoints that coordinate inflammation during Staphylococcal infection

Mack B Reynolds et al. Cell Rep. .

Abstract

Macrophage metabolic plasticity is central to inflammatory programming, yet mechanisms of coordinating metabolic and inflammatory programs during infection are poorly defined. Here, we show that type I interferon (IFN) temporally guides metabolic control of inflammation during methicillin-resistant Staphylococcus aureus (MRSA) infection. We find that staggered Toll-like receptor and type I IFN signaling in macrophages permit a transient energetic state of combined oxidative phosphorylation (OXPHOS) and aerobic glycolysis followed by inducible nitric oxide synthase (iNOS)-mediated OXPHOS disruption. This disruption promotes type I IFN, suppressing other pro-inflammatory cytokines, notably interleukin-1β. Upon infection, iNOS expression peaks at 24 h, followed by lactate-driven Nos2 repression via histone lactylation. Type I IFN pre-conditioning prolongs infection-induced iNOS expression, amplifying type I IFN. Cutaneous MRSA infection in mice constitutively expressing epidermal type I IFN results in elevated iNOS levels, impaired wound healing, vasculopathy, and lung infection. Thus, kinetically regulated type I IFN signaling coordinates immunometabolic checkpoints that control infection-induced inflammation.

Keywords: CP: Immunology; CP: Metabolism; Staphylococcus aureus; epigenetics; immunometabolism; inflammation; innate immunity; interferon; lactate; macrophage; nitric oxide; respiratory complex.


Conflict of interest statement

Declaration of interests C.A.L. has received consulting fees from Astellas Pharmaceuticals, Odyssey Therapeutics, and T-Knife Therapeutics and is an inventor on patents pertaining to Kras-regulated metabolic pathways, redox control pathways in pancreatic cancer, and targeting the GOT1 pathway as a therapeutic approach (US patent no. 2015126580-A1, May 7, 2015; US patent no. 20190136238, May 9, 2019; and international patent no. WO2013177426-A2, April 23, 2015). J.M.K. has received grant support from Q32 Bio, Celgene/BMS, Ventus Therapeutics, ROME Therapeutics, and Janssen. J.M.K. has served on advisory boards for AstraZeneca, Eli Lilly, GlaxoSmithKline, Gilead, Bristol Myers Squibb, Avion Pharmaceuticals, Provention Bio, Aurinia Pharmaceuticals, Ventus Therapeutics, and ROME Therapeutics.

Figures

Figure 1.
Figure 1.. MRSA infection disrupts the ETC at multiple points and stimulates robust glycolysis in macrophages
(A) Seahorse XF analysis of OCR in 24-h MRSA-infected (USA300; MOI 20) BMDMs using the Mito Stress Test assay, with additions of oligomycin (O), carbonylcyanide p-trifluoromethoxyphenylhydrazone (FCCP), rotenone (R), and antimycin A (A) at indicated time points. (B) Blue native (BN)-PAGE and immunoblot analysis of native RCs complex I–V (CI–CV) and SRCs paired to total protein stain (Coomassie G-250) in mock or 24-h MRSA-infected BMDMs. (C) Quantification of RC abundance relative to total protein as percentage of average mock samples between experiments. (D) Flow cytometric analysis of macrophages stained with MTDR and MTG in mock and 24-h MRSA-infected BMDMs. Quantification of percentage of MTDRHigh (hyperpolarized) cells. (E) Liquid chromatography-mass spectrometry (LC-MS)-based targeted metabolomics analysis of mock- or 24-h MRSA-infected BMDMs with Metaboanalyst 5.0 pathway enrichment analysis using Kyoto Encyclopedia of Genes and Genomes (KEGG) annotation of the top five significantly changed metabolic pathways. (F) Seahorse XF analysis of ECAR in mock- or 24-h MRSA-infected BMDMs. Graphs represent the mean of n ≥ 3 biological replicates with SD error bars. p values were calculated using an unpaired t test (D and F) or two-way ANOVA with Sidak’s post-test (C). *p < 0.05; **p < 0.01; ****p < 0.0001.
Figure 2.
Figure 2.. Kinetically staggered TLR and IFNAR signaling sets the pace of macrophage metabolism during MRSA infection
(A) Seahorse XF analysis of BMDM treated for 24 h with TLR2 agonist P3CSK4 (2 μg/mL) and/or IFN-β (400U/mL) using the Mito Stress Test assay, with additions of oligomycin (O), FCCP, rotenone (R), and antimycin A (A) at the indicated time points. (B) Quantification of basal respiration in BMDMs stimulated for 24 h with or without P3CSK4 and IFN-β. (C) BN-PAGE and immunoblot analysis of native RC from BMDMs treated with P3CSK4 and/or IFN-β for 24 h. (D) Native RC abundance relative to CV, normalized to the paired mock sample. (E) Seahorse Mito Stress Test analysis of mock- or 24-h MRSA-infected TLR2/4/9 triple KO immortalized BMDM (Tlr2/4/9−/− iBMDM). (F) Basal respiration of mock- or 24-h MRSA-infected WT or Tlr2/4/9−/− iBMDMs. (G) Seahorse Mito Stress Test analysis of mock- or 24-h MRSA-infected IFNAR1 KO (Ifnar1−/−) iBMDMs. (H) Basal respiration quantification in mock- or 24-h MRSA-infected WT or Ifnar1−/− iBMDMs. (I) Quantification of basal respiration or ECAR in WT BMDMs infected with MRSA for the indicated duration. (J) Data from (I) presented as an energy map. (K and L) Representative confocal micrographs from high-content imaging of NF-κB p65 (K) and phospho-STAT1 (L) immunofluorescence staining of BMDMs infected with MRSA (MOI 20) for the indicated time. (M) Automated analysis of the average nuclear:cytoplasmic ratio of NF-κB p65 and intensity of phospho-STAT1 per cell. (N) Graphical representation of the immunometabolic sequence of the first 24 h of MRSA infection. Graphs represent mean of n ≥ 3 biological replicates with SD error bars, except (M), which represents the mean and 95% confidence interval of ≥ 492 cells per condition pooled across three biological replicates. p values were calculated using a one-way ANOVA with Tukey’s post-test (B, D, and I) or two-way ANOVA with Sidak’s post-test (F and H). *p < 0.05; **p < 0.01; ***p < 0.001; ****p < 0.0001.
Figure 3.
Figure 3.. NO disrupts the ETC in MRSA-infected macrophages
(A) LC-MS-based targeted metabolomics analysis in mock- or 24-h MRSA-infected (MOI 20) WT or Ifnar1−/− iBMDMs. Metaboanalyst 5.0 pathway enrichment analysis using KEGG annotation of the top five significantly changed MRSA-induced metabolic pathways between WT and Ifnar1−/− iBMDMs. (B) Highlighted analysis of peak area from iNOS-related metabolites arginine and citrulline in mock- or 24-h MRSA-infected WT and Ifnar1−/− iBMDMs. (C) Griess assay from mock- or 24-h MRSA-infected WT or Ifnar1−/− iBMDMs treated with or without the iNOS inhibitor L-NIL (40 μM). (D) SDS-PAGE and immunoblot analysis of iNOS and ACTIN in mock- or 24-h MRSA-infected WT or Ifnar1−/− BMDM whole-cell lysates. (E) Seahorse XF analysis of the rate of OCR in 24-h MRSA-infected WT and Nos2−/− iBMDMs using the Mito Stress Test assay, with additions of oligomycin (O), FCCP, rotenone (R), and antimycin A (A) at the indicated time points. (F) Quantification of basal respiration in mock- or 24-h MRSA-infected WT and Nos2−/− iBMDMs. (G) SDS-PAGE and immunoblot analysis of complex I subunit NDUFB8, complex II subunit SDHB, complex III subunit UQCRC2, complex IV subunit MTCO1, and complex V subunits ATP5A, iNOS, and ACTIN. (H) Quantification of the abundance of NDUFB8, SDHB, and MTCO1 relative to ATP5A in mock- and MRSA-infected WT and Nos2−/− iBMDMs, presented as the percentage of the paired mock sample. Graphs represent the mean of n ≥ 3 biological replicates with SD error bars. p values were calculated using two-way ANOVA with Sidak’s post-test (B, C, F, and H). *p < 0.05; **p < 0.01; ***p < 0.001; ****p < 0.0001.
Figure 4.
Figure 4.. Nitric oxide biases macrophage cytokine production toward type I IFN during MRSA infection
(A) ELISA analysis of secreted IL-1β, IFN-β, and TNF-α from mock- or 24-h MRSA-infected WT and Nos2−/− BMDMs. (B) ELISA analysis of secreted IL-1β, IFN-β, and TNF-α from WT BMDM treated ± NO donor DETA-NONOate (500 μM) for 24 h, washed with fresh media, and then mock or MRSA infected for 24 h. (C) ELISA analysis of secreted IL-1β and IFN-β after 6- or 24-h MRSA infection ± sub-toxic doses of RC inhibitors, dimethyl malonate (complex II inhibitor; 10 mM), antimycin A (complex III inhibitor; 1 μM), and piericidin A (complex I inhibitor; 100 nM). Graphs represent mean of n = 3 biological replicates with SD error bars. p values were calculated using two-way ANOVA with Sidak’s post-test (A–C). *p < 0.05; **p < 0.01; ***p < 0.001; ****p < 0.0001.
Figure 5.
Figure 5.. Chronic type I IFN short-circuits macrophage metabolic programming by preventing lactate-mediated iNOS repression
(A) Immunoblot analysis of iNOS and ACTIN from naive or 24-h IFN-β-conditioned (400 U/mL) iBMDMs after 12-, 24-, 36-, or 48-h MRSA infection (MOI 20). (B) Quantification of iNOS relative to ACTIN across multiple experiments. (C) Measurement of extracellular lactate in naive or 24-h IFN-β-conditioned iBMDMs after 24-h MRSA infection. (D) Automated confocal microscopic analysis of H3K18-Lac IFA from naive or 24-h IFN-β-conditioned iBMDMs after 24-h MRSA infection or 24-h lactate (10 mM) treatment. (E) Automated quantification of the average nuclear H3K18-Lac intensity per cell. (F) Immunoblot analysis of iNOS and ACTIN from naive or 24-h IFN-β-conditioned iBMDMs following 48-h MRSA infection in the presence or absence of supplemented lactate (10 mM) or LDH inhibitor sodium oxamate (LDHi; 10 mM). (G) Quantification of iNOS relative to ACTIN from Figure 5F. (H) Schematic presentation of CUT&Run assay used to detect H3K18-Lac proximal to the Nos2 promoter. (I) Spike-in DNA and input-normalized Nos2 detection following H3K18-Lac CUT&Run, presented as fold change over average naive mock from naive or 24-h IFN-β-conditioned iBMDMs followed by 24-h mock or MRSA infection. (J) ELISA analysis of secreted IL-1β and IFN-β from naive or 24-h IFN-β-conditioned iBMDMs that were mock or MRSA infected for 24 or 48 h. (K) ELISA analysis of secreted IL-1β and IFN-β from 24-h IFN-β-conditioned iBMDMs after 48-h MRSA infection in the presence or absence of supplemented lactate. Graphs represent the mean of n ≥ 3 biological replicates with SD error bars. p values were calculated using a two-way ANOVA with Sidak’s post-test (B, C, E, G, J, and K). *p < 0.05; **p < 0.01; ***p < 0.001; ****p < 0.0001.
Figure 6.
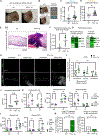
Figure 6.. Chronic type I IFN expression in the skin exacerbates iNOS expression, increases inflammation, and impairs wound healing during MRSA infection
Cutaneous MRSA infection in the IFN-κ Tg mouse model which overexpresses IFN-κ in keratinocytes under the Keratin-14 promoter. Mice were infected with an allergy needle on one ear with MRSA (8e8 colony-forming units [CFU]; USA300 lux). (A) Photographs of WT and IFN-κ Tg MRSA-infected wound sites. (B) Analysis overview for assessment of ear, erythema, and wound area. (C and D) Blinded analysis of wound (C) and erythema (D) area at day 3 post-MRSA infection. (E) H&E staining of WT and IFN-κ Tg PL skin sections (sampled from erythematous area) from day 3 post-MRSA infection. (F) Blinded pathology assessment of PL abscess (neutrophilic inflammation) maximal dimension length. (G) Blinded pathology assessment of neutrophil abundance in tissue outside of abscesses, scored as absent, low, intermediate (Mid.), or high and vascular phenotypes, where microhemorrhage (Hem.), congestion (Cong.), and telangiectasia (Tel.) were noted. (H) Immunohistofluorescence analysis of iNOS protein in PL skin of uninfected or MRSA-infected WT and IFN-κ Tg mice at D3 post-infection. (I) Mean iNOS intensity within uninfected (dermal) or MRSA-infected (dermal or PL) from Figure 6H, where each data point represents a unique tissue section from four biological replicates per genotype. (J) Nitrite detection by Griess assay from wound and PL skin extracts of WT and IFN-κ Tg mice at day 7 post-infection. (K) ELISA analysis of PL and wound extract IL-1β, IFN-β, and MPO at days 3 and 7 post-infection. (L) ELISA analysis of plasma IL-1β and IFN-β at days 3 and 7 post-infection. (M) CFU detection above a threshold limit of detection (L.O.D.) value (>50 CFU) from mechanical homogenates from lungs or kidneys at day 7 post-infection from WT and IFN-κ Tg mice. Individual male IFN-κ Tg and WT mice (solid green circles and empty green circles, respectively), and female IFN-κ Tg and WT mice (solid purple and empty purple circles, respectively) are shown, except for (I), which represents pooled data. For wound quantification, graphs represent the mean of n ≥ 15 mice across two independent experiments with SEM error bars. Other measurements represent the mean of four or more mice per genotype with SEM error bars. p values were calculated using a χ2 test for binary results (M), unpaired t test (C, D, F, and J), or two-way ANOVA with Sidak’s post-test for grouped analysis (I, K, and L) *p < 0.05; **p < 0.01.

References

    1. Tandon P, Abrams ND, Carrick DM, Chander P, Dwyer J, Fuldner R, Gannot G, Laughlin M, McKie G, PrabhuDas M, et al. (2021). Metabolic Regulation of Inflammation and Its Resolution: Current Status, Clinical Needs, Challenges, and Opportunities. J. Immunol. 207, 2625–2630. 10.4049/jimmunol.2100829. - DOI - PMC - PubMed
    1. Gaber T, Strehl C, and Buttgereit F (2017). Metabolic regulation of inflammation. Nat. Rev. Rheumatol. 13, 267–279. 10.1038/nrrheum.2017.37. - DOI - PubMed
    1. Pålsson-McDermott EM, and O’Neill LAJ (2020). Targeting immunemetabolism as an anti-inflammatory strategy. Cell Res. 30, 300–314. 10.1038/s41422-020-0291-z. - DOI - PMC - PubMed
    1. Liu Y, Xu R, Gu H, Zhang E, Qu J, Cao W, Huang X, Yan H, He J, and Cai Z (2021). Metabolic reprogramming in macrophage responses. Biomark. Res. 9, 1. 10.1186/s40364-020-00251-y. - DOI - PMC - PubMed
    1. Viola A, Munari F, Sánchez-Rodríguez R, Scolaro T, and Castegna A (2019). The Metabolic Signature of Macrophage Responses. Front. Immunol. 10, 1462. 10.3389/fimmu.2019.01462. - DOI - PMC - PubMed

Publication types

MeSH terms