. 2024 Aug 20;5(8):101669.
doi: 10.1016/j.xcrm.2024.101669. Epub 2024 Aug 9.

Integrative proteomics identifies a conserved Aβ amyloid responsome, novel plaque proteins, and pathology modifiers in Alzheimer's disease

Affiliations

Integrative proteomics identifies a conserved Aβ amyloid responsome, novel plaque proteins, and pathology modifiers in Alzheimer's disease

Yona Levites et al. Cell Rep Med. .

Abstract

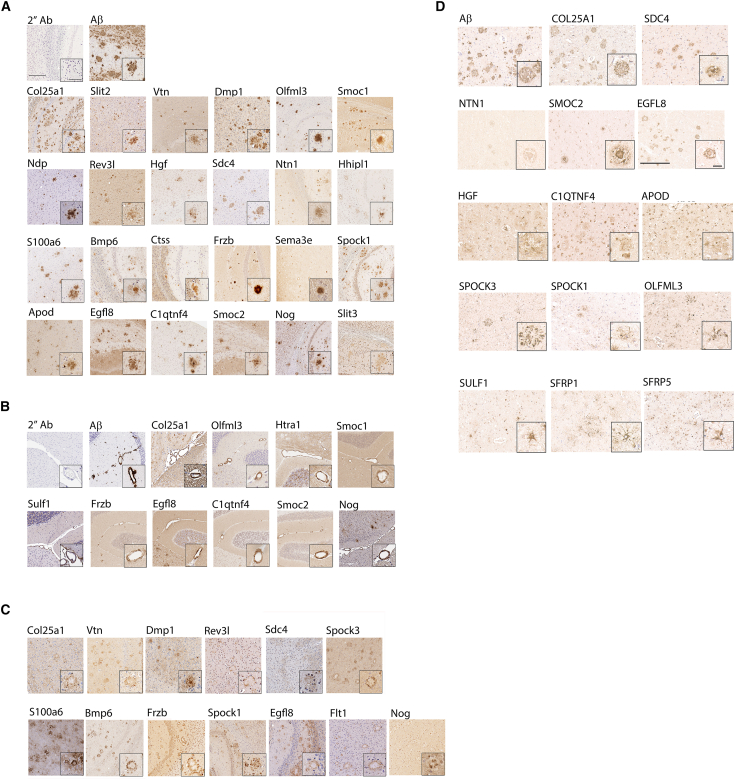
Alzheimer's disease (AD) is a complex neurodegenerative disorder that develops over decades. AD brain proteomics reveals vast alterations in protein levels and numerous altered biologic pathways. Here, we compare AD brain proteome and network changes with the brain proteomes of amyloid β (Aβ)-depositing mice to identify conserved and divergent protein networks with the conserved networks identifying an Aβ amyloid responsome. Proteins in the most conserved network (M42) accumulate in plaques, cerebrovascular amyloid (CAA), and/or dystrophic neuronal processes, and overexpression of two M42 proteins, midkine (Mdk) and pleiotrophin (PTN), increases the accumulation of Aβ in plaques and CAA. M42 proteins bind amyloid fibrils in vitro, and MDK and PTN co-accumulate with cardiac transthyretin amyloid. M42 proteins appear intimately linked to amyloid deposition and can regulate amyloid deposition, suggesting that they are pathology modifiers and thus putative therapeutic targets. We posit that amyloid-scaffolded accumulation of numerous M42+ proteins is a central mechanism mediating downstream pathophysiology in AD.

Keywords: Alzheimer’s disease; Midkine; Pleiotrophin; aggregation; amyloid; animal models; plaques; proteomics.


Conflict of interest statement

Declaration of interests The authors declare no competing interests.

Figures

None
Graphical abstract
Figure 1
Figure 1
TMT-MS analysis and gene ontologies of CRND8 mice versus non-Tg brains (A) Volcano plot of 6-month cohort. (B) Volcano plot of 12-month cohort. (C) Volcano plot of 18-month cohort. (D) Correlation of CRND8 brain DEPs between the 12-month (x) and 18-month cohorts (y). Numbers underlined and in italics list the number of genes in each quadrant of this and other x-y plots. (E) Correlation of brain proteins between the 5XFAD 18-month (x) and CRND8 18-month cohorts (y). (F) Correlation of brain DEPs between the 5XFAD 18-month (x) and CRND8 18-month cohorts (y). (G) Thematic grouping of gene ontology categories of DEPs increased in all CRND8 cohorts. (H) Thematic grouping of gene ontology categories of DEPs decreased in all CRND8 cohorts. (I) Thematic grouping of gene ontology categories of DEPs (log2FC > 0.2) and increased by >2-fold in the 18-month CRND8 cohort relative to the 6-month cohort. (J) Thematic grouping of gene ontology categories of DEPs (log2FC > 1) and increased by >2-fold in the 18-month CRND8 cohort relative to the 6-month cohort. (K) Thematic grouping of gene ontology categories of DEPs (log2FC < −0.1) and decreased by >2-fold in the 18-month CRND8 cohort relative to the 6-month cohort. The data underlying this figure are found in Table S1. Additional proteomic data for the CRND8 studies are found in Tables S2, S3, and S4. Lists of all genes used for gene ontology analyses are provided in Table S7.
Figure 2
Figure 2
Integrated mouse and human brain proteome comparison reveals concordant and discordant changes between CRND8 mice brains and human AD (A) 7,588 mouse orthologs of human brain proteins quantified in both proteomes of the consensus human AD brain proteome (AD vs. Ctrl) and the 18-month mice (CRND8 Tg vs. non-Tg) are compared by their effect size (log2FC in human (x) vs. mouse (y). Numbers underlined and in italics list the number of genes in each quadrant of this and other x-y plots. (B) Proteins in A were filtered to retain only orthologs nominally significantly changed in both human and the 18-month mice. (C) 6,794 mouse orthologs of human brain proteins quantified in both proteomes of the consensus human AD brain proteome (AD vs. control) and the 6-month mice (CRND8 Tg vs. non-Tg) are compared by their effect size in human (x) vs. mouse (y). (D) Proteins in C were filtered to retain only orthologs nominally significantly changed in both human and the 6-month mice. (E) The human AD consensus brain network mapped to the CRND8 mouse brain shows trait correlations in human (outer two tracks; red, positive correlation to white, no correlation, to blue, negative correlation), effect size directionality and significance for AD (third track from the outside), the effect size directionalities and significance for CRND8 Tg vs. non-Tg at 6, 12, and 18-month in cognate mouse synthetic modules (Synth eigenproteins, EP), and hypergeometric overlap significance with cell type marker lists, indicating cell type enrichment of modules in the innermost track. Modules are numbered M1 to M44, ordered by bicor correlation relatedness (dendrogram), from M6, top left, to M37, top right, in a counterclockwise direction. Statistical values underlying the heatmap are in Table S6. (F) The 44 consensus modules were assessed for a fraction of module member proteins achieving differentially expressed protein (DEP) status, discerning decreased DEPs in disease or Tg as blue, and increased DEPs as red in a stacked bar chart. Human and mouse bars for each module are shown side-by-side and left and right, respectively, above each module description. Descriptions below the numbered identifiers match the order of modules presented in the previous panel. The color of the description text indicates concordant increases (red), decreases (blue), discordant in direction of change (gold), or non-concordant (black). (G) Mouse orthologs CRND8 18-month Tg vs. non-Tg effect sizes are compared to the AD vs. control effect sizes, module by module, with selected modules shown here. Pearson correlation rho and Student’s significance of correlation are provided along with the number of orthologs mapping to each consensus module plotted. Text color of each module plot title matches the scheme described for the previous panel. Visualization for human-mouse correlations of all 44 modules’ proteins across human and mouse is available online, as described in STAR Methods and on .synapse.org
Figure 3
Figure 3
Select consensus human AD brain synthetic module eigenproteins show age-dependent changes in the CRND8 Tg mice Nine consensus human modules are shown for the network of healthy control, pathology-bearing asymptomatic AD (AsymAD), and symptomatic AD (AD) individuals totaling N = 488 (left panels). To the right, the mouse orthologs of hub proteins for these modules were used to calculate the first principal component of variance in the 6, 12, and 18-month mouse proteomes, allowing for extrapolation of the modules into Tg and non-Tg mice, determination of effect size by module in each mouse cohort, and the significance of Tg effect within each module. Significant one-way ANOVA p values are colored red. Note the y axis is different across ages, and in many modules, the eigenprotein change between Tg and non-Tg mice increases dramatically with age. Visualization of all 44 modules translated to the first principal component of variance in mouse time points is available online, as described in STAR Methods and on synapse.org.
Figure 4
Figure 4
Mdk/MDK and Ptn/PTN colocalize with Aβ in amyloid plaques and CAA in CRND8 mice and human AD (A) Paraffin slides containing brain tissue from 15 to 18-month CRND8 mice were stained with mouse anti-pan-Aβ, sheep anti-Mdk, or rabbit anti-Ptn antibodies. Representative low-magnification images from cortex and hippocampus (scale 500 μm) and high-magnification images (inset, scale 50 μm) were taken from cortex (plaques) and cerebellum (CAA). Non-transgenic (ntg) littermates were used as background controls. (B) Representative low magnification (scale 100 μm) and high magnification (inset, scale 30 μm) of postmortem paraffin-embedded tissue sections of high AD human frontal cortex from a patient with high AD neuropathological changes stained for MDK and PTN. (C) Plaques and CAA on paraffin slides containing brain tissue from old CRND8 mice were stained with anti-Mdk and anti-Ptn antibodies and visualized with fluorescent secondary antibodies (anti-rabbit green and anti-sheep red), scale 50 μm. (D) Plaques and CAA on paraffin slides containing brain tissue from old CRND8 mice were stained with anti-pan-Aβ, anti-Mdk, or anti-Ptn antibodies and visualized with Thio-S (green) or fluorescent secondary antibodies (anti-mouse red, anti-rabbit red, and anti-sheep red), scale 50 μm.
Figure 5
Figure 5
M42+ DEPs colocalize with amyloid pathology Brain tissue from 15 to 18-month CRND8 mice was stained with the anti-sera against the indicated proteins. Anti-pan-Aβ antibody served as a reference for amyloid pathology, and secondary antibody alone—as a negative control. All proteins are listed in order of log2FC (highest to lowest). Representative low-magnification (scale 200 μm) and high-magnification (inset, scale 50 μm) images. See Figure S7 for non-Tg staining. (A) DEPs in amyloid plaques in the CRND8 cortex. (B) DEPs detected in CAA in the cerebellum. (C) DEPs detected in dystrophic processes surrounding amyloid plaques in the cortex. (D) Representative low magnification (scale 100 μm) and high magnification (inset, scale 30 μm) of postmortem paraffin-embedded tissue sections of high AD human frontal cortex from patients with high AD neuropathological changes stained for Aβ, EGFL8, C1QTNF4, COL25A1, HGF, APOD, SDC4, NTN1, SMOC2, OLFML3, SPOCK3, SPOCK1, SULF1, SFRP5, and SFRP1. There is selective staining of plaques by antisera for COL25A1, SDC4, NTN1, SMOC2, and EGFL8. Weaker staining of plaques and cellular staining is observed for HGF, C1QTNF4, and APOD. Dystrophic processes are stained with anti-serum to SPOCK3, SPOCK1, and OLFML3. Glial cells are detected with anti-sera to SULF1, SRRP5, and SFRP1.
Figure 6
Figure 6
Mdk and PTN overexpression increase parenchymal Aβ amyloid deposition and CAA in 6-month CRND8 mice Mice were intracerebrally injected with rAAV2/8-Mdk, rAAV2/8-PTN, or not injected (control) at P0 and aged 6 months. (A and B) Representative images of cortex and hippocampus (A) or CAA (B) stained with biotinylated anti-Aβ mAb 33.1.1 (anti-Aβ 1–16). Scale bar: 500 μm, 50 μm (inset). Quantification data of the entire brain plaque count in three non-consecutive sections represented by a scatter dot plot of male (closed circle/square) and female (open circle/square) ± standard error of the mean. n = 5–15. Statistical analyses by one-way ANOVA test (∗, p < 0.05; ∗∗∗, p < 0.001). (C) RIPA, 2% SDS, and 70% formic acid (FA) extracted Aβ42 and Aβ40 levels were detected by ELISA and plotted as scatter dot plot of male (closed circle/square) and female (open circle/square) ± standard error of the mean. n = 5–12. Aβ42 and Aβ40 levels were quantified with corresponding one-way ANOVA and paired comparison test (∗, p < 0.05; ∗∗, p < 0.01, ∗∗∗, p < 0.001). (D) MDK and PTN accelerate amyloid aggregation in vitro as detected by real-time thioflavin T (ThT) assay.
Figure 7
Figure 7
Amyloid binding and co-localization in TTR amyloids (A) M42+ proteins secreted into the media of transfected HEK cells bind to Aβ42 and AVS amyloids. Data are representative of three independent experiments. (B) Representative images of immunohistochemical stains for MDK, PTN, or Thio-S on human cardiac amyloidosis sections. Scale bar, 50 μm.

Update of

References

    1. Hardy J., Selkoe D.J. The amyloid hypothesis of Alzheimer's disease: progress and problems on the road to therapeutics. Science. 2002;297:353–356. - PubMed
    1. Golde T.E. Alzheimer's disease - the journey of a healthy brain into organ failure. Mol. Neurodegener. 2022;17:18. doi: 10.1186/s13024-022-00523-1. - DOI - PMC - PubMed
    1. Budd Haeberlein S., Aisen P.S., Barkhof F., Chalkias S., Chen T., Cohen S., Dent G., Hansson O., Harrison K., von Hehn C., et al. Two Randomized Phase 3 Studies of Aducanumab in Early Alzheimer's Disease. J. Prev. Alzheimers Dis. 2022;9:197–210. doi: 10.14283/jpad.2022.30. - DOI - PubMed
    1. Sims J.R., Zimmer J.A., Evans C.D., Lu M., Ardayfio P., Sparks J., Wessels A.M., Shcherbinin S., Wang H., Monkul Nery E.S., et al. Donanemab in Early Symptomatic Alzheimer Disease: The TRAILBLAZER-ALZ 2 Randomized Clinical Trial. JAMA. 2023;330:512–527. doi: 10.1001/jama.2023.13239. - DOI - PMC - PubMed
    1. van Dyck C.H., Swanson C.J., Aisen P., Bateman R.J., Chen C., Gee M., Kanekiyo M., Li D., Reyderman L., Cohen S., et al. Lecanemab in Early Alzheimer's Disease. N. Engl. J. Med. 2023;388:9–21. doi: 10.1056/NEJMoa2212948. - DOI - PubMed