. 2024 Aug 19;4(8):100837.
doi: 10.1016/j.crmeth.2024.100837. Epub 2024 Aug 9.

Defining spatial nonuniformities of all ipRGC types using an improved Opn4cre recombinase mouse line

Affiliations

Defining spatial nonuniformities of all ipRGC types using an improved Opn4cre recombinase mouse line

Brannen Dyer et al. Cell Rep Methods. .

Abstract

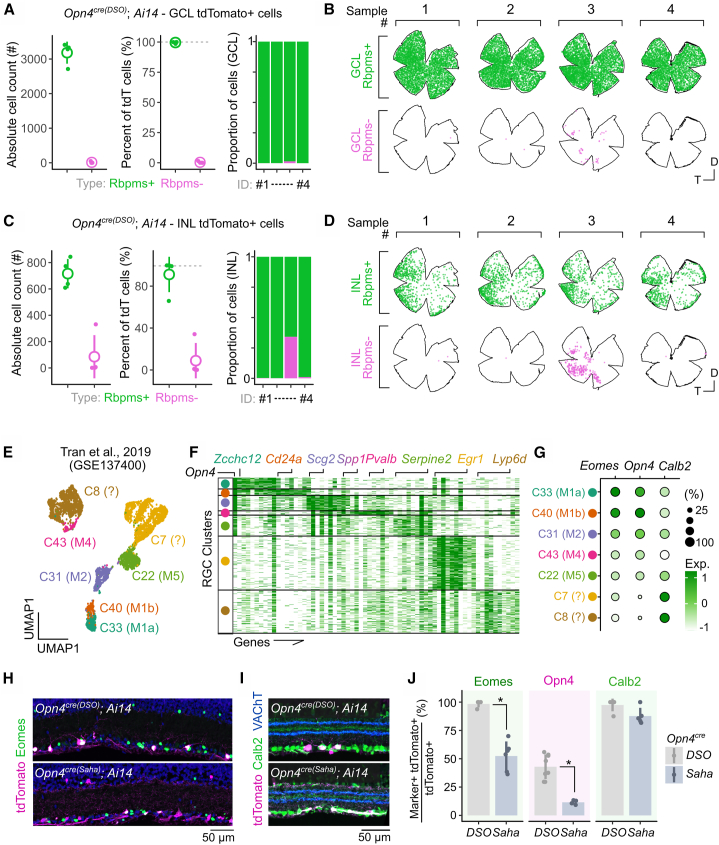
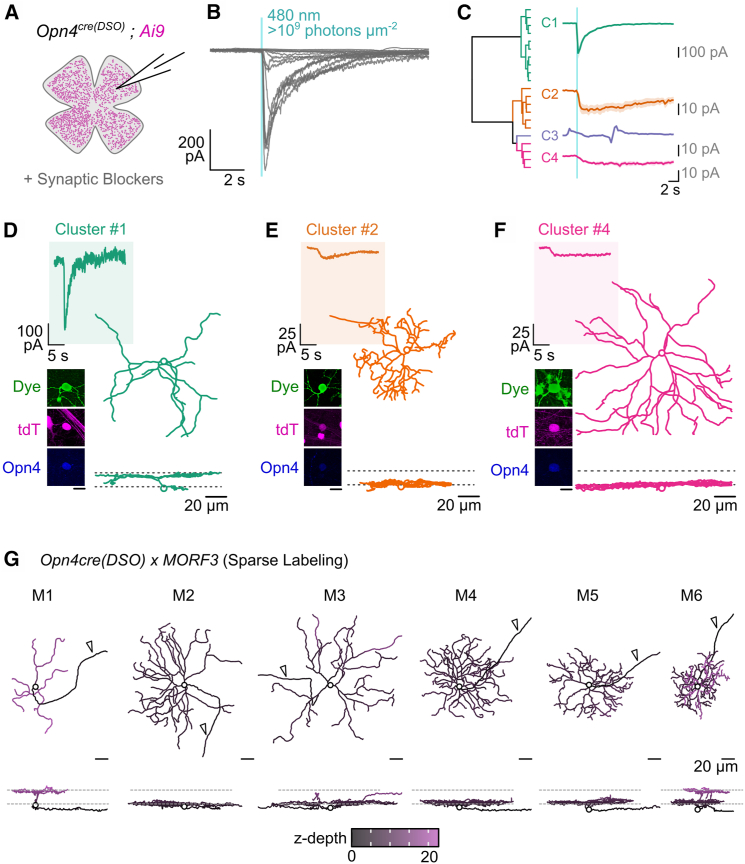
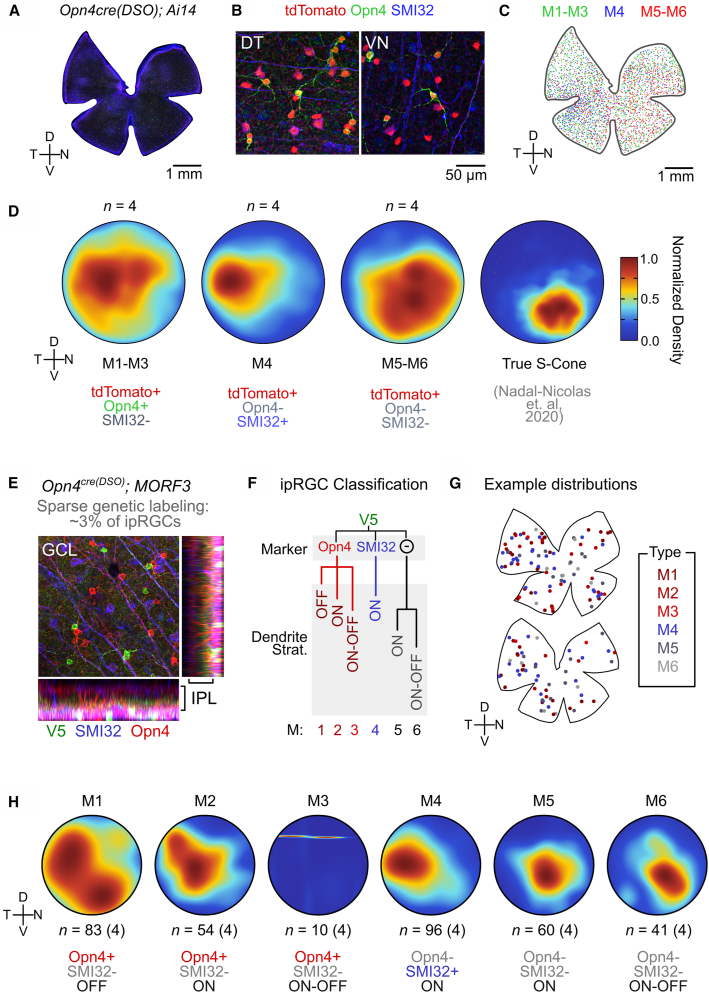
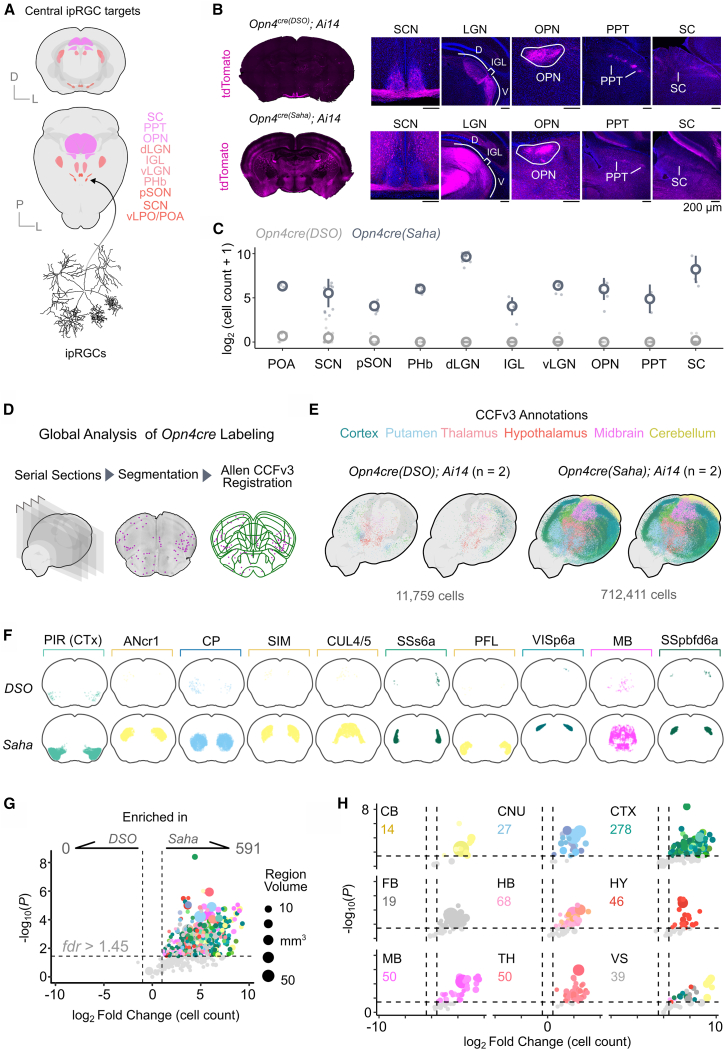
Intrinsically photosensitive retinal ganglion cells (ipRGCs) play a crucial role in several physiological light responses. In this study, we generate an improved Opn4cre knockin allele (Opn4cre(DSO)), which faithfully reproduces endogenous Opn4 expression and improves compatibility with widely used reporters. We evaluated the efficacy and sensitivity of Opn4cre(DSO) for labeling in retina and brain and provide an in-depth comparison with the extensively utilized Opn4cre(Saha) line. Through this characterization, Opn4cre(DSO) demonstrated higher specificity in labeling ipRGCs with minimal recombination escape. Leveraging a combination of electrophysiological, molecular, and morphological analyses, we confirmed its sensitivity in detecting all ipRGC types (M1-M6) and defined their unique topographical distribution across the retina. In the brain, the Opn4cre(DSO) line labels ipRGC projections with minimal labeling of cell bodies. Overall, the Opn4cre(DSO) mouse line represents an improved tool for studying ipRGC function and distribution, offering a means to selectively target these cells to study light-regulated behaviors and physiology.

Keywords: CP: neuroscience; ipRGC; mouse; recombinase; retina.


Conflict of interest statement

Declaration of interests The authors declare no competing financial or non-financial interests.

Figures

None
Graphical abstract
Figure 1
Figure 1
The design of Opn4cre alleles (A) Opn4 gene structure in the mouse (top). Design of the Opn4cre(DSO) line (middle). Design of the Opn4cre(Saha) line (bottom). In this allele, the majority of the Opn4 gene is deleted and replaced with a Cre cassette comprising an upstream human beta globin intron (HBBi) and a nuclear localization signal (NLS). UTR, untranslated region. (B) Melanopsin immunostaining in whole mount retina of heterozygous (left) and homozygous (right) Cre mice for both recombinase lines. Animal age = postnatal day 30 (P30).
Figure 2
Figure 2
ipRGC labeling efficiency within the inner retina of each Opn4cre line (A) Representative flat-mount retina from Opn4cre(DSO); Ai14 mice. (B) Reconstruction of flat-mount retina in (A) colored by combination of tdTomato expression (Ai14, magenta) and Opn4 co-expression (green) in both the GCL and INL. (C and D) Representative flat-mount and reconstructed retina from Opn4cre(Saha); Ai14 presented across the GCL and INL as in (A) and (B). (E–G) Analysis of Cre-driven recombination across both Cre lines crossed to Ai14. (E) Absolute cell counts of tdTomato+ Opn4+ cells in the GCL (DSOn = 8; Sahan = 4 animals) with gray box depicting min and max range of published and dashed line representing mean of published counts. (F) Same as (E) but comparing tdTomato+ Opn4− cells in the GCL; gray box and line are mirrored from (E) (∗∗p < 0.01, Wilcoxon signed-rank test). (G) Percentage of Opn4+ cells that are tdTomato− in the GCL. GCL, ganglion cell layer; INL, inner nuclear layer. D, dorsal; N, nasal; V, ventral; T, temporal. Small dots, individual samples (n); large circles, group means; error bars, standard deviation. Animal age = postnatal day 60 (P60).
Figure 3
Figure 3
Molecular characterization of cells labeled in the Opn4cre(DSO) mouse line (A) Colocalization analysis of Rbpms in tdTomato+ cells across the GCL in the Opn4cre(DSO) line as absolute counts (left), percent of tdTomato+ cells (middle), and individual sample proportion plots (right) (n = 4 animals). (B) Representative spatial analysis of Rbpms and tdTomato colocalized cells in the GCL. (C) Same samples and analysis as in (A) but within the INL. (D) Same samples and analysis as in (B) but within the INL. (D and E) Reanalysis of Tran and Shekhar et al. (2019) to identify shared and unique genes between ipRGC (C22–C43) and putatively ipRGC (C7 and C8) clusters. (D) 2D UMAP embedding of clusters from Tran and Shekhar et al. (2019). (E) Heatmap depiction of significantly differentially expressed genes (DEGs) between each cluster, ordered by cells as rows and genes as columns. (F) Dotplot of shared ipRGC genes Eomes, Opn4, and Calb2. Expression scale bar is identical between (E) and (F). (G–I) Validation and comparison of marker expression in tdTomato+ cells from both Cre lines crossed to Ai14. (G and H) Representative confocal images of Eomes staining (G) and Calb2 staining (H). (I) Comparison of tdTomato+ colocalization with different markers between both Cre lines (EomesDSO vs Sahap < 0.05; Opn4DSO vs Sahap < 0.05; Calb2DSO vs Sahap > 0.05; Wilcoxon signed-rank test with FDR correction). Bar height, mean; error bars, standard deviation. Animal age = postnatal day 60 (P60).
Figure 4
Figure 4
Electrophysiological and morphological assessment of ipRGCs in the Opn4cre(DSO) line (A) Schematic depicting whole-cell recording of Opn4cre(DSO); Ai9 cells from the retina. (B) Current traces of all recorded cells held at −60mV and given a 100-ms full-field flash of >9 log photons μm−2 sec−1; cyan region, light pulse. (C) Hierarchical clustering dendrogram and cluster averaged responses to light; bold line, mean response; shaded region, standard error. (D–F) Representative responses, confocal images, and 3D morphological reconstructions of cells from cluster C1 (D), C2 (E), and C4 (F). (G) Representative 3D reconstructions of ipRGC types from Opn4cre(DSO); MORF3 retina (n = 5) with XY (top) and XZ profile (bottom) with z-depth coding. S, seconds. Arrowhead, axon. Animal age = P60 (A–F); P30 (G).
Figure 5
Figure 5
Spatial distribution of ipRGC types in the Opn4cre(DSO) mouse line (A) Flat-mount representative image of Opn4cre(DSO); Ai14 stained against tdTomato (red), Opn4 (green), and SMI32 (blue). (B) Representative magnification of fields in the dorsotemporal (DT) and ventronasal (VN) locations highlighting labeling diversity. (C) Same flat-mount retina in (A) but with computed labels for each coarse ipRGC type: M1–M3 (tdTomato+ Opn4+ SMI32−), M4 (tdTomato+ Opn4- SMI32−), and M5–M6 (tdTomato+, Opn4−, SMI32−). (D) Normalized 2D density heatmaps from polar reconstructed retina, averaged across n = 4 per coarse ipRGC type, and analysis of data from Nadal-Nicolas et al. (2020) depicting true S-cone distributions. (E) Representative high-magnification confocal stack of sparse labeling and multiple markers of ipRGCs. (F) Decision tree to define each ipRGC type using a combination of markers and dendritic stratification. (G) Representative flat-mount retinae with spatial locations of each ipRGC type used in this analysis. (H) Similar to (D) but for each ipRGC type (total number of cells n is located below each polar plot) averaged across number of animals shown in parentheses. GCL, ganglion cell layer; IPL, inner plexiform layer; D, dorsal; N, nasal; V, ventral; T, temporal. Animal age = postnatal day 60 (P60).
Figure 6
Figure 6
A brain-wide analysis of labeled cells reveals divergent labeling across Cre lines (A) Volumetric projections of ipRGC targets in the Allen Brain Atlas CCFv3. (B) Representative sections and major ipRGC targets in the brain from Opn4cre(DSO); Ai14 (top) and Opn4cre(Saha); Ai14 (bottom) lines. (C) Quantification of absolute cell count, displayed as log2(cell count + 1), for ipRGC targets between lines. (D) Schematization of global cell labeling pipeline used in (E)–(H). (E) Whole-brain point clouds of cells in both lines crossed to Ai14, colored by CCFv3 annotations. (F) Comparison between 10 regions with highest cell counts in the Opn4cre(Saha) line. (G) Volcano plot depicting differences in cell count per region with annotated cells. Numbers at the top depict the number of regions in the CCFv3 with significant enrichment between the lines. (H) Same data as in (G) but segregated by 9 parent structures. Abbreviations are as follows: POA, preoptic area; SCN, suprachiasmatic nucleus; pSON, peri-supraoptic nucleus; PHb, peri-habenula; dLGN, dorsal lateral geniculate nucleus; IGL, intergeniculate leaflet; vLGN, ventral lateral geniculate nucleus; OPN, olivary pretectal nucleus; PPT, posterior pretectal nucleus; SC, superior colliculus; PIR, piriform cortex; ANcr1, crus 1; CP, caudoputamen; SIM, simple lobule; CUL4/5, lobule IV-V; SSs6a, supplemental somatosensory area layer 6a; PFL, paraflocculus; VISp6a, primary visual area layer 6a; MB, midbrain; SSpbfd6a, somatosensory barrel field associated area layer 6a; CB, cerebellum; CNU, caudoputamen; CTX, cortex; FB, fiber tracts; HB, hindbrain; HY, hypothalamus; MB, midbrain; TH, thalamus; VS, ventricle system. Animal age = postnatal day 60 (P60).

References

    1. Do M.T.H. Melanopsin and the Intrinsically Photosensitive Retinal Ganglion Cells: Biophysics to Behavior. Neuron. 2019;104:205–226. doi: 10.1016/j.neuron.2019.07.016. - DOI - PMC - PubMed
    1. Sondereker K.B., Stabio M.E., Renna J.M. Crosstalk: The diversity of melanopsin ganglion cell types has begun to challenge the canonical divide between image-forming and non-image-forming vision. J. Comp. Neurol. 2020;528:2044–2067. doi: 10.1002/cne.24873. - DOI - PMC - PubMed
    1. Schmidt T.M., Kofuji P. Functional and morphological differences among intrinsically photosensitive retinal ganglion cells. J. Neurosci. 2009;29:476–482. doi: 10.1523/jneurosci.4117-08.2009. - DOI - PMC - PubMed
    1. Aranda M.L., Schmidt T.M. Diversity of intrinsically photosensitive retinal ganglion cells: circuits and functions. Cell. Mol. Life Sci. 2021;78:889–907. doi: 10.1007/s00018-020-03641-5. - DOI - PMC - PubMed
    1. Berson D.M., Dunn F.A., Takao M. Phototransduction by retinal ganglion cells that set the circadian clock. Science. 2002;295:1070–1073. doi: 10.1126/science.1067262. - DOI - PubMed

LinkOut - more resources