. 2024 Dec;17(6):1184-1198.
doi: 10.1016/j.mucimm.2024.08.002. Epub 2024 Aug 9.

Exposure to bacterial PAMPs before RSV infection exacerbates innate inflammation and disease via IL-1α and TNF-α

Affiliations

Exposure to bacterial PAMPs before RSV infection exacerbates innate inflammation and disease via IL-1α and TNF-α

Amber R Owen et al. Mucosal Immunol. 2024 Dec.

Abstract

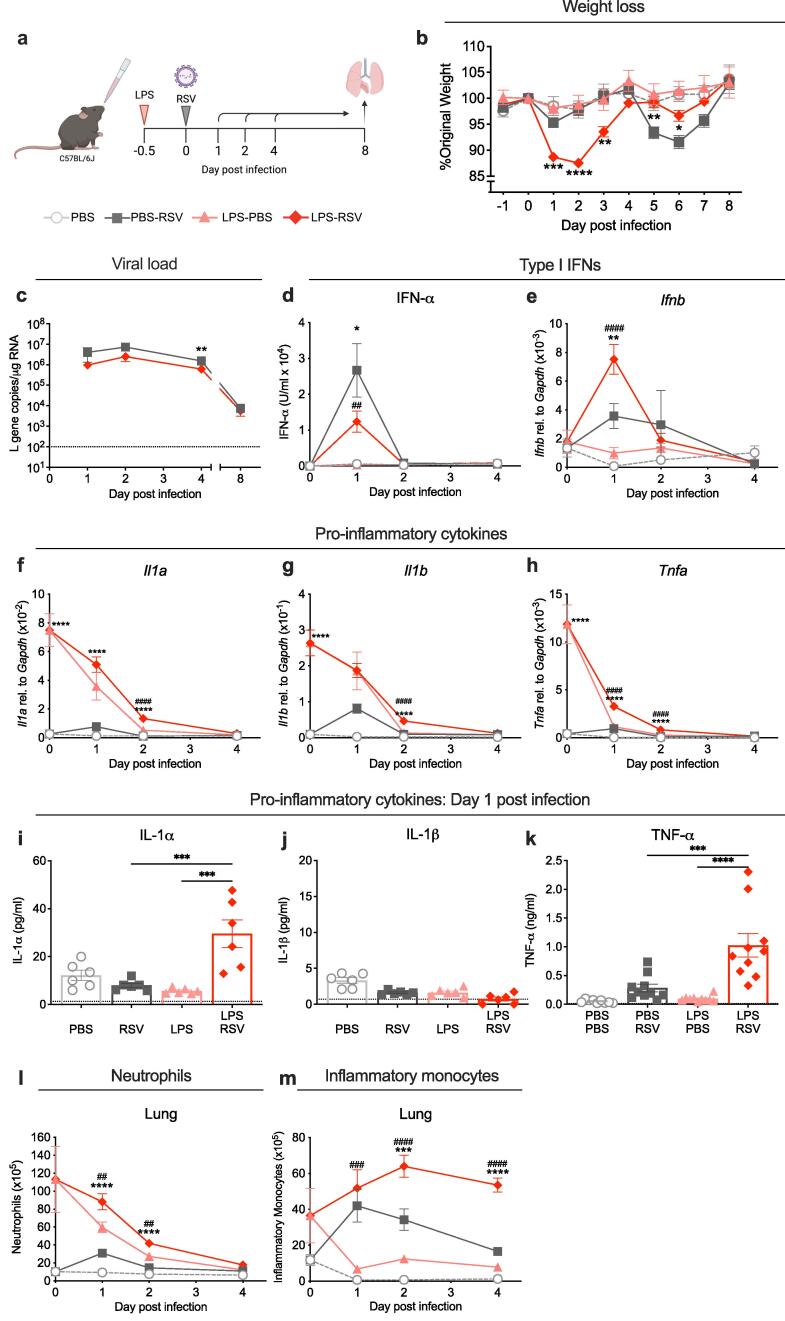
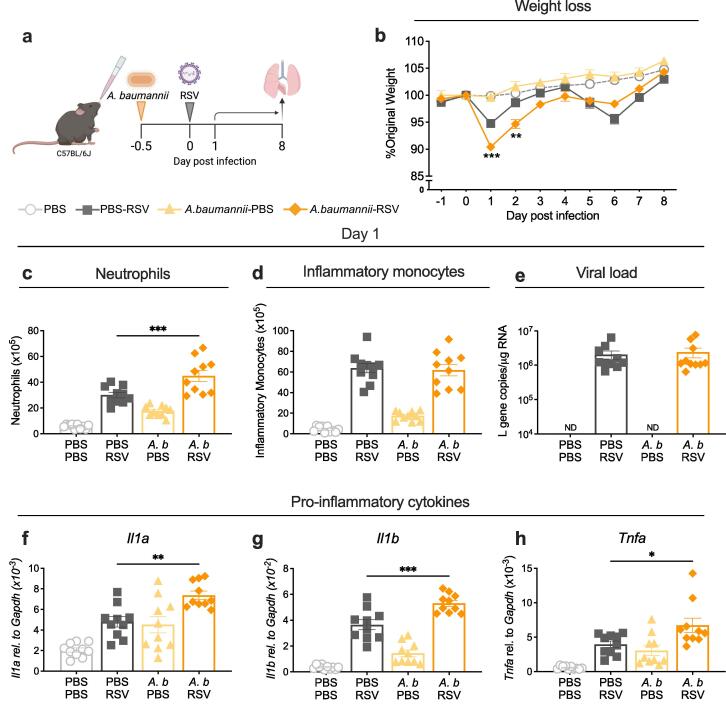
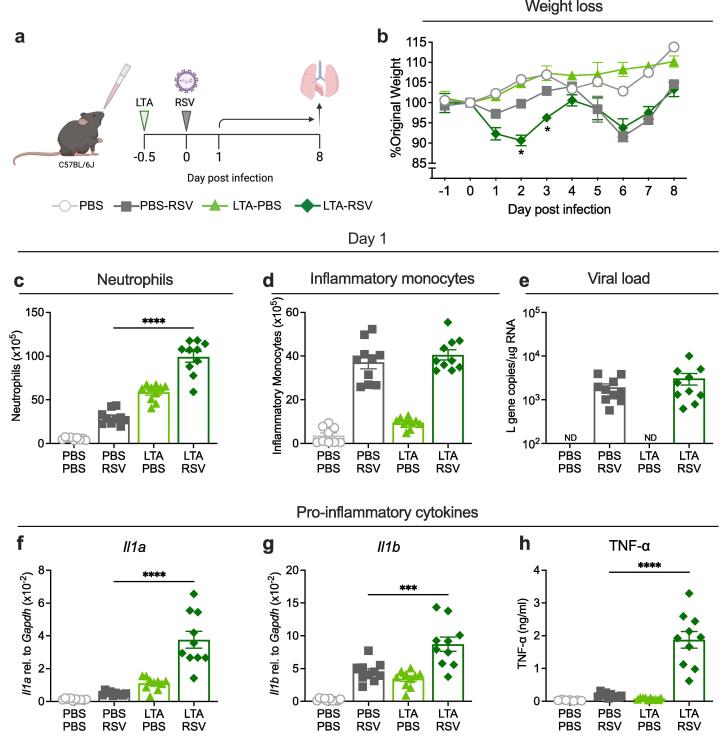
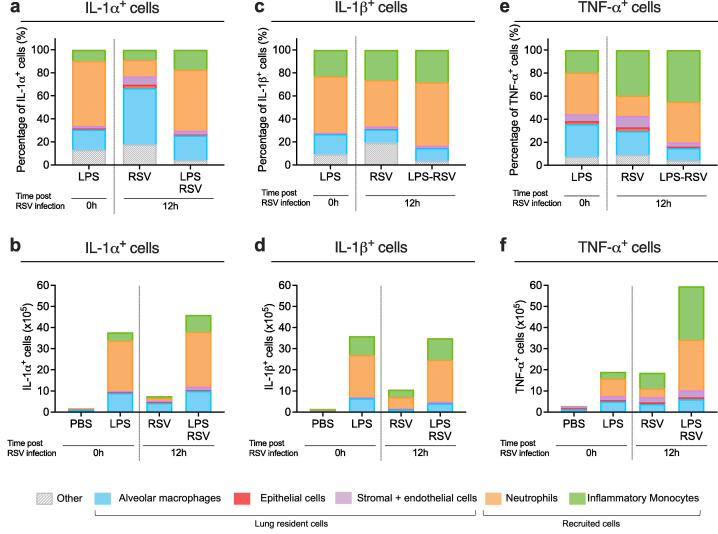
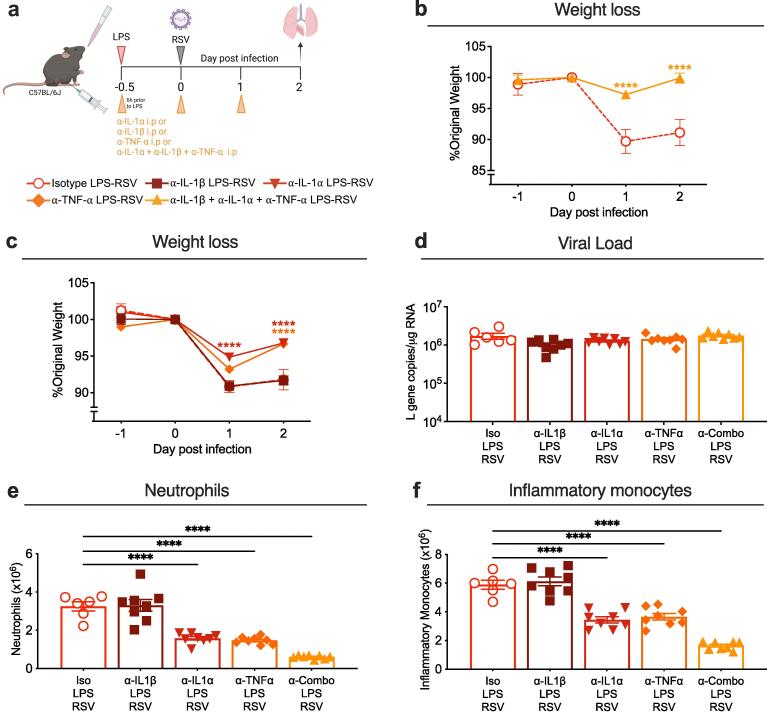
Respiratory syncytial virus (RSV) can cause severe lower respiratory tract infections. Understanding why some individuals get more serious disease may help with diagnosis and treatment. One possible risk factor underlying severe disease is bacterial exposure before RSV infection. Bacterial exposure has been associated with increased respiratory viral-induced disease severity but the mechanism remains unknown. Respiratory bacterial infections or exposure to their pathogen associated molecular patterns (PAMPs) trigger innate immune inflammation, characterised by neutrophil and inflammatory monocyte recruitment and the production of inflammatory cytokines. We hypothesise that these changes to the lung environment alter the immune response and disease severity during subsequent RSV infection. To test this, we intranasally exposed mice to LPS, LTA or Acinetobacter baumannii (an airway bacterial pathogen) before RSV infection and observed an early induction of disease, measured by weight loss, at days 1-3 after infection. Neutrophils or inflammatory monocytes were not responsible for driving this exacerbated weight loss. Instead, exacerbated disease was associated with increased IL-1α and TNF-α, which orchestrated the recruitment of innate immune cells into the lung. This study shows that exposure to bacterial PAMPs prior to RSV infection increases the expression of IL-1α and TNF-α, which dysregulate the immune response resulting in exacerbated disease.

Keywords: Bacteria; Innate immunity; Pro-inflammatory cytokines; Respiratory infections; Virus infections.


Conflict of interest statement

Declaration of competing interest The authors declare that they have no known competing financial interests or personal relationships that could have appeared to influence the work reported in this paper.

Figures

None
Graphical abstract
Fig. 1
Fig. 1
Immune cell recruitment to the lung in mice exposed to LPS before RSV infection. a) Graphic showing experimental design. Mice were exposed intranasally to 1 μg LPS or PBS 12 h before RSV or mock (PBS) infection (day −0.5). At days 0,1, 2, 4 or 8 after infection airway and lung cells were collected for analysis using flow cytometry, ELISA and qPCR. b) Daily weight of mice represented as percentage of original body mass on day 0. c) Viral load in the lungs represented as L gene copy number/μg RNA measured by qPCR and normalised to Gapdh.d) Levels of IFN-α in the BAL supernatant measured by ELISA. Expression of e)Ifnb,f)Il1a, g)Il1b and h)Tnfa in the lung, measured by qPCR and normalised to Gapdh. Levels of i) IL-1α and j) IL-1β in the BAL supernatant measured by multiplex and k) levels of TNF-α in the BAL supernatant measured by ELISA, on day 1 post infection. Total number of l) neutrophils or m) total number of inflammatory monocytes in the lungs over time following RSV infection quantified using flow cytometry. At days 0–4 data are pooled from 2 experiments per time point. At day 1, 2 and 4 after infection, n = 10. At day 8, PBS only and LPS only data are from 1 experiment n = 5; RSV only and LPS-RSV, data are pooled from 2 experiments n = 9. Black dotted line represents the lower limit of detection. Time courses are plotted as mean ± SEM. A one-way ANOVA with multiple comparisons test was carried out for each timepoint. Asterisks represent the p value for LPS-RSV data compared to RSV infected controls; *≤0.05, **≤0.01, ***≤0.001, ****≤0.0001. Hashtags represent the p value for LPS-RSV compared to LPS only controls; #≤0.05, ##≤0.01, ###≤0.001, ####≤0.0001.
Fig. 2
Fig. 2
Acinetobacter baumannii infection before RSV infection drive more weight loss. a) Graphic showing experimental design. Mice were infected with 5x10⁵ CFU A. baumannii (A. b.) or mock (PBS) 12 h before RSV infection (day −0.5). On day 1 after infection lungs and BAL were collected for analysis of the immune response by flow cytometry, ELISA and qPCR. b) Daily weight of mice represented as percentage of original body weight on day 0, in co-infected mice compared with RSV or A. baumannii infection only mice. c) Total number of neutrophils or d) total number of inflammatory monocytes in the lungs at day 1 after RSV infection detected using flow cytometry. e) Viral load represented as L gene copy number/µg RNA measured by qPCR and normalised to Gapdh on day 1 after RSV infection. ND=not detectable. Expression of f)Il1a, g)Il1b andh)Tnfa in the lung, measured by qPCR and normalised to Gapdh. At day 1 after infection, data are pooled from 2 experiments: n = 10. On day 8 after infection, data are pooled from 3 experiments: n = 15. Weight loss is plotted as mean ± SEM. For bar graphs, error bars represent SEM. For weight loss, a two-way ANOVA with multiple comparisons test was carried out to compare the A. baumannii-RSV group with RSV only controls. For all other data, a one-way ANOVA with multiple comparisons test was carried out to compare the A. baumannii-RSV group with RSV only controls. Asterisks represent the p value compared to RSV only controls; *≤0.05, **≤0.01, ***≤0.001, ****≤0.0001.
Fig. 3
Fig. 3
Exposure to LTA 12 h before RSV infection increase early weight loss. a) Graphic showing experimental design. Mice were exposed to 50 μg LTA or PBS 12 h before RSV or mock (PBS) infection (day −0.5) and weighed up to day 8 after RSV infection. On day 1 after infection, lungs and BAL were collected for analysis by flow cytometry and qPCR. b) Weight loss represented as percentage of original body weight on day 0. c) Total number of neutrophils or d) inflammatory monocytes in the lung at day 1 after RSV infection. e) Viral load represented as L gene copy number/µg RNA measured by qPCR and normalised to Gapdh on day 1 after RSV infection. ND=not detectable. Expression of f)Il1a,g)Il1b in the lung measured by qPCR and normalised to Gapdh and h) TNF-α in the BAL fluid measured by ELISA. On day 1 after infection data are pooled from two experiments, mean ± SEM, n = 10. Weight loss data are from one experiment, n = 5 and plotted as the mean ± SEM. For weight loss, a two-way ANOVA with multiple comparisons test was carried out to compare the LTA-RSV group with RSV only controls. For all other data, a one-way ANOVA with multiple comparisons test was carried out to compare the LTA-RSV group with RSV only controls. Only statistically significant differences are shown. Asterisks represent the p value compared to RSV only controls; *≤0.05, **≤0.01, ***≤0.001, ****≤0.0001.
Fig. 4
Fig. 4
Neutrophil depletion in mice exposed to LPS before RSV infection does not alter weight loss. a) Graphic demonstrating neutrophil depletion protocol which was adapted from that published by Boivin et al (2020). Mice received a daily intra-peritoneal (i.p.) injection of 50 µg anti-Ly6G antibody (α-Ly6G) starting 2 days prior to RSV infection; i.p. injections of anti-rat kappa IgG (α-rat igG) on the indicated days, as well as intranasal α-Ly6G on the indicated days. Mice were intranasally exposed to LPS or PBS 12 h before RSV or mock (PBS) infection (day −0.5) and weighed up to day 4 after infection when lungs, BAL and blood were collected. b) Percentage of neutrophils (gated as intracellular Ly6G+ cells) from total CD45+ cells in the lungs of α-Ly6G treated mice compared to isotype controls. c) Daily weight of mice represented as percentage of original body weight on day 0 after infection in α-Ly6G treated mice exposed to LPS before RSV infection, compared to isotype treated mice. d) Viral load in the lungs represented as L gene copy number/µg RNA measured by qPCR and normalised to Gapdh. ND=not detectable. e) Total number of inflammatory monocytes in the lungs of α-Ly6G treated mice compared to isotype controls. Data are pooled from 2 experiments. PBS n = 6; Isotype LPS-RSV n = 8; α-Ly6G LPS-RSV n = 9. Weight loss is plotted as the mean ± SEM. For bar graphs, error bars represent SEM. For weight loss, a two-way ANOVA with multiple comparisons test was carried out to compare α-Ly6G LPS-RSV group with isotype LPS-RSV controls. For flow cytometry data and viral load data, a one-way ANOVA with multiple comparisons test was carried out to compare α-Ly6G LPS-RSV group with isotype LPS-RSV controls. Asterisks represent the p value compared to isotype controls; *≤0.05, **≤0.01, ***≤0.001, ****≤0.0001.
Fig. 5
Fig. 5
Monocyte depletion in mice exposed to LPS before RSV infection partially ameliorates weight loss. a) Graphic demonstrating monocyte depletion protocol. Mice received an i.p. injection of 20 µg anti-CCR2 (α-CCR2) or relevant isotype 6 h prior to intranasal LPS or PBS (day −0.5), then again on days 0 and 1. Mice were infected with RSV or mock (PBS) 12 h after LPS and weighed up to day 2 post infection. f) Total number of inflammatory monocytes in the lungs. g) Daily weight of mice represented as percentage of original body weight on day 0, in α-CCR2 treated mice compared to isotype controls. h) Viral load in the lungs represented as L gene copy number/μg RNA measured by qPCR and normalised to Gapdh. Expression of i)Il1a, j)Il1b andk)Tnfa in the lung, measured by qPCR and normalised to Gapdh. Data are pooled from 2 experiments. α-CCR2 n = 7; α-CCR2 isotype n = 7. Weight loss is plotted as the mean ± SEM. For bar graphs, error bars represent SEM. For weight loss, a two-way ANOVA with multiple comparisons test was carried out to compare α-CCR2 LPS-RSV group with isotype LPS-RSV controls. For flow cytometry, viral load and cytokine data, Student’s t-test was carried out to compare α-CCR2 LPS-RSV group with isotype LPS-RSV controls. Asterisks represent the p value compared to isotype controls; *≤0.05, **≤0.01, ***≤0.001, ****≤0.0001.
Fig. 6
Fig. 6
IL-1α, IL-1β and TNF-α were produced by multiple immune cells 12 h after LPS and/or RSV infection. Percentage contribution of lung resident AMs (blue), epithelial cells (red), and stromal + endothelial cells (pink) or recruited neutrophils (orange) and inflammatory monocytes (green) to total population of a) IL-1α+ cells, b) IL-1β+ cells or c) TNF-α+ cells, in the lung 12 h after intranasal LPS, RSV or LPS followed by RSV infection. Total number of a) IL-1α+, b) IL-1β+ or c) TNF-α+ AMs, epithelial cells, stromal + endothelial cells, neutrophils and inflammatory monocytes in the lung 12 h after intranasal LPS, RSV or LPS followed by RSV infection. Data are pooled from 2 experiments. PBS n = 6; LPS, RSV and LPS-RSV n = 8.
Fig. 7
Fig. 7
BlockingIL-1α and TNF-αameliorates exacerbated weight loss. a) Graphic demonstrating the cytokine depletion protocol. Mice received an i.p. injection of 250 µg anti-IL-1α (α-IL-1α), anti-IL-1β (α-IL-1β), anti-TNF-α (α-TNF-α), all three in combination (α-combo) or relevant isotype 6 h prior to intranasal LPS, then again daily. Mice were infected with RSV 12 h after LPS (day 0) and weighed up to day 2 post infection. b) Daily weight of mice represented as percentage of original body weight on day 0 after infection in α-IL-1α + α-IL-1β + α-TNF-α (α-Combo) or isotype control treated mice exposed to LPS before RSV infection. c) Daily weight of mice represented as percentage of original body weight on day 0 after infection in α-IL-1α, α-IL-1β, α-TNF-α or isotype control treated mice exposed to LPS before RSV infection. d) Viral load in the lungs of cytokine depleted mice compared to isotype controls, represented as L gene copy number/µg RNA measured by qPCR and normalised to Gapdh. Total number of e) neutrophils and f) inflammatory monocytes in the lungs. Data are pooled from 2 experiments. α-cytokine isotype LPS-RSV n = 6; α-Combo isotype LPS-RSV n = 4; α-IL-1α, α-IL-1β, α-TNF-α and α-Combo LPS-RSV n = 8. Weight loss is plotted as the mean ± SEM. For bar graphs, error bars represent SEM. For weight loss, a two-way ANOVA with multiple comparisons test was carried out to compare depletion groups with isotype LPS-RSV controls. For flow cytometry and qPCR data, a one-way ANOVA with multiple comparisons test was carried out to compare depletion with isotype LPS-RSV controls. Asterisks represent the p value compared to isotype controls; *≤0.05, **≤0.01, ***≤0.001, ****≤0.0001.

References

    1. Estimates of the global, regional, and national morbidity, mortality, and aetiologies of lower respiratory infections in 195 countries, 1990–2016: a systematic analysis for the Global Burden of Disease Study 2016. Lancet Infect Dis 2018;18:1191–210. doi: 10.1016/S1473-3099(18)30310-4. - PMC - PubMed
    1. Pica N., Bouvier N.M. Environmental factors affecting the transmission of respiratory viruses. Curr Opin Virol. 2012;2:90–95. doi: 10.1016/j.coviro.2011.12.003. - DOI - PMC - PubMed
    1. Pavia A.T. Viral infections of the lower respiratory tract: old viruses, new viruses, and the role of diagnosis. Clin Infect Dis Off Publ Infect Dis Soc Am. 2011;52:S284–S289. doi: 10.1093/cid/cir043. - DOI - PMC - PubMed
    1. Kusel M.M.H., de Klerk N.H., Holt P.G., Kebadze T., Johnston S.L., Sly P.D. Role of respiratory viruses in acute upper and lower respiratory tract illness in the first year of life: a birth cohort study. Pediatr Infect Dis J. 2006;25:680. doi: 10.1097/01.inf.0000226912.88900.a3. - DOI - PubMed
    1. Coultas J.A., Smyth R., Openshaw P.J. Respiratory syncytial virus (RSV): a scourge from infancy to old age. Thorax. 2019;74:986–993. doi: 10.1136/thoraxjnl-2018-212212. - DOI - PubMed

MeSH terms

LinkOut - more resources