. 2024 Aug 10;24(1):299.
doi: 10.1186/s12866-024-03454-7.

The Velvet transcription factor PnVeA regulates necrotrophic effectors and secondary metabolism in the wheat pathogen Parastagonospora nodorum

Affiliations

The Velvet transcription factor PnVeA regulates necrotrophic effectors and secondary metabolism in the wheat pathogen Parastagonospora nodorum

Shota Morikawa et al. BMC Microbiol. .

Abstract

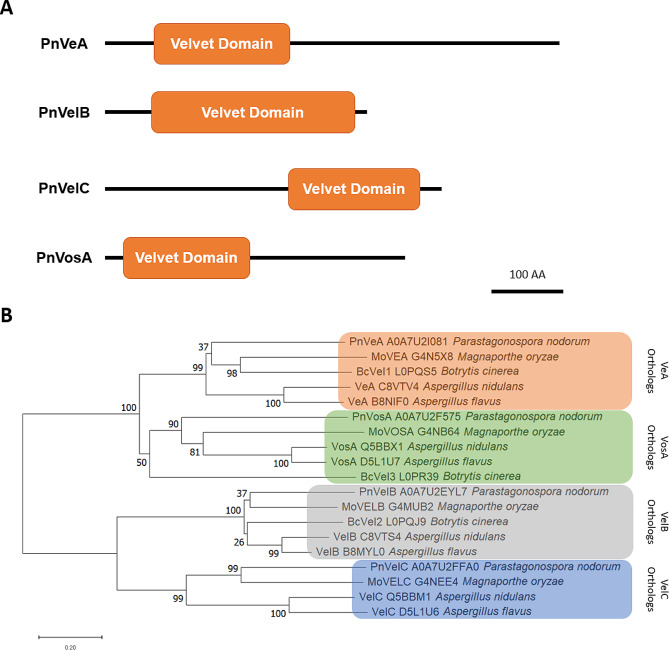
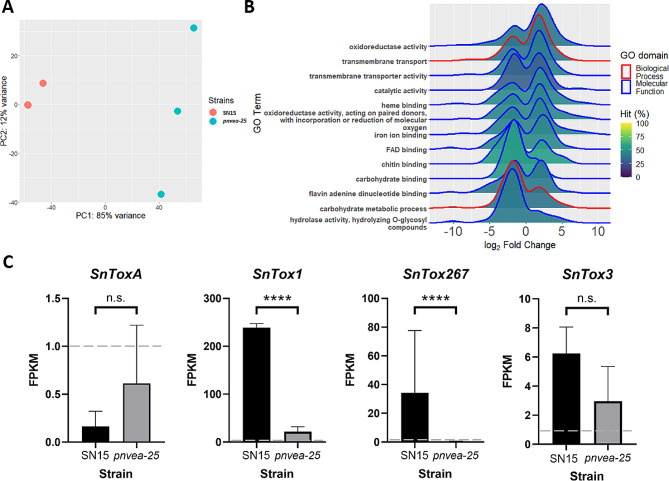
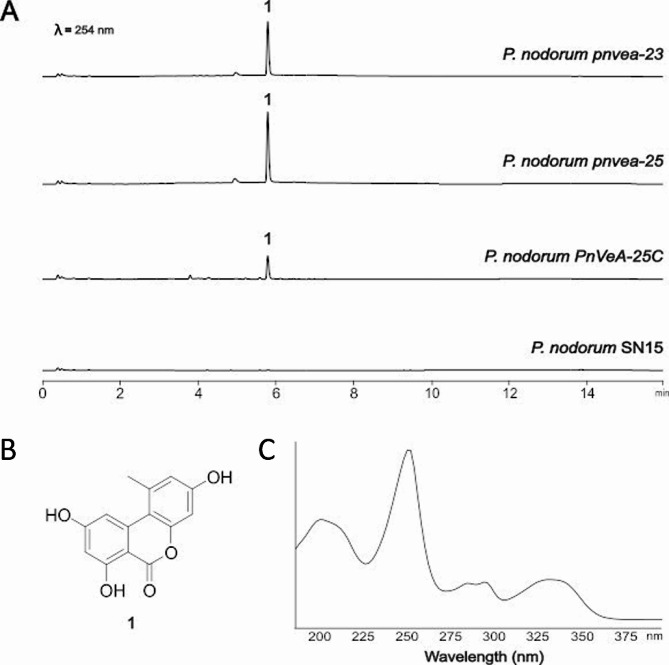
The fungus Parastagonospora nodorum causes septoria nodorum blotch on wheat. The role of the fungal Velvet-family transcription factor VeA in P. nodorum development and virulence was investigated here. Deletion of the P. nodorum VeA ortholog, PnVeA, resulted in growth abnormalities including pigmentation, abolished asexual sporulation and highly reduced virulence on wheat. Comparative RNA-Seq and RT-PCR analyses revealed that the deletion of PnVeA also decoupled the expression of major necrotrophic effector genes. In addition, the deletion of PnVeA resulted in an up-regulation of four predicted secondary metabolite (SM) gene clusters. Using liquid-chromatography mass-spectrometry, it was observed that one of the SM gene clusters led to an accumulation of the mycotoxin alternariol. PnVeA is essential for asexual sporulation, full virulence, secondary metabolism and necrotrophic effector regulation.

Keywords: Parastagonospora nodorum; Necrotrophic effector; Secondary metabolite; Velvet A; Wheat.


Conflict of interest statement

The authors declare no competing interests.

Figures

Fig. 1
Fig. 1
Protein sequence analysis of Velvet transcription factors. (A) Domain architecture of putative Velvet-domain (IPR037525) proteins in Parastagonospora nodorum showing the location of the Velvet domain in each ortholog. (B) A neighbour-joining phylogenetic tree showing characterised Velvet-domain transcription factors from four different species compared to putative orthologues in P. nodorum. Orange, green, grey, and blue boxes indicate the clustered VeA, VosA, VelB and VelC orthologs respectively. UniProt IDs are indicated right of protein names. Branch lengths denote the dissimilarities in amino acid sequences between proteins. Bootstrap values are indicated at node branches
Fig. 2
Fig. 2
Comparative examination of vegetative morphology and virulence of P. nodorum pnvea mutants with SN15. (A) Vegetative morphology of P. nodorum strains on V8PDA (top row) highlighting differences in pycnidial development (orange arrows) (bottom row). (B) Pycnidiospore count of P. nodorum strains on V8PDA media after 12 days of growth showing the abolishment of pycnidiospore production in pnvea-23 and pnvea-25. (C) Wheat leaf assay infection at day 6 post-inoculation showing reduced virulence of knockout mutants on wheat cultivar Axe. Tween was used as a negative control. (D) Pycnidiospore count of P. nodorum strains normalized to the length of infected leaf tissue after 10 days, showing the abolishment of pycnidiospore production in pnvea-23 and pnvea-25. For (B) and (D), ANOVA with the Tukey-Kramer test was used to compare the means of pycnidiospore counts (p ≤ 0.05, n = 3). Different letters above the bars indicate statistical significance between strains. Strains without detectable pycnidiospores are indicated by “n.d.” for “not detected”
Fig. 3
Fig. 3
Comparative RNA-Seq analysis between SN15 and pnvea-25 under in vitro condition. (A) Principal component analysis (PCA) of transcriptomes of SN15 and pnvea25. Three biological replicates were used. Two SN15 biological replicates overlapped on the plot resulting in only two visual data points. (B) A ridge plot illustrating the enriched gene ontology (GO) terms between SN15 and pnvea-25 plotted against the LFC of genes within the GO terms. The shading represents the percentage of genes in the GO term that was enriched. (C) The expression profile of necrotrophic effectors SnToxA, SnTox1, SnTox267 and SnTox3 in the RNA-Seq analysis. Horizontal dashed grey lines at one fragment per kilobase of transcript per million mapped reads (FPKM) indicate the lowest threshold at which a gene is considered expressed. Asterisks indicate significant difference while n.s. is not significant according to Wald test with the Benjamini-Hoschberg adjustment, p < 0.0001 (****)
Fig. 4
Fig. 4
Digital droplet PCR of necrotrophic effector genes revealed that PnVeA coordinates SnTox1, SnTox3 and SnTox267 expression in-planta. The in-planta gene expression profiles of effector genes, (A) SnToxA, (B) SnTox1, (C) SnTox267 and (D) SnTox3, for the wildtype strain (SN15), PnVeA deleted mutant (pnvea-25) and complemented mutant (PnVeA-25C) were measured at three-, six-, eight- and 10-days post-infection. Asterisks indicate a significant difference in mean within a time point between strains according to a one-way ANOVA with the Tukey-Kramer test post-hoc (p ≤ 0.05, n = 3), p < 0.05 (*), < 0.01 (**), < 0.001 (***) and < 0.0001 (****)
Fig. 5
Fig. 5
Differential gene expression of predicted SM gene clusters in P. nodorum [28]. In vitro RNA-Seq analysis compared the expression between wildtype SN15 and PnVeA deleted strain (pnvea-25). Log2 fold change (LFC) is coloured according to its significance: green is significantly up-regulated in pnvea-25, red is significantly down-regulated in pnvea-25 and grey is not significant. SNOG is the gene locus names. “PKS” are polyketide synthase genes, “TF” are transcription factors, “Other” are genes of various miscellaneous functions and “Previously not annotated” are genes within a cluster but only present in the genome by Bertazzoni et al. [48]
Fig. 6
Fig. 6
The deletion of PnVeA resulted in a modified metabolic profile. (A) LC-DAD (DAD 254 nm) chromatograms showing the metabolomic profiles of P. nodorum SN15, pnvea-23, pnvea-25 and PnVeA-25C strains grown on V8PDA. Deletion of PnVeA led to increased production of 1 (alternariol), the structure of which is depicted in (B). (C) Alternariol UV-vis spectrum

Similar articles

References

    1. Savary S, Willocquet L, Pethybridge SJ, Esker P, McRoberts N, Nelson A. The global burden of pathogens and pests on major food crops. Nat Ecol Evol. 2019;3(3):430–9. 10.1038/s41559-018-0793-y - DOI - PubMed
    1. Quaedvlieg W, Verkley GJM, Shin HD, Barreto RW, Alfenas AC, Swart WJ, et al. Sizing up Septoria. Stud Mycol. 2013;75(1):307–90. 10.3114/sim0017 - DOI - PMC - PubMed
    1. Solomon PS, Lowe RGT, Tan K-C, Waters ODC, Oliver RP. Stagonospora nodorum: cause of stagonospora nodorum blotch of wheat. Mol Plant Pathol. 2006;7(3):147–56. 10.1111/j.1364-3703.2006.00326.x - DOI - PubMed
    1. Downie RC, Lin M, Corsi B, Ficke A, Lillemo M, Oliver RP, et al. Septoria nodorum blotch of wheat: disease management and resistance breeding in the face of shifting disease dynamics and a changing environment. Phytopathology®. 2020;111(6):906–20.10.1094/PHYTO-07-20-0280-RVW - DOI - PubMed
    1. Oliver RP, Friesen TL, Faris JD, Solomon PS. Stagonospora nodorum: from pathology to genomics and host resistance. Annu Rev Phytopathol. 2012;50:23–43. 10.1146/annurev-phyto-081211-173019 - DOI - PubMed

MeSH terms

Supplementary concepts

LinkOut - more resources