. 2024 Aug 10;10(1):85.
doi: 10.1038/s41540-024-00410-z.

High-affinity biomolecular interactions are modulated by low-affinity binders

Affiliations

High-affinity biomolecular interactions are modulated by low-affinity binders

S Mukundan et al. NPJ Syst Biol Appl. .

Abstract

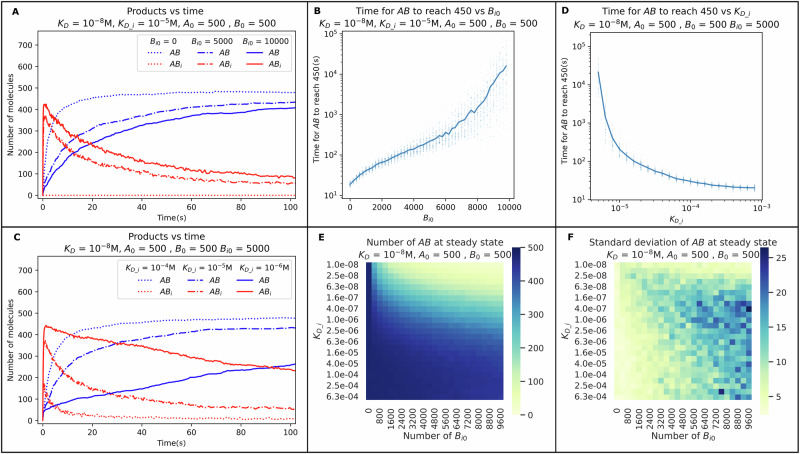
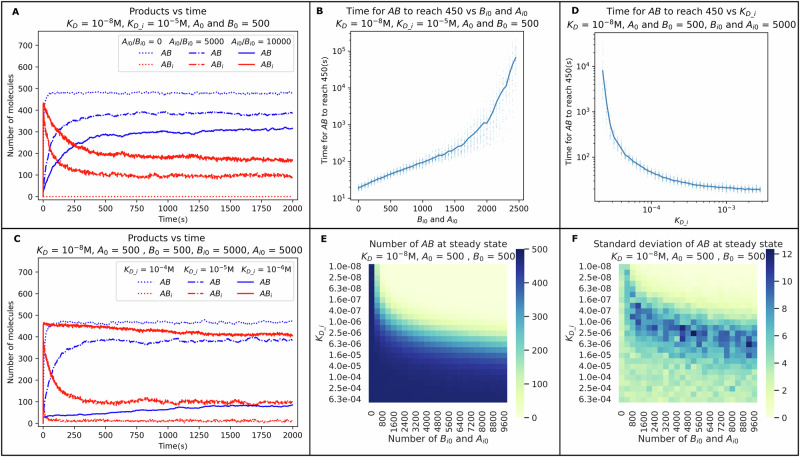
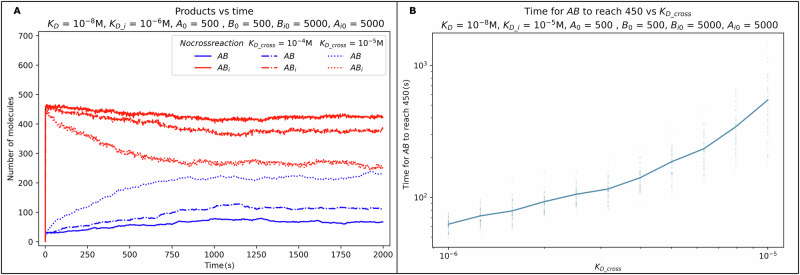
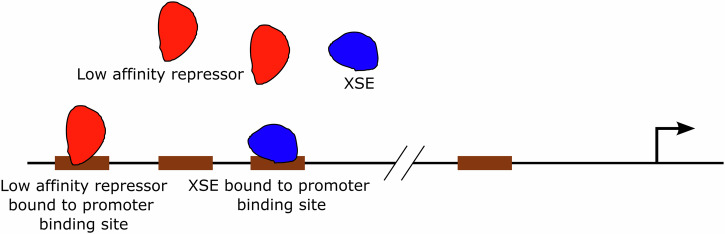
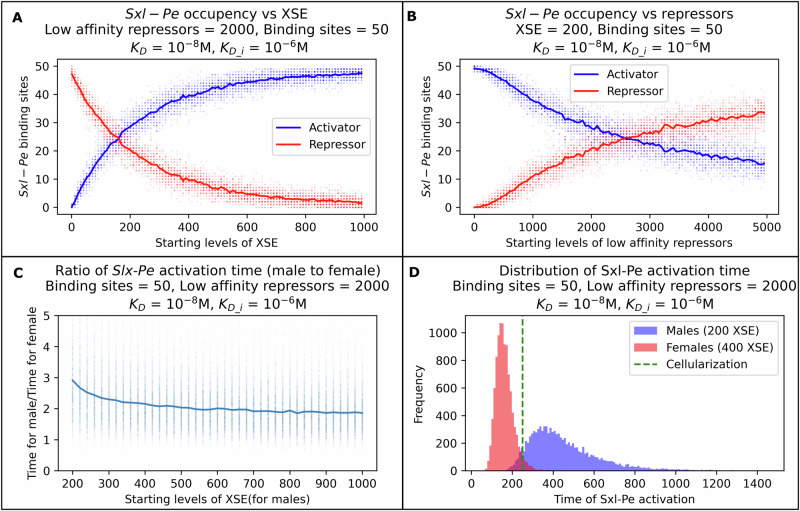
The strength of molecular interactions is characterized by their dissociation constants (KD). Only high-affinity interactions (KD ≤ 10-8 M) are extensively investigated and support binary on/off switches. However, such analyses have discounted the presence of low-affinity binders (KD > 10-5 M) in the cellular environment. We assess the potential influence of low-affinity binders on high-affinity interactions. By employing Gillespie stochastic simulations and continuous methods, we demonstrate that the presence of low-affinity binders can alter the kinetics and the steady state of high-affinity interactions. We refer to this effect as 'herd regulation' and have evaluated its possible impact in two different contexts including sex determination in Drosophila melanogaster and in signalling systems that employ molecular thresholds. We have also suggested experiments to validate herd regulation in vitro. We speculate that low-affinity binders are prevalent in biological contexts where the outcomes depend on molecular thresholds impacting homoeostatic regulation.


Conflict of interest statement

The authors declare no competing interests.

Figures

Fig. 1
Fig. 1. The dependence of complex formation on the starting levels and dissociation constants of the low-affinity binder Bi.
The kinetics of AB (blue lines) and ABi (red lines) formation at different Bi0 and KD_i (panels A and C, respectively). The effect of Bi0 and KD_i on the number of AB at steady state (average of 25 replicates per box in panel E) with the standard deviations in panel C. The time taken for AB to reach 450 molecules (90% of the maximum possible value of 500) at different Bi0 and KD_i levels (panels B and D, respectively). Panels A and C show single trajectories taken from triplicate simulations. The lines in panels B and D are averages over 50 replicates with individual data points shown as scatter plots. The parameters used are shown in the figures.
Fig. 2
Fig. 2. The dependence of complex formation on the starting number and dissociation constant of low-affinity binders Bi and Ai.
The kinetics of AB (blue lines) and ABi (red lines) formation at different starting levels and dissociation constants of Bi and Ai (panels A and C, respectively). The effect of different starting levels and dissociation constants of Bi and Ai on the AB levels at steady state (average of 25 replicates per box in panel E and the standard deviations in panel F). The time taken for AB to reach 450 (90% of the maximum possible value of 500, black dotted line in panels A and C) at different starting levels and dissociation constants of Bi and Ai (panels B and D respectively). Panels A and C represent single trajectories taken from triplicate simulations. The lines in panels B and D are averages over 50 replicates. The parameters used are shown in the figures.
Fig. 3
Fig. 3. The effect of cross-reaction between low-affinity inhibitors on herd regulation using Gillespie stochastic simulations.
The kinetics of AB (blue) and ABi (Red) complexes at cross-reaction dissociation constants (KD_cross) 10−4 and 10−5 M (panel A). Panel B shows the effect of KD_cross on the time taken for AB to reach 450 (90% of the maximum possible value of 500, black dotted line in panel A. One of 3 replicates is plotted in panel A. The plot in Panel B shows averages of 50 replicates (shown as a scatter). Starting values of A, B = 500, KD = 10−8 M and KD_i = 10−6 M. Parameters are shown above the figures.
Fig. 4
Fig. 4. Components of our model of Sxl-Pe regulation.
The blue objects represent XSEs, while the red objects represent the low-affinity repressors. The brown boxes represent protein binding sites on Sxl-Pe. The arrow depicts the transcription start site.
Fig. 5
Fig. 5. Model of sex determination with one set of low-affinity binders.
The amount of activating and repressing complexes formed when time = 100 units, at different starting values of XSEs and repressors (panels A and B, respectively). The ratio of time taken by males vs. females to activate Sxl-Pe (XSEs occupy 90% of all available Sxl-Pe binding sites) (panel C). Panel D shows the distribution of time taken for male and female cells to activate across a population of 10,000 cells. The simulations were replicated 50 times for each data point in panels A and B (individual data points shown as scatter of the same colour), and 10,000 for panel C.
Fig. 6
Fig. 6. Modelling signalling thresholds in biological systems.
All traces (averages of 50 replicates, individual data points shown as scatter) show the relationship between the active receptor and the number of signal molecules and low-affinity complexes at different starting levels of the signal. Panel A shows this relation at three different starting receptor levels. Panel B shows this relation at different starting levels of the low-affinity receptor. Plots are averages of 50 replicates and the scatter of the same colours shows the individual data points.
Fig. 7
Fig. 7. Schematic of the experiment to validate the effect of herd regulation.
DNA strands are coloured blue, red, black, and green for A, B, Ai and Bi. red and black squares and circles represent different restriction sites and corresponding restriction enzymes. Different steps of the reaction are shown on the left-hand side.

References

    1. Kanehisa, M., Furumichi, M., Sato, Y., Kawashima, M. & Ishiguro-Watanabe, M. KEGG for taxonomy-based analysis of pathways and genomes. Nucleic Acids Res. gkac963 (2022) 10.1093/nar/gkac963. - PMC - PubMed
    1. Huh, W.-K. et al. Global analysis of protein localization in budding yeast. Nature425, 686–691 (2003). 10.1038/nature02026 - DOI - PubMed
    1. Hu, W.-S. Kinetics of biochemical reactions. In Engineering Principles in Biotechnology (ed. Hu, W.-S.) 95–144 (Wiley, 2017).
    1. Perkins, J. R., Diboun, I., Dessailly, B. H., Lees, J. G. & Orengo, C. Transient protein–protein interactions: structural, functional, and network properties. Structure18, 1233–1243 (2010). 10.1016/j.str.2010.08.007 - DOI - PubMed
    1. Galaway, F. & Wright, G. J. Rapid and sensitive large-scale screening of low affinity extracellular receptor protein interactions by using reaction induced inhibition of Gaussia luciferase. Sci. Rep.10, 10522 (2020). 10.1038/s41598-020-67468-7 - DOI - PMC - PubMed

LinkOut - more resources