. 2024 Aug 10;12(1):127.
doi: 10.1186/s40478-024-01838-4.

Recurrent adamantinomatous craniopharyngiomas show MAPK pathway activation, clonal evolution and rare TP53-loss-mediated malignant progression

Affiliations

Recurrent adamantinomatous craniopharyngiomas show MAPK pathway activation, clonal evolution and rare TP53-loss-mediated malignant progression

John R Apps et al. Acta Neuropathol Commun. .

Abstract

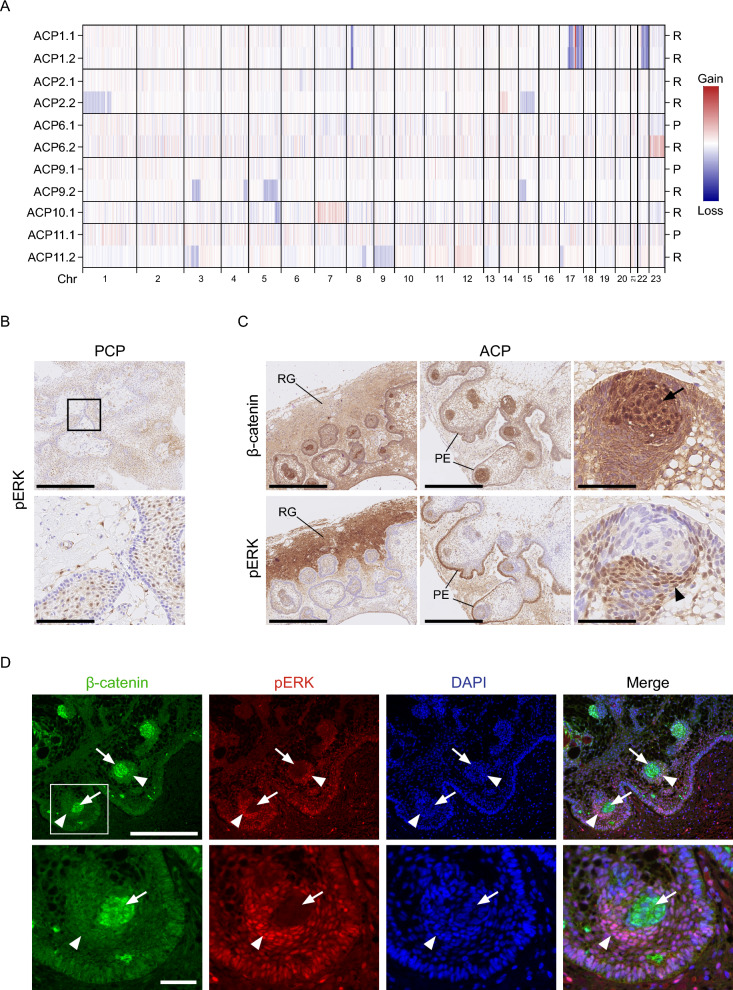
The two types of craniopharyngioma, adamantinomatous (ACP) and papillary (PCP), are clinically relevant tumours in children and adults. Although the biology of primary craniopharyngioma is starting to be unravelled, little is known about the biology of recurrence. To fill this gap in knowledge, we have analysed through methylation array, RNA sequencing and pERK1/2 immunohistochemistry a cohort of paired primary and recurrent samples (32 samples from 14 cases of ACP and 4 cases of PCP). We show the presence of copy number alterations and clonal evolution across recurrence in 6 cases of ACP, and analysis of additional whole genome sequencing data from the Children's Brain Tumour Network confirms chromosomal arm copy number changes in at least 7/67 ACP cases. The activation of the MAPK/ERK pathway, a feature previously shown in primary ACP, is observed in all but one recurrent cases of ACP. The only ACP without MAPK activation is an aggressive case of recurrent malignant human craniopharyngioma harbouring a CTNNB1 mutation and loss of TP53. Providing support for a functional role of this TP53 mutation, we show that Trp53 loss in a murine model of ACP results in aggressive tumours and reduced mouse survival. Finally, we characterise the tumour immune infiltrate showing differences in the cellular composition and spatial distribution between ACP and PCP. Together, these analyses have revealed novel insights into recurrent craniopharyngioma and provided preclinical evidence supporting the evaluation of MAPK pathway inhibitors and immunomodulatory approaches in clinical trials in against recurrent ACP.

Keywords: Craniopharyngioma; MAPK signalling pathway; MEK inhibitor; Macrophage/microglia.


Conflict of interest statement

Cassie Kline receives clinical trial support and drug supply from Bristol-Myers Squibb Co and Day One Biotherapeutics for the PNOC029 study (NCT05465174). In addition, she has other contracts relevant to other clinical trials not pertinent to this publication, specifically Curis Inc, Regeneron Pharmaceuticals, Midatech, Ipsen, Chimerix and Kazia.

Figures

Fig. 1
Fig. 1
Genomic evolution and MAPK pathway activation in craniopharyngioma. A Heatmap showing copy number changes identified in recurrent craniopharyngioma samples. Red indicates gain, blue indicates loss. P indicates primary tumour, R indicates recurrence. In 6 cases, copy number alterations were identified. Specifically,in two recurrence samples of case 1, and in cases 2, 6, 9, 10, 11, where changes were only identified in the most recent recurrences. ACP2.1, 9.1 and 11.1 are primary samples, all others are from tumour recurrences. Full details of each sample are in Additional Tables 1 and 2. B pERK1/2 immunohistochemistry of PCP showing activation restricted to a supra-basal layer. Scale bars: 500 µm for low power image; 100 µm for high power image (inset). C β-catenin (top row) and pERK1/2 (bottom row) immunohistochemistry in consecutive ACP sections showing pERK1/2 activation in reactive glia (RG, left column), palisading epithelia (PE, middle column) and pERK1/2-positive cells (arrowhead) surrounding a nuclear β-catenin accumulating cluster (arrow, right column) (3 different ACP cases are shown). Scale bars: 500 µm for left and middle columns; 50 µm for right column. D Double immunofluorescence staining confirming the close relation, but mutual exclusivity of pERK1/2-positive cells (arrowheads) with nucleo-cytoplasmic β-catenin accumulating clusters (arrows). Scale bars: 500 µm for first row; 100 µm for second row (inset)
Fig. 2
Fig. 2
Selumetinib and Binimetinib reduce proliferation and induce apoptosis in explants cultures of murine ACP. A Experimental design: Tumoural pituitaries from 18.5 dpc Hesx1Cre/+; Ctnnb1lox(ex3)/+ embryos were dissected and cultured in the presence of Selumetinib (50 nM; n = 3), Binimetinib (500 nM; n = 3) or vehicle (DMSO 0.1%; n = 3), and processed for histological analysis after 24 h. B Immunofluorescence staining against β-catenin (green) and pERK1/2 (red), and quantification of pERK1/2 positive area show the inhibition of MAPK pathway after treatment with Selumetinib (S) or Binimetinib (B) compared with the vehicle control cultures (V). Note the pERK1/2 staining around the β-catenin accumulating clusters (arrows). C Immunofluorescence staining against β-catenin (green) and Ki-67 (red), and quantification of Ki-67 index as a percentage of total DAPI positive nuclei, show the proliferation inhibition after treatment with Selumetinib (S) or Binimetinib (B) compared with the vehicle control cultures (V). Note the presence of proliferative cells near the β-catenin accumulating clusters (arrows). D Immunofluorescence staining against β-catenin (green) and cleaved Caspase-3 (CC3, red), and quantification of CC3 positive area, show the increase of apoptosis after treatment with Selumetinib (S) or Binimetinib (B) compared with the vehicle control cultures (V). Note the presence of apoptotic cells near β-catenin accumulating clusters and within tumour parenchyme (arrows). Main scale bar, 50 μm—Inset scale bar, 40 μm. P-values calculated with Kruskal–Wallis statistical test, followed by Dunn's multiple comparisons post-test
Fig. 3
Fig. 3
Altered distribution of β-catenin and paucity of pERK1/2 staining in a case of malignant craniopharyngioma with a heterozygous deletion of TP53. A Haematoxylin and eosin staining (left and middle images) and Ki67 immunohistochemistry (right image) at recurrence showing a poorly differentiated epithelial tumour with frequent mitoses. Scale bars: 500 μm for left image and 100 μm for middle and right images. B β-catenin, pERK1/2 and TP53 immunohistochemistry (left, middle and right columns, respectively) showing altered distribution between primary (upper panel) and recurrent tumours (lower panel). Second row of each primary and recurrent panels show high magnification images indicated by insets. At recurrence the tumour has widespread nuclear β-catenin staining, TP53 expression and loss of pERK1/2, C Copy number plot at recurrence showing multiple copy number changes, including deletion of TP53. Scale bars lower power 500 μm and higher power 100 μm
Fig. 4
Fig. 4
Deletion of Trp53 in an ACP murine model results in increased tumour growth and reduced mouse survival. A Kaplan–Meier survival curve for Hesx1Cre/+; Ctnnb1lox(ex3)/+; Trp53fl/fl; mice (red line), Hesx1Cre/+; Ctnnb1lox(ex3)/+; Trp53fl/+ (blue line) and Hesx1Cre/+; Trp53fl/fl mice (black line). Statistical comparison between Hesx1Cre/+; Ctnnb1lox(ex3)/+; Trp53fl/+ (n = 33) and Hesx1Cre/+; Trp53fl/fl (n = 25) survival curves was conducted by a log-rank Mantel-Cox test (P = 0.0219). The mean survival is significantly reduced in mice lacking both Trp53 alleles. B Representative images of tumours dissected at a humane endpoint showing the increased size found in the Hesx1Cre/+; Ctnnb1lox(ex3)/+; Trp53fl/fl; tumours. C Plot of mean tumour diameters showing a significant increase in Trp53-null (n = 10) versus Trp53-heterozygous (n = 8) genotypes (P = 0.0101, unpaired t test). Horizonal lines represent the mean and standard deviation. D Haematoxylin/eosin (H&E) staining of representative mouse ACP specimens. Hesx1Cre/+; Ctnnb1lox(ex3)/+; tumours (first column) are characterized by the presence of large cysts (top row) and a solid content formed by poorly differentiated non-epithelial cells. Hesx1Cre/+; Ctnnb1lox(ex3)/+; Trp53fl/+ tumours (middle column) display a similar histology. Hesx1Cre/+; Ctnnb1lox(ex3)/+; Trp53fl/fl; tumours (last column) show a distinct histologic phenotype characterized by a larger solid tumour content (top row) as well as higher number of mitotic bodies and necrotic regions (bottom row). E Molecular analysis by immunohistochemistry (IHC) and immunofluorescence (IF) of mouse ACP samples. Left column: IHC against TRP53 showing complete absence of P53 protein expression in Hesx1Cre/+; Ctnnb1lox(ex3)/+; Trp53fl/fl; tumours (bottom row) in contrast to Hesx1Cre/+; Ctnnb1lox(ex3)/+ and Hesx1Cre/+; Ctnnb1lox(ex3)/+; Trp53fl/+ tumours (top and middle rows respectively). Middle column: IF against KI67 shows increased cell proliferation in Hesx1Cre/+; Ctnnb1lox(ex3)/+; Trp53fl/fl; tumours. Right column: IF against pERK1/2shows regions rich in MAPK/ERK pathway activation in Hesx1Cre/+; Ctnnb1lox(ex3)/+ tumours. In contrast, Hesx1Cre/+; Ctnnb1lox(ex3)/+; Trp53fl/+ and Hesx1Cre/+; Ctnnb1lox(ex3)/+; Trp53fl/fl; tumours only showed scarce pERK1/2 positivity. F Plot of the proliferative index (percentage of KI67 + ve cells) in mouse tumour tissue sections, showing a significant increase in Hesx1Cre/+; Ctnnb1lox(ex3)/+; Trp53fl/fl (n = 3, shown in red) in comparison to Hesx1Cre/+; Ctnnb1lox(ex3)/+; Trp53fl/+ (n = 4, shown in blue) tumours (P = 0.0241, unpaired t test). Horizonal lines represent the mean and standard deviation. G Plot of the pERK1/2 positivity index in mouse tumour sections, showing that despite a trend in increased pERK1/2 + cells in Hesx1Cre/+; Ctnnb1lox(ex3)/+; Trp53fl/fl and Hesx1Cre/+; Ctnnb1lox(ex3)/+; Trp53fl/+ tumours, differences are not statistically significant (p = 0.2339, one-way ANOVA with Dunn’s multiple correction). Scale bars: b: 2.5 mm; d: 500 µm for top row and 100 µm for bottom row; e: 100 µm for left and middle columns, 200 µm for right column
Fig. 5
Fig. 5
Molecular profiling identifies differences in the inflammatory infiltrates between ACP and PCP. A Differential expression of cytokines and immune checkpoint proteins between ACP and PCP. Positive fold change indicates upregulated in ACP relative to PCP. B GSEA plot showing enrichment of Hallmark Inflammatory Response geneset in PCP (NES = Normalised enrichment score; FDR = False Discovery Rate). C Plots showing distribution of CD14-positive, monocyte and neutrophil infiltrates in methylation patterns from ACP and PCP, as assessed by methylcibersort. D, E Immune infiltrate across tumour and reactive tissue as assessed by immunohistochemistry against CD14 in PCP (D) and ACP E. pERK1/2 and β-catenin staining are also shown demonstrating CD14 + ve cells throughout the epithelia and reactive glia of PCP, but limited the reactive glia in ACP. Scale bar: 100 µm

References

    1. Muller HL (2020) The diagnosis and treatment of craniopharyngioma. Neuroendocrinology 110(9–10):753–766 10.1159/000504512 - DOI - PubMed
    1. Muller HL, Merchant TE, Warmuth-Metz M, Martinez-Barbera JP, Puget S (2019) Craniopharyngioma. Nat Rev Dis Primers 5(1):75 10.1038/s41572-019-0125-9 - DOI - PubMed
    1. Louis DN, Perry A, Wesseling P et al (2021) The 2021 WHO classification of tumors of the central nervous system: a summary. Neuro Oncol 23(8):1231–1251 10.1093/neuonc/noab106 - DOI - PMC - PubMed
    1. Apps JR, Muller HL, Hankinson TC, Yock TI, Martinez-Barbera JP (2023) Contemporary biological insights and clinical management of craniopharyngioma. Endocr Rev 44(3):518–538 10.1210/endrev/bnac035 - DOI - PubMed
    1. Goschzik T, Gessi M, Dreschmann V et al (2017) Genomic alterations of adamantinomatous and papillary craniopharyngioma. J Neuropathol Exp Neurol 76(2):126–134 - PubMed

Publication types

MeSH terms