Observational Study
. 2025 Feb;39(1):205-215.
doi: 10.1007/s10877-024-01204-8. Epub 2024 Aug 10.

Intraoperative zero-heat-flux thermometry overestimates nasopharyngeal temperature by 0.39 °C: an observational study in patients undergoing congenital heart surgery

Affiliations
Observational Study

Intraoperative zero-heat-flux thermometry overestimates nasopharyngeal temperature by 0.39 °C: an observational study in patients undergoing congenital heart surgery

Ivo F Brandes et al. J Clin Monit Comput. 2025 Feb.

Abstract

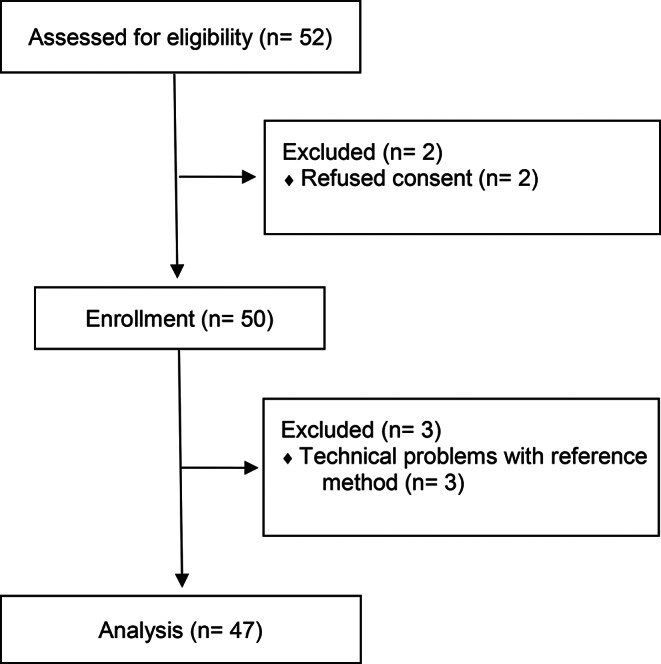
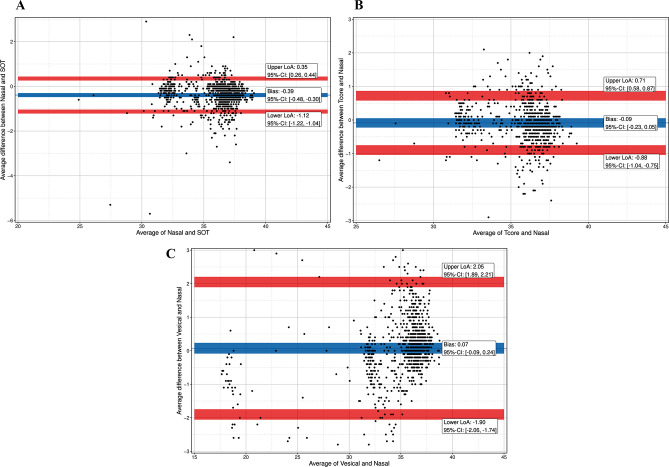
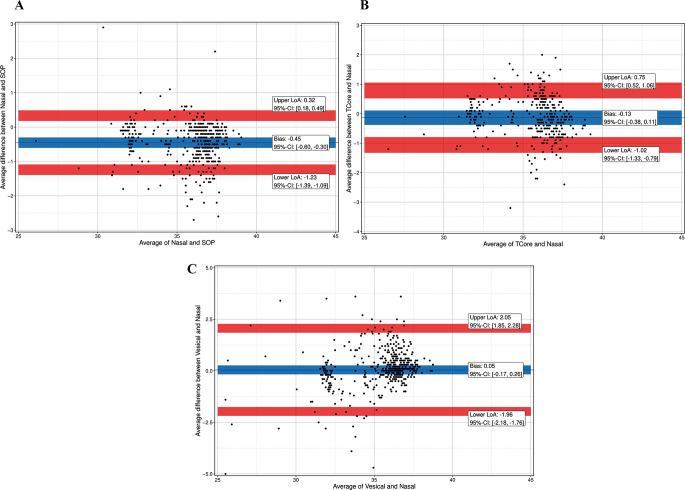
During surgery for congenital heart disease (CHD) temperature management is crucial. Vesical (Tves) and nasopharyngeal (TNPH) temperature are usually measured. Whereas Tves slowly responds to temperature changes, TNPH carries the risk of bleeding. The zero-heat-flux (ZHF) temperature monitoring systems SpotOn™ (TSpotOn), and Tcore™ (Tcore) measure temperature non-invasively. We evaluated accuracy and precision of the non-invasive devices, and of Tves compared to TNPH for estimating temperature. In this prospective observational study in pediatric and adult patients accuracy and precision of TSpotOn, Tcore, and Tves were analyzed using the Bland-Altman method. Proportion of differences (PoD) and Lin´s concordance correlation coefficient (LCC) were calculated. Data of 47 patients resulted in sets of matched measurements: 1073 for TSpotOn vs. TNPH, 874 for Tcore vs. TNPH, and 1102 for Tves vs. TNPH. Accuracy was - 0.39 °C for TSpotOn, -0.09 °C for Tcore, and 0.07 °C for Tves. Precisison was between - 1.12 and 0.35 °C for TSpotOn, -0.88 to 0.71 °C for Tcore, and - 1.90 to 2.05 °C for Tves. PoD ≤ 0.5 °C were 71% for TSpotOn, 71% for Tcore, and 60% for Tves. LCC was 0.9455 for TSpotOn, 0.9510 for Tcore, and 0.9322 for Tves. Temperatures below 25.2 °C (TSpotOn) or 27.1 (Tcore) could not be recorded non-invasively, but only with Tves. Trial registration German Clinical Trials Register, DRKS00010720.

Keywords: Congenital heart disease; Core temperature; Hypothermia; Non-invasive monitoring; Zero-heat-flux thermometer.


Conflict of interest statement

Declarations. Ethical approval: This prospective single-center observational study was conducted at the University Medical Centre Göttingen, Germany, after obtaining local ethics committee approval (No. 5/3/16), and registration on the German Clinical Trials Register (DRKS00010720). We followed STROBE guidelines for reporting of observational studies. Consent to participate: Each patient consented to participate at least 24 h prior to surgery. Consent could be withdrawn by every patient at any time without reason and without any disadvantage regarding treatment. Consent to publish: Each patient consented to publish their data prior to data acquisition. Consent could be withdrawn by every patient at any time without reason and without any disadvantage regarding treatment. Competing interests: Prof. Dr. A. Bräuer is a member of the advisory board of 3 M Europe and has received payments from 3 M Germany, 3 M Europe, 3 M Asia Pacific Pte Ltd. for consultancy work.All other authors do not have any competing interests.

Figures

Fig. 1
Fig. 1
Flowchart of enrollment of patients
Fig. 2
Fig. 2
(a) Temperatures measured with SpotOn™ (TSpotOn), Tcore™ (Tcore), vesical (Tves) and nasopharyngeal (TNPH) temperature probes in a 2-day-old patient. During cardiopulmonary bypass temperature was measured in the arterial branch of the oxygenator (TCPB). (b) Temperatures measured with SpotOn™ (TSpotOn), Tcore™ (Tcore), vesical (Tves) and nasopharyngeal (TNPH) temperature probes in a 15-year-old patient. During cardiopulmonary bypass temperature was measured in the arterial branch of the oxygenator (TCPB)
Fig. 3
Fig. 3
(a) Bland-Altman plot with multiple temperature measurements (47 patients with 1073 measurement pairs) of the SpotOnTM-Sensor (SOT) and a nasopharyngeal probe (Nasal). Blue line indicates mean bias with 95% confidence interval (CI): -0.39 °C (-0.48; -0.30); red lines indicate 95% limits of agreement (LoA) with 95% confidence interval (CI). LoA: ±0.74 °C, lower LoA: -1.12 °C (-1.22; -1.04), upper LoA: 0.35 °C (0.26; 0.44). (b) Bland-Altman plot with multiple temperature measurements (39 patients with 874 measurement pairs) of the TcoreTM-Sensor (Tcore) and a nasopharyngeal probe (TNPH). Blue line indicates mean bias with 95% confidence interval (CI): -0.09 °C (-0.23; 0.05); red lines indicate 95% limits of agreement (LoA) with 95% confidence interval (CI). LoA: ±0.80 °C, lower LoA: -0.88 °C (-1.04; -0.75), upper LoA: 0.71 °C (0.58; 0.87). (c) Bland-Altman plot with multiple temperature measurements (47 patients with 1102 measurement pairs) of a vesical (Tves) and a nasopharyngeal probe (TNPH). Blue line indicates mean bias with 95% confidence interval (CI): 0.07 °C (0.09; 0.24); red lines indicate 95% limits of agreement (LoA) with 95% confidence interval (CI). LoA: ±1.98 °C, lower LoA: -1.90 °C (-2.06; -1.74), upper LoA: 2.05 °C (1.89; 2.21)
Fig. 4
Fig. 4
(a) Bland-Altman plot with multiple temperature measurements of the SpotOnTM-Sensor (SOT) and a nasopharyngeal probe (Nasal). Blue line indicates mean bias with 95% confidence interval (CI): -0.45 °C (-0.60; -0.30); red lines indicate 95% limits of agreement (LoA) with 95% confidence interval (CI). LoA: ±0.78 °C, lower LoA: -1.23 °C (-1.39; -1.09), upper LoA: 0.32 °C (0.18; 0.49). (b) Bland-Altman plot with multiple temperature measurements of the TcoreTM-Sensor (Tcore) and a nasopharyngeal probe (TNPH). Blue line indicates mean bias with 95% confidence interval (CI): -0.13 °C (-0.38; 0.11); red lines indicate 95% limits of agreement (LoA) with 95% confidence interval (CI). LoA: ±0.89 °C, lower LoA: -1.02 °C (-1.33; -0.79), upper LoA: 0.75 °C (1.06; 0.52). (c) Bland-Altman plot with multiple temperature measurements of a vesical (Tves) and a nasopharyngeal probe (TNPH). Blue line indicates mean bias with 95% confidence interval (CI): 0.05 °C (-017; 0.26); red lines indicate 95% limits of agreement (LoA) with 95% confidence interval (CI). LoA: ±2.00 °C, lower LoA: -1.96 °C (-2.18; -1.76), upper LoA: 2.05 °C (1.85; 2.28)
Fig. 5
Fig. 5
(a) Bland-Altman plot with multiple temperature measurements of the SpotOnTM-Sensor (SOT) and a nasopharyngeal probe (Nasal). Blue line indicates mean bias with 95% confidence interval (CI): -0.34 °C (-0.44; -0.23); red lines indicate 95% limits of agreement (LoA) with 95% confidence interval (CI). LoA: ±0.70 °C, lower LoA: -1.03 °C (-1.15; -0.93), upper LoA: 0.36 °C (0.26; 0.47). (b) Bland-Altman plot with multiple temperature measurements of the TcoreTM-Sensor (Tcore) and a nasopharyngeal probe (TNPH). Blue line indicates mean bias with 95% confidence interval (CI): -0.05 °C (-0.21; 0.11); red lines indicate 95% limits of agreement (LoA) with 95% confidence interval (CI). LoA: ±0.73 °C, lower LoA: -0.77 °C (-0.95; -0.62), upper LoA: 0.68 °C (0.53; 0.86). (c) Bland-Altman plot with multiple temperature measurements of a vesical (Tves) and a nasopharyngeal probe (TNPH). Blue line indicates mean bias with 95% confidence interval (CI): 0.10 °C (-0.14; 0.34); red lines indicate 95% limits of agreement (LoA) with 95% confidence interval (CI). LoA: ±1.94 °C, lower LoA: -1.84 °C (-2.08; -1.61), upper LoA: 2.04 °C (1.82; 2.29)

References

    1. Lee LK, et al. A comparison of postoperative outcomes with PDA ligation in the OR versus the NICU: a retrospective cohort study on the risks of transport. BMC Anesthesiol. 2018;18(1):199. - PMC - PubMed
    1. Kurz A, Sessler DI, Lenhardt R. Perioperative normothermia to reduce the incidence of surgical-wound infection and shorten hospitalization. Study of wound infection and temperature group. N Engl J Med. 1996;334(19):1209–15. - PubMed
    1. Melling AC, et al. Effects of preoperative warming on the incidence of wound infection after clean surgery: a randomised controlled trial. Lancet. 2001;358(9285):876–80. - PubMed
    1. Schmied H, et al. Mild hypothermia increases blood loss and transfusion requirements during total hip arthroplasty. Lancet. 1996;347(8997):289–92. - PubMed
    1. Frank SM, et al. Perioperative maintenance of normothermia reduces the incidence of morbid cardiac events. A randomized clinical trial. JAMA. 1997;277(14):1127–34. - PubMed

Publication types

MeSH terms

LinkOut - more resources