

Species-level, metagenomic and proteomic analysis of microbe-immune interactions in severe asthma
- PMID: 39127908
- PMCID: PMC7617782
- DOI: 10.1111/all.16269
Species-level, metagenomic and proteomic analysis of microbe-immune interactions in severe asthma
Abstract
Background: The airway microbiome in severe asthma has not been characterised at species-level by metagenomic sequencing, nor have the relationships between specific species and mucosal immune responses in 'type-2 low', neutrophilic asthma been defined. We performed an integrated species-level metagenomic data with inflammatory mediators to characterise prevalence of dominant potentially pathogenic organisms and host immune responses.
Methods: Sputum and nasal lavage samples were analysed using long-read metagenomic sequencing with Nanopore and qPCR in two cross-sectional adult severe asthma cohorts, Wessex (n = 66) and Oxford (n = 30). We integrated species-level data with clinical parameters and 39 selected airway proteins measured by immunoassay and O-link.
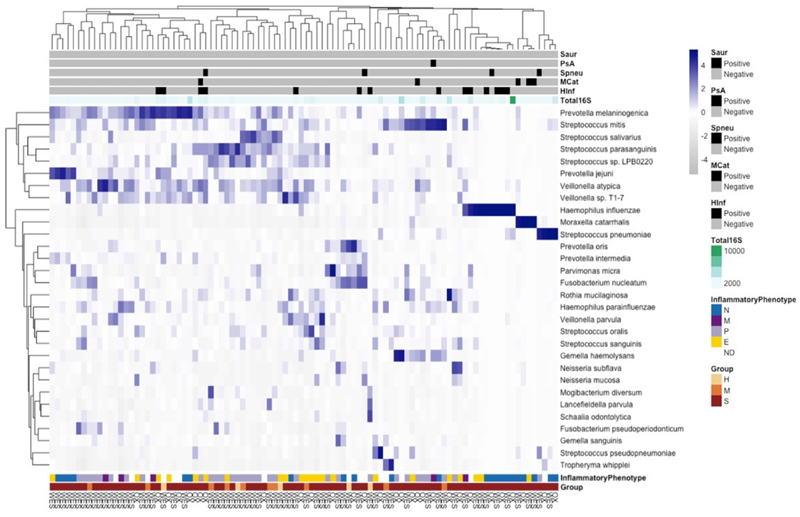
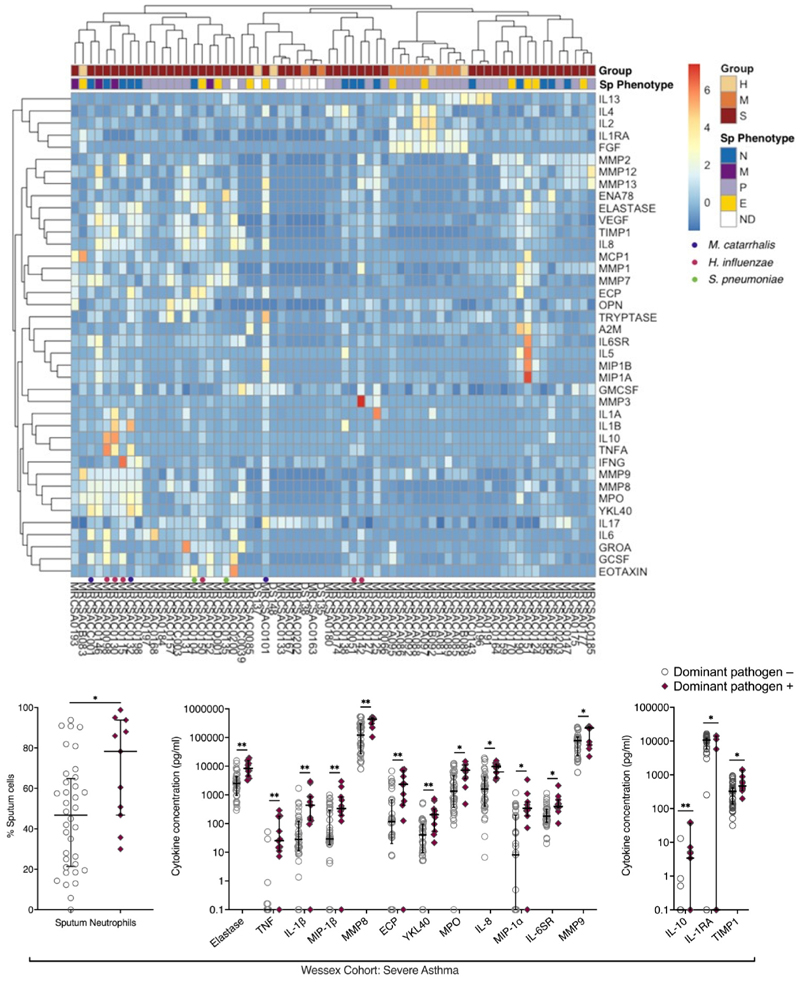
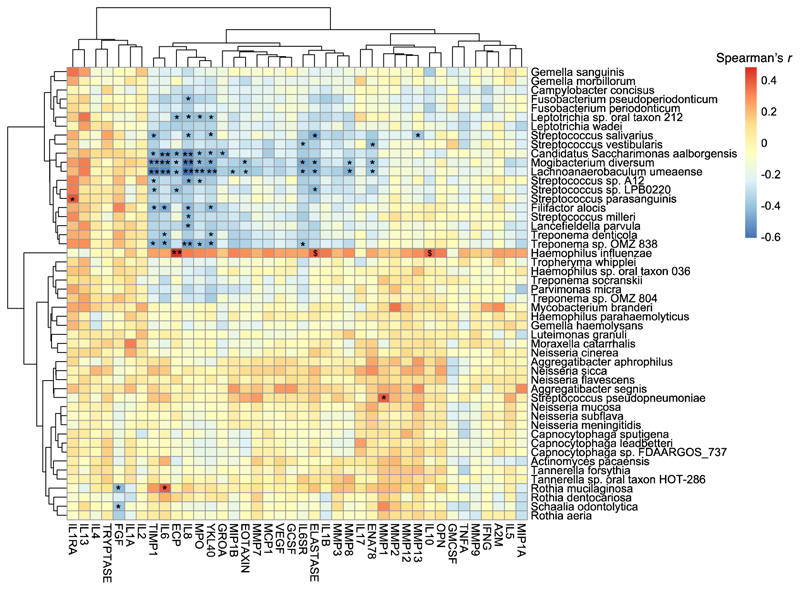
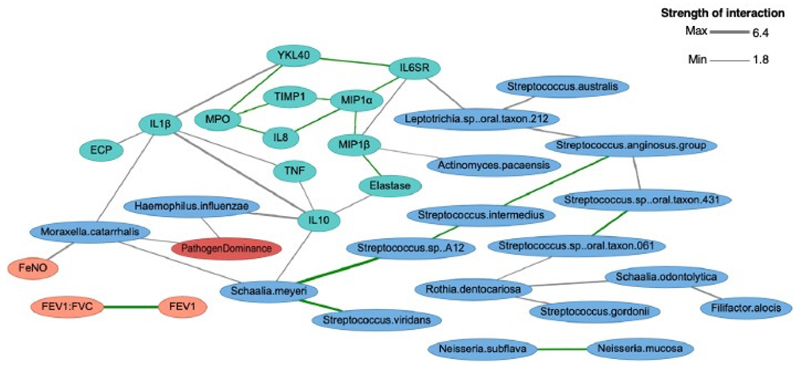
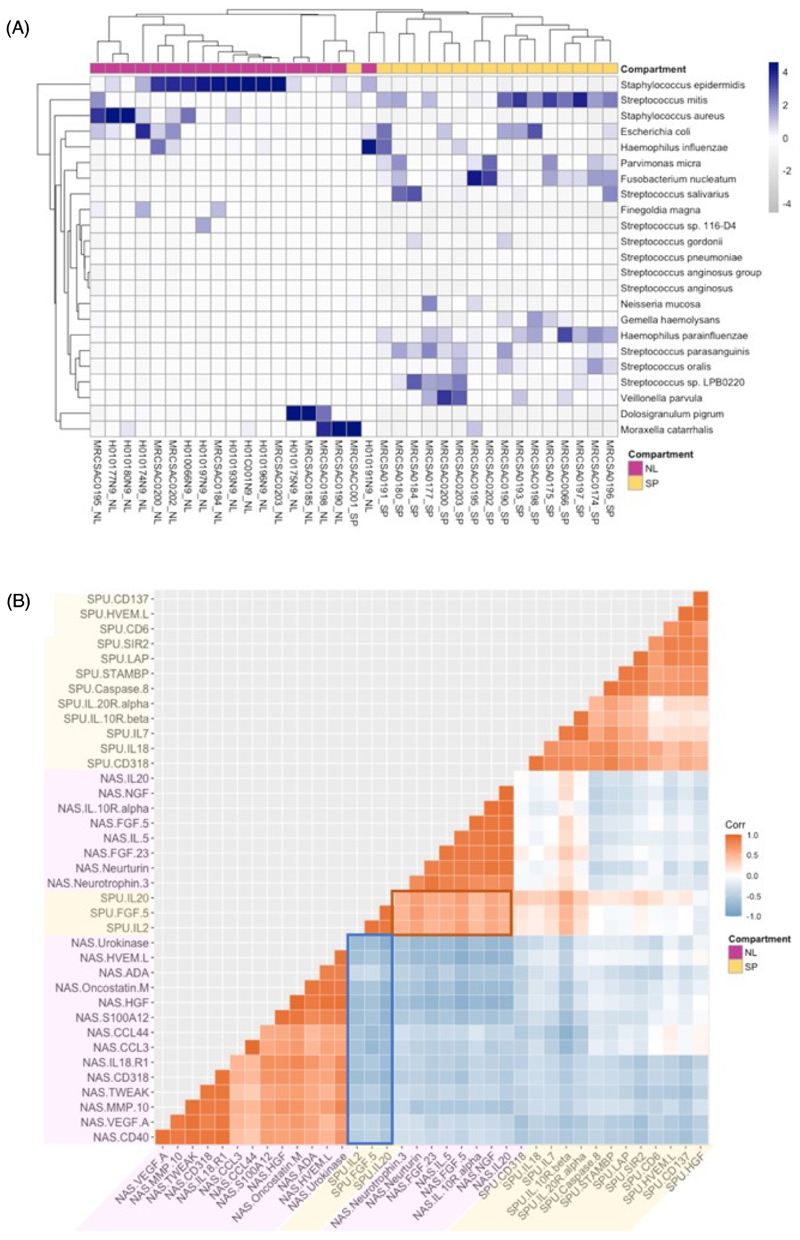
Results: The sputum microbiome in health and mild asthma displayed comparable microbial diversity. By contrast, 23% (19/81) of severe asthma microbiomes were dominated by a single respiratory pathogen, namely H. influenzae (n = 10), M. catarrhalis (n = 4), S. pneumoniae (n = 4) and P. aeruginosa (n = 1). Neutrophilic asthma was associated with H. influenzae, M. catarrhalis, S. pneumoniae and T. whipplei with elevated type-1 cytokines and proteases; eosinophilic asthma with higher M. catarrhalis, but lower H. influenzae, and S. pneumoniae abundance. H. influenzae load correlated with Eosinophil Cationic Protein, elastase and IL-10. R. mucilaginosa associated positively with IL-6 and negatively with FGF. Bayesian network analysis also revealed close and distinct relationships of H. influenzae and M. catarrhalis with type-1 airway inflammation. The microbiomes and cytokine milieu were distinct between upper and lower airways.
Conclusions: This species-level integrated analysis reveals central, but distinct associations between potentially pathogenic bacteria and airways inflammation in severe asthma.
Keywords: Asthma; bacteria; cytokine; microbiome; sputum.
© 2024 The Author(s). Allergy published by European Academy of Allergy and Clinical Immunology and John Wiley & Sons Ltd.
Conflict of interest statement
Maisha Farzana Jabeen received funding from UKRI and the National Institute for Health Research (NIHR) Oxford Biomedical Research Centre. Clair Barber, and Adnan Azim are employees of AstraZeneca, Ian D Pavord has received funding from Merck, from Chiesi and consultancy fees from AstraZeneca, Boehringer Ingelheim, Aerocrine, Almirall, Novartis, Teva, Chiesi, Sanofi/Regeneron, Menarini, GSK, Circassia, Knopp outside the submitted work. Anoop Chauhan has received funding from Airsonett and consultancy fees from Sanofi Genzyme, Novartis, XIM, Glyconics and Exhalation Technology. Mariaenrica Tinè, Gillian Donachie, Laurie CK Lau, Thomas Brown and Paul Klenerman declare they have no conflict of interest. Nicholas D Sanderson and Teresa L Street received funding from the National Institute for Health Research (NIHR) Oxford Biomedical Research Centre. Emanuele Marchi has received funding from Asthma+Lung UK. Peter H Howarth is an employee of GSK. Timothy SC Hinks reports grants from The Wellcome Trust, grants from The Guardians of the Beit Fellowship, grants from Pfizer, grants from NIHR Oxford BRC, grants from University of Oxford, grants from Kymab, grants from Arcturis, grants from Asthma+Lung UK, during the conduct of the study; personal fees from Astra Zeneca, personal fees from TEVA, personal fees from Peer Voice, personal fees from AZ Pieris, outside the submitted work.
Figures
References
-
- Pavord ID, et al. After asthma: redefining airways diseases. Lancet. 2018;391:350–400. - PubMed
-
- Simpson JL, Scott R, Boyle MJ, Gibson PG. Inflammatory subtypes in asthma: assessment and identification using induced sputum. Respirology. 2006;11:54–61. - PubMed
-
- Abdel-Aziz MI, et al. Sputum microbiome profiles identify severe asthma phenotypes of relative stability at 12 to 18 months. J Allergy Clin Immunol. 2021;147:123–134. - PubMed
MeSH terms
Substances
Grants and funding
LinkOut - more resources
Full Text Sources
Medical
