. 2024 Aug 21;146(33):23289-23296.
doi: 10.1021/jacs.4c05871. Epub 2024 Aug 11.

Repurposing a Catalytic Cycle for Transient Self-Assembly

Affiliations

Repurposing a Catalytic Cycle for Transient Self-Assembly

Shuntaro Amano et al. J Am Chem Soc. .

Abstract

Life operates out of equilibrium to enable various sophisticated behaviors. Synthetic chemists have strived to mimic biological nonequilibrium systems in such fields as autonomous molecular machines and dissipative self-assembly. Central to these efforts has been the development of new chemical reaction cycles, which drive systems out of equilibrium by conversion of chemical fuel into waste species. However, the construction of reaction cycles has been challenging due to the difficulty of finding compatible reactions that constitute a cycle. Here, we realize an alternative approach by repurposing a known catalytic cycle as a chemical reaction cycle for driving dissipative self-assembly. This approach can overcome the compatibility problem because all steps involved in a catalytic cycle are already known to proceed concurrently under the same conditions. Our repurposing approach is applicable to diverse combinations of catalytic cycles and systems to drive out of equilibrium, which will substantially broaden the scope of out-of-equilibrium systems.


Conflict of interest statement

The authors declare no competing financial interest.

Figures

Figure 1
Figure 1
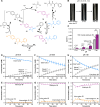
Repurposing an aldehyde-catalyzed ester hydrolysis reaction to induce transient self-assembly. (A) Top: common approach for constructing a chemical reaction cycle, which is to find multiple reactions that proceed under the same conditions and combine them. Bottom: our approach of repurposing a catalytic cycle as a chemical reaction cycle, which is based on the equivalence of these two cycles. A fuel molecule (substrate) reacts with a system’s component in state 1 (catalyst), converting it into another state (state 2/catalyst′). The new state undergoes another transformation and returns to the initial state while releasing a waste molecule (product). (B) Reaction cycle of an aldehyde-catalyzed ester hydrolysis. Free catalyst aldehyde 1 and imine ester 4 have different propensity to self-assemble. While chemical fuel 2 is present, the assembly of imine ester 4 is formed transiently. Dimerization of ester fuel 2 also occurs but is omitted for clarity.
Figure 2
Figure 2
Fuel addition experiments to aldehyde 1 solution. (A) Reaction mixture at pH = 7.90 before adding ester fuel 2 and 3 and 140 min after the fuel addition. Transient formation of visible assemblies of imine ester 4 was observed. (B) Observed pseudo-first-order rate constants for fuel consumption with and without aldehyde 1 (kcat and kuncat, respectively) at different pH values. The numbers on each set of bar graphs are the magnitude of acceleration, kcat/kuncat. Error bars represent standard errors obtained from duplicate experiments. ns = (not significant), * and ** mean that the P value of statistical testing is ≥0.05, 0.01 to 0.05, and 0.001 to 0.01, respectively. See Section S7 for details. (C–F) Concentration changes of catalyst-containing species over time. Error bars represent standard errors obtained from duplicate experiments (panel C,D) or four replicates (panel E,F). “Imine ester assemblies” signify the visible aster-like assemblies of imine ester 4. Reaction conditions: aldehyde 1 (6 mM); ester fuel 2 (48 mM, 8 equiv); MES or HEPES buffer (200 mM) at pH = 6.10, 6.55, 7.00 or 7.90; D2O; and 293 K.
Figure 3
Figure 3
Optical microscopy images of imine ester assemblies 4 at designated time points at (A) pH = 7.00 and (B) 7.90. Emergence and disappearance of aster-like structures could be observed. The assembly size at pH = 7.90 was smaller than at pH = 7.00, due to faster formation of imine ester 4 and more frequent nucleation events. The last images at each pH show trace amount of deposits formed on the cover glass during the reaction. Reaction conditions: aldehyde 1 (6 mM), ester fuel 2 (48 mM, 8 equiv), MES or HEPES buffer (200 mM), D2O, and room temperature.
Figure 4
Figure 4
Investigation of the reaction mechanism of ester fuel hydrolysis catalyzed by aldehyde 1. (A) Reaction scheme of ester fuel hydrolysis experiments in the presence of alcohol 9, which has a similar structure to aldehyde 1 but lacks a formyl group. (B) Observed pseudo-first-order rate constants for fuel consumption with and without alcohol 9 (kcat and kuncat, respectively) at different pH values. Error bars represent standard errors obtained from duplicate experiments. ns (not significant) means that the P value of statistical testing is ≥0.05. See Section S7 for details. (C) Rate of catalyzed processes at different concentrations of aldehyde catalyst 1. Reaction conditions: aldehyde 1 (0.06, 0.2, 0.6, 2, 6, or 10 mM), ester fuel 2 (48 mM), MES buffer (200 mM) at pH = 6.10, D2O, and 293 K. The black markers depict the rates of catalyzed processes measured in the 1H NMR experiments, with the error bars that show standard errors obtained from duplicate experiments. The red line is the result of nonlinear fitting to the equation at the top-left corner, where “a” and “b” are the fitted parameters. The inset is a magnification of the low-concentration region. (D) DLS measurements of aldehyde 1 (0.2, 0.6, 2, 6, and 10 mM) solution at pH = 6.10. The DLS measurement of aldehyde 1 solution at 0.06 mM did not yield any reliable signal.
Figure 5
Figure 5
Construction of a kinetic model based on experiments with model aldehyde 10. (A) Reaction cycle of ester fuel hydrolysis catalyzed by model aldehyde 10. k2 and k4k10 are rate constants for reactions. k1 and k3 are the rate constants for the background fuel hydrolysis reaction and the hydrolysis of fuel dimer 15, respectively. They are omitted for clarity in the figure. (B) Reaction mixture with model aldehyde 10 at pH = 7.00 before adding ester fuel 2, at 3 and 140 min after the fuel addition. No visible assemblies were observed. Similar results were observed at pH = 6.10 and pH = 6.55, whereas transient formation of visible assemblies was observed at pH = 7.90. (C) Observed pseudo-first-order rate constants for fuel consumption with and without model aldehyde 10 (kcat and kuncat, respectively) at different pH values. The numbers on each set of bar graphs are the magnitude of acceleration, kcat/kuncat. Error bars represent standard errors obtained from duplicate experiments. ns (not significant), * and ** mean that the P value of statistical testing is ≥0.05, 0.01 to 0.05, and 0.001 to 0.01, respectively. See Section S7 for details. (D–I) Concentration changes of fuel 2, waste 5, waste 7, and fuel dimer 15 species (D,F,H) and catalyst-containing species (E,G,I) over time at different pH values. Note that the reactions were monitored for 60 min, not 120 min. Scatter: experimental results and line: fitted model. Error bars represent standard errors obtained from duplicate experiments. Reaction conditions: model aldehyde 10 (6 mM); ester fuel 2 (48 mM, 8 equiv); MES or HEPES buffer (200 mM) at pH = 6.10, 6.55, 7.00 or 7.90; D2O; and 293 K.

Similar articles

Cited by

References

    1. Amos L. A. Molecular Motors: Not Quite like Clockwork. Cell. Mol. Life Sci. 2008, 65 (4), 509–515. 10.1007/s00018-008-7518-3. - DOI - PMC - PubMed
    1. Vale R. D.; Milligan R. A. The Way Things Move: Looking Under the Hood of Molecular Motor Proteins. Science 2000, 288 (5463), 88–95. 10.1126/science.288.5463.88. - DOI - PubMed
    1. Novák B.; Tyson J. J. Design Principles of Biochemical Oscillators. Nat. Rev. Mol. Cell Biol. 2008, 9 (12), 981–991. 10.1038/nrm2530. - DOI - PMC - PubMed
    1. Porter S. L.; Wadhams G. H.; Armitage J. P. Signal Processing in Complex Chemotaxis Pathways. Nat. Rev. Microbiol. 2011, 9 (3), 153–165. 10.1038/nrmicro2505. - DOI - PubMed
    1. Kay E. R.; Leigh D. A.; Zerbetto F. Synthetic Molecular Motors and Mechanical Machines. Angew. Chem., Int. Ed. 2007, 46 (1–2), 72–191. 10.1002/anie.200504313. - DOI - PubMed

LinkOut - more resources