. 2024 Aug 27;43(8):114616.
doi: 10.1016/j.celrep.2024.114616. Epub 2024 Aug 9.

Mutant TP53 switches therapeutic vulnerability during gastric cancer progression within interleukin-6 family cytokines

Affiliations

Mutant TP53 switches therapeutic vulnerability during gastric cancer progression within interleukin-6 family cytokines

Anne Huber et al. Cell Rep. .

Abstract

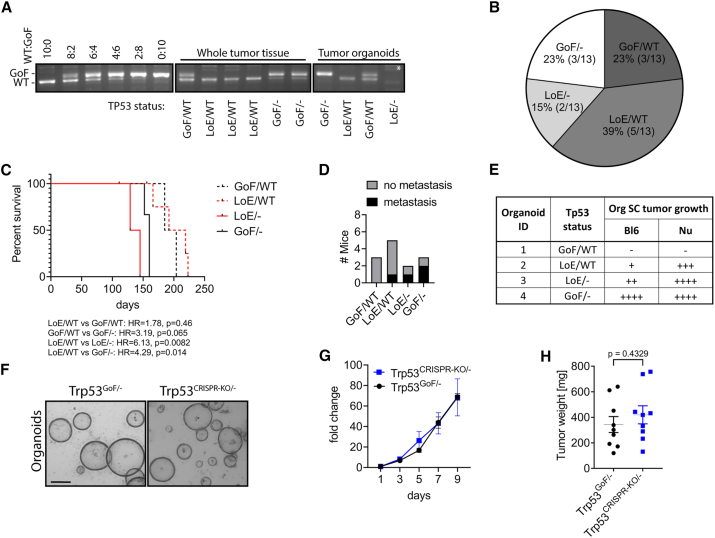
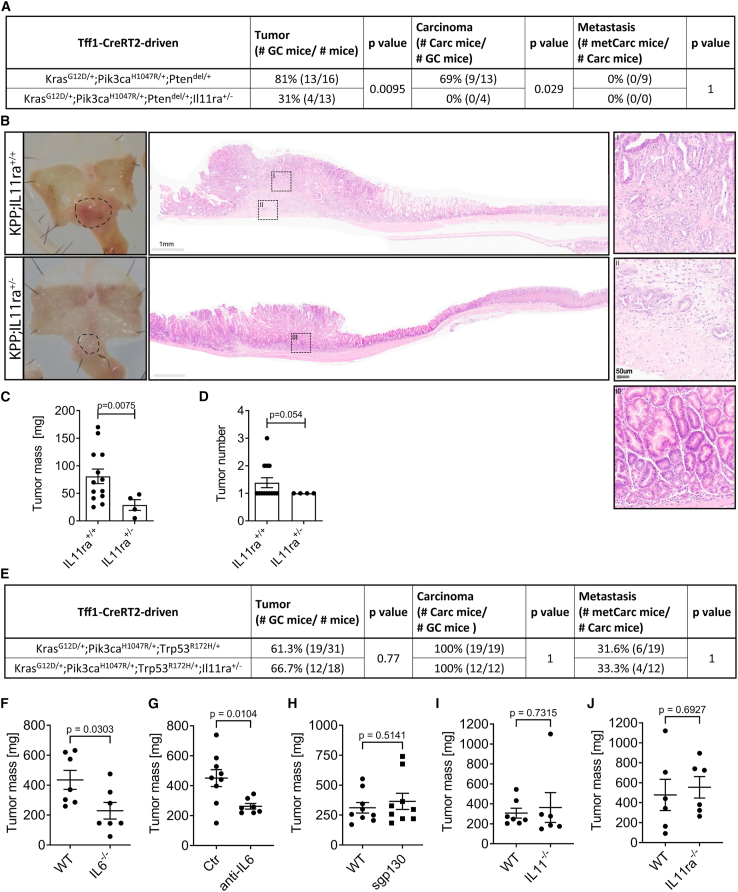
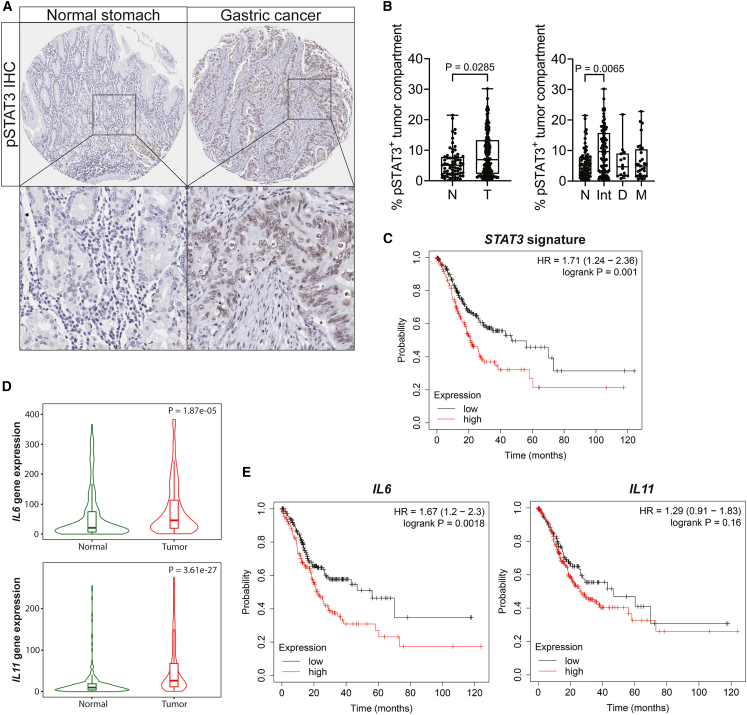
Although aberrant activation of the KRAS and PI3K pathway alongside TP53 mutations account for frequent aberrations in human gastric cancers, neither the sequence nor the individual contributions of these mutations have been clarified. Here, we establish an allelic series of mice to afford conditional expression in the glandular epithelium of KrasG12D;Pik3caH1047R or Trp53R172H and/or ablation of Pten or Trp53. We find that KrasG12D;Pik3caH1047R is sufficient to induce adenomas and that lesions progress to carcinoma when also harboring Pten deletions. An additional challenge with either Trp53 loss- or gain-of-function alleles further accelerated tumor progression and triggered metastatic disease. While tumor-intrinsic STAT3 signaling in response to gp130 family cytokines remained as a gatekeeper for all stages of tumor development, metastatic progression required a mutant Trp53-induced interleukin (IL)-11 to IL-6 dependency switch. Consistent with the poorer survival of patients with high IL-6 expression, we identify IL-6/STAT3 signaling as a therapeutic vulnerability for TP53-mutant gastric cancer.

Keywords: CP: Cancer; STAT3; TP53; WNT; animal model; cytokine signaling; gastric carcinoma; interleukin-11; interleukin-6; metastasis; organoids.


Conflict of interest statement

Declaration of interests M.E. serves on the scientific advisory board of Lassen Therapeutics, which develops anti-IL-11 therapeutics.

Figures

None
Graphical abstract
Figure 1
Figure 1
Mutant Kras, Pik3ca, and Trp53 drive gastric invasive Carc formation (A) Table shows the incidence rate in percentage and the number of mice (in brackets) with gastric tumors (GC), carcinomas (Carc), and metastatic Carc (metCarc) after tamoxifen administration to Tff1CreERT2-positive mice harboring the lox-STOP-lox (LSL)-flanked exons KrasLSL-G12D/+;Pik3caLSL-H1047R/+ (KP), KrasLSL-G12D/+;Pik3caLSL-H1047R/+;Ptenflox/+ (KPP), or KrasLSL-G12D/+;Pik3caLSL-H1047R/+;Trp53LSL-R172H/+ (KPT). p values of Fisher’s exact test are shown. (B) Representative images of whole-mount stomachs (left) and microscopic images of H&E-stained stomach cross-sections (scale bar: 2 mm) containing lesion from mice with genotypes as in (A). (I)–(VI) show higher-power images of mucosal and submucosal (=invasive) parts of the tumors (scale bar: 50 μm). N depicts necrotic tumor tissue, and the arrow (in VI) points at tumors cells invading stomach serosa. KP and KPP mice were euthanized and analyzed at 260 days post-tamoxifen administration (experimental endpoint without sickness). The KPT mouse was euthanized at 134 days when it reached ethical endpoints. (C) Representative H&E-stained liver (left) and lung (right) sections containing metastasis in KPT mice (scale bar: 50 μm). Images shown are from two mice. (D) Kaplan-Meier survival analysis of mice with genotypes: Tff1CreERT2-negative (Cre) and Tff1CreERT2-positive mice harboring the mutant allele combinations: KrasLSL-G12D/+;Pik3caLSL-H1047R/+ (KP), KrasLSL-G12D/+;Pik3caLSL-H1047R/+;Ptenflox/+ (KPP), or KrasLSL-G12D/+;Pik3caLSL-H1047R/+;Trp53LSL-R172H/+ (KPT). For the KPP versus KPT comparison, the hazard ratios (HRs) and p values were calculated with log-rank (Mantel-Cox) test are displayed. n = 16, 16, 16, and 24, respectively. See also Figure S1 and Table S1.
Figure 2
Figure 2
Tp53 mutation status in KPT tumors (A) Image showing the Trp53 status PCR assay performed on genomic DNA of whole-tumor or organoid (Org) lysates from Tff1CreERT2/+;KrasLSL-G12D/+;Pik3caLSL-H1047R/+;Trp53LSL-R172H/+ (KPT) mice. The upper band indicates the presence of the GoF allele and the lower band the WT allele. GoF, gain of function = recombined Trp53LSL-R172H allele; LoE, loss of expression = non-recombined Trp53LSL-R172H allele leads to no Trp53 being expressed; WT, wild-type Trp53, − = the wild-type Trp53 allele being genetically lost. Asterisk () indicates that secondary genomic DNA PCR was used to confirm the presence of the non-recombined Trp53LSL-R172H allele. (B) Frequency of Trp53 status assessed by PCR assay (shown in A) in tumors from KPT mice (n = 13). (C) Kaplan-Meier survival analysis of KPT mice based on tumor Trp53 status. The HRs and p values of log-rank (Mantel-Cox) test are shown. n = 3, 5, 2, and 3, respectively. (D) Number of KPT mice presenting with or without metastasis based on primary tumor Trp53 status. (E) Table depicting the tumor allograft growth potential of GC Orgs derived from KPT mice with indicated Trp53 status in C57BL/6 WT and BALB/c Nu/Nu host mice (n = 4 host mice per Orgs per background). −, no tumor growth within 80 days; +, initial tumors ≤50 mm3 form but do not progress within 80 days; ++, tumors grow ≥1,000 mm3 within 80 days; +++, tumors grow ≥1,000 mm3 within 55 days; ++++, tumors grow ≥1,000 mm3 within 30 days. (F) Representative photomicrograph of parental (P) Trp53GoF/ Orgs and one of the co-isogenic CRISPR-Cas9-mediated Trp53CRISPR-KO/− daughter Org clone (scale bar: 200 μm). (G) In vitro Org growth assessment of Trp53GoF/ P and Trp53CRISPR-KO/− daughter Orgs. Average fold changes (relative to day 1) of luminescence of n = 3 independent experiments are shown; each experiment was conducted with four technical replicates. Data represent mean ± SEM. (H) Tumor mass at endpoint of Trp53GoF/ Orgs and Trp53CRISPR-KO/− daughter Orgs subcutaneously (s.c.) injected into C57BL/6 host mice (n = 9 and 9). Two-sided, unpaired t test p values and mean ± SEM are shown. See also Figure S3.
Figure 3
Figure 3
Stage-specific ligand switch for mandatory Stat3 activity in tumor cells (A) Representative photograph of pSTAT3 immunohistochemistry staining of Tff1CreRT2;KrasLSL-G12D/+;Pik3caLSL-H1047R/+;Ptenflox/+ (KPP; left) and Tff1CreRT2;KrasLSL-G12D/+;Pik3caLSL-H1047R/+;Trp53LSL-R172H/+ (KPT; right) mouse stomachs (scale bar: 2 mm) with magnification of the invasive tumor front (I and III) and the mucosal tumor core (II and IV) (scale bar: 50 μm). (B) Schematic of KPT mutant GC Org s.c. transplantation into C57BL/6 WT mice with indicated treatment cohorts. EP, endpoint. Created with BioRender.com. (C) Tumor mass at endpoint of KPT Org SC allograft experiment as outlined in (B) for vehicle (Veh)- and BBI608 (BBI)-treated animals. n = 6 and 6 (experiment was performed once). (D) Immunoblotting for STAT3 and GAPDH protein on Org lysates from P and CRISPR-Cas9 Stat3KO clone 1 (C1). (E) Tumor mass at endpoint of Stat3WT (WT) or Stat3KO (KO) KPT GC Orgs following s.c. implantation into C57BL/6 mice. n = 13 and 15 (pooled data from two independent experiments). (F and G) qPCR gene expression analysis for Il11 and Il6 in whole-tissue lysates of antrum normal (AN) tissue and antrum tumor (AT) of indicated genotypes. Expression data are presented relative to the mean of CreKPP (F) or AN CreKPT (G) data points. p values shown are from one-way ANOVA + Tukey’s multiple comparison testing; for the IL6 graph in (F), all p > 0.3. n = 6, 10, and 9 (F, left) and n = 6, 10, and 8 (F, right). n = 4, 6, and 7 (G, both graphs). (H) qPCR-determined expression levels of IL6 in Orgs derived from WT antrum stomach and stomach tumors of KPT mutant mice. Expression data are presented relative to WT AN values. p values of Mann-Whitney test are shown. n = 5 and 4. (I) Expression levels of IL6 in human gastric cancer cell lines grouped into TP53WT (WT), TP53 (T) mutant, or KRAS;PI3K;TP53 (KPT) mutant activation signature positive. RNA sequencing data were downloaded from the Broad Institutes Cancer Cell Line Encyclopedia. Data are shown as box and whiskers plots (10th–90th percentile). n = 8, 21, and 7, respectively. The y axis depicts log2 counts per million values. Kruskal-Wallis and Dunn’s multiple comparison’s test were performed. Data represent mean ± SEM (C and E–I). Each symbol represents a biological replicate, specifically one mouse (C and E–G), independent Org culture (H), or human GC cell line (I). Two-sided Student’s t test p values are shown (C and E). See also Figure S4.
Figure 4
Figure 4
Functional stage-specific reliance on IL-6 family cytokines (A) Table summarizing gastric tumor (GC), Carc, and metCarc incidences after tamoxifen administration to Tff1CreRT2-positive mice either harboring KrasLSL-G12D/+;Pik3caLSL-H1047R/+;Ptenflox/+ (KPP) or KrasLSL-G12D/+;Pik3caLSL-H1047R/+;Ptenflox/+;Il11ra+/− (KPP;IL11ra+/−). KPP data are also shown in Figure 1A. (B) Representative H&E staining of whole-mount stomachs and microscopic images of stomach lesions and mice with genotypes as in (A). Scale bars are as indicated. (C and D) Gastric tumor burden (C) and tumor number (D) analysis is shown from tumor-bearing mice (Tff1CreERT2;KrasLSL-G12D/+;Pik3caLSL-H1047R/+;Ptenflox/+) harboring either IL11ra+/+ or IL11ra+/− at 250 days post-mutant allele induction. n = 13 and 4 (C and D). (E) Table summarizing gastric tumor (GC), Carc, and metCarc incidences after tamoxifen administration to Tff1CreRT2-positive mice harboring either KrasLSL-G12D/+;Pik3caLSL-H1047R/+;Trp53LSL-R172H/+ (KPT) or KrasLSL-G12D/+;Pik3caLSL-H1047R/+;Trp53R172H/+;Il11ra+/− (KPT;IL11ra+/−). KPT data are also shown in Figure 1A. (F–J) Tumor mass at endpoints of s.c. Org allograft experiment where KPT GC Orgs were transplanted into either WT or IL-6−/− hosts (F). WT hosts were treated when tumors reached 100 mm3 volume with isotype control antibody (Ctr) or with IL-6 neutralizing antibody (anti-IL-6) (G). Orgs were implanted into WT or sgp130 hosts (H), WT or IL11−/− hosts (I), and WT or IL11ra−/− hosts (J). Experiments were performed once. n = 7 and 7 (F), 9 and 7 (G), 9 and 9 (H), 7 and 6 (I), and 6 and 6 (J). Data represent mean ± SEM (C, D, and F–I). Each symbol represents a biological replicate, specifically one mouse (C, D, and F–J). p values of Fisher’s exact test (A and E) and two-sided Student’s t test (C, D, and F–J) are shown. See also Figure S5.
Figure 5
Figure 5
IL-6-IL-11-Stat3 signaling in patients with gastric cancer (A) Representative image of pSTAT3 immunohistochemical staining on normal stomach and gastric cancer cores of tumor tissue microarray. (B) HALO quantification of pSTAT3 positivity specifically in the tumor compartment comparing normal (N) versus gastric tumor (T) and normal tissues versus gastric cancer Lauren subtypes (right graph; Int, intestinal; D, diffuse; M, mixed). Each symbol represents a biological replicate, specifically individual patient samples. n = 68 and 154 (left) and 68, 95, 14, and 31 (right). (C) Kaplan-Meier survival analysis (overall survival) of STAT3 signaling activation gene signature (STAT3, SOCS3, OSMR, CLDN12, PIM3) high versus low in stomach adenocarcinoma (prepared with Kaplan-Meier plot). n = 220 (low) and 151 (high); stratified with KMplot’s “best cutoff” algorithm; false discovery rate (FDR) = 20%. (D) IL6 and IL11 mRNA expression in normal stomach (N) versus gastric tumor (T) tissues. IL6 expression is 1.86-fold and IL11 is 3-fold increased in the stomach adenocarcinoma (median fold change). p values from Mann-Whitney test (prepared with TNMplot). (E) Kaplan-Meier survival analysis (overall survival) of IL6 and IL11 high versus low RNA expression in stomach adenocarcinomas (prepared with KMplot). n = 218 and 153 (left; FDR = 20%) and 132 and 239 (right; FDR = 100%); stratified with KMplot’s “best cutoff” algorithm. Data represent mean ± SEM (B) and a violin plot with inner box plot depicting 1st to 3rd quartile and median (D). p values of Mann-Whitney test (B, left, and D), Kruskal-Wallis + Dunnett’s multiple comparisons test (B, right), and HRs and p values of log-rank (Mantel-Cox) test (C and E) are shown. See also Figure S6 and Table S2.

References

    1. Sung H., Ferlay J., Siegel R.L., Laversanne M., Soerjomataram I., Jemal A., Bray F. Global Cancer Statistics 2020: GLOBOCAN Estimates of Incidence and Mortality Worldwide for 36 Cancers in 185 Countries. CA A Cancer J. Clin. 2021;71:209–249. doi: 10.3322/caac.21660. - DOI - PubMed
    1. Arnold M., Rutherford M., Lam F., Bray F., Ervik M., Soerjomataram I. 2019. ICBP SURVMARK-2 Online Tool: International Cancer Survival Benchmarking. Lyon, France.https://gco.iarc.fr/survival/survmark International Agency for Research on Cancer.
    1. Cancer Genome Atlas Research Network Comprehensive molecular characterization of gastric adenocarcinoma. Nature. 2014;513:202–209. doi: 10.1038/nature13480. - DOI - PMC - PubMed
    1. Cristescu R., Lee J., Nebozhyn M., Kim K.M., Ting J.C., Wong S.S., Liu J., Yue Y.G., Wang J., Yu K., et al. Molecular analysis of gastric cancer identifies subtypes associated with distinct clinical outcomes. Nat. Med. 2015;21:449–456. doi: 10.1038/nm.3850. - DOI - PubMed
    1. Wang K., Yuen S.T., Xu J., Lee S.P., Yan H.H.N., Shi S.T., Siu H.C., Deng S., Chu K.M., Law S., et al. Whole-genome sequencing and comprehensive molecular profiling identify new driver mutations in gastric cancer. Nat. Genet. 2014;46:573–582. doi: 10.1038/ng.2983. - DOI - PubMed

Publication types

MeSH terms