. 2024 Aug 20;5(8):101684.
doi: 10.1016/j.xcrm.2024.101684. Epub 2024 Aug 10.

SIRT1 improves lactate homeostasis in the brain to alleviate parkinsonism via deacetylation and inhibition of PKM2

Affiliations

SIRT1 improves lactate homeostasis in the brain to alleviate parkinsonism via deacetylation and inhibition of PKM2

Bolin Lian et al. Cell Rep Med. .

Abstract

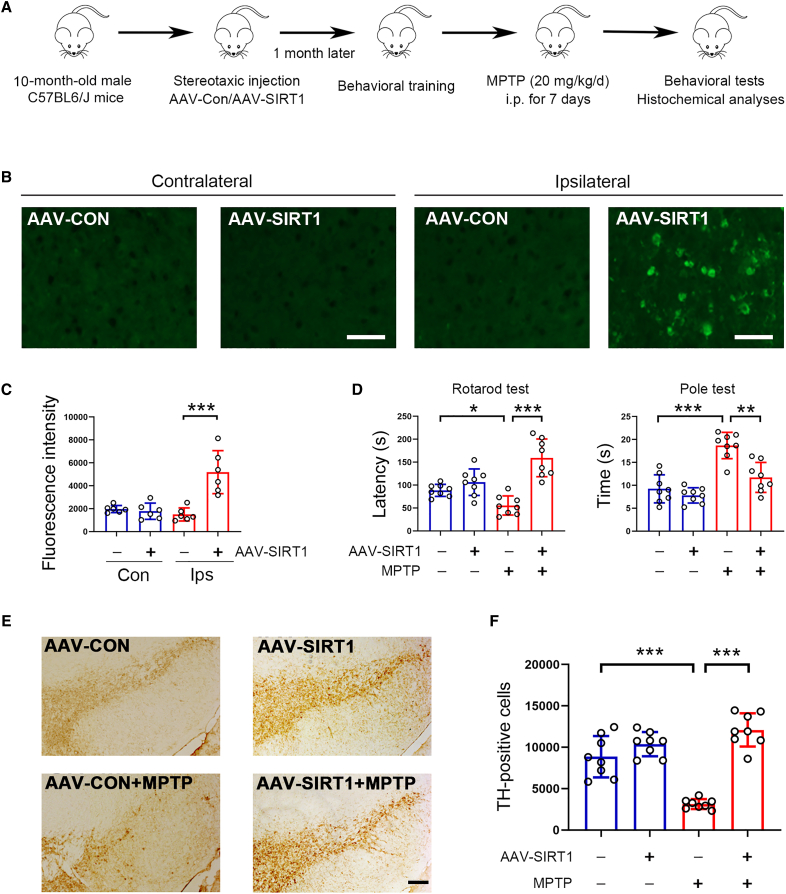
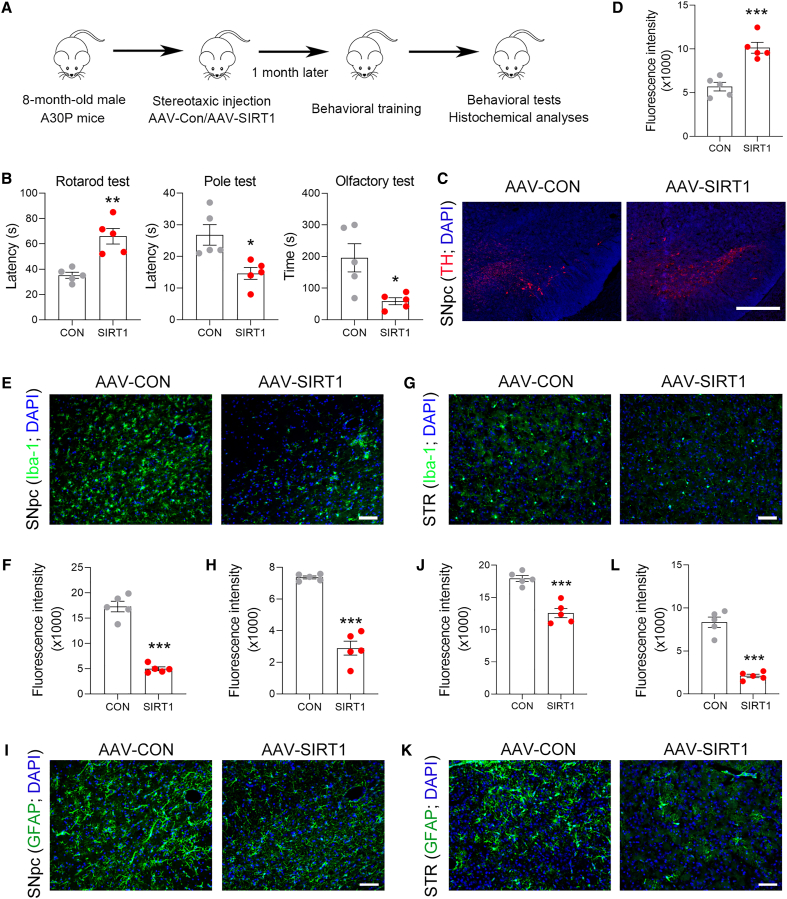
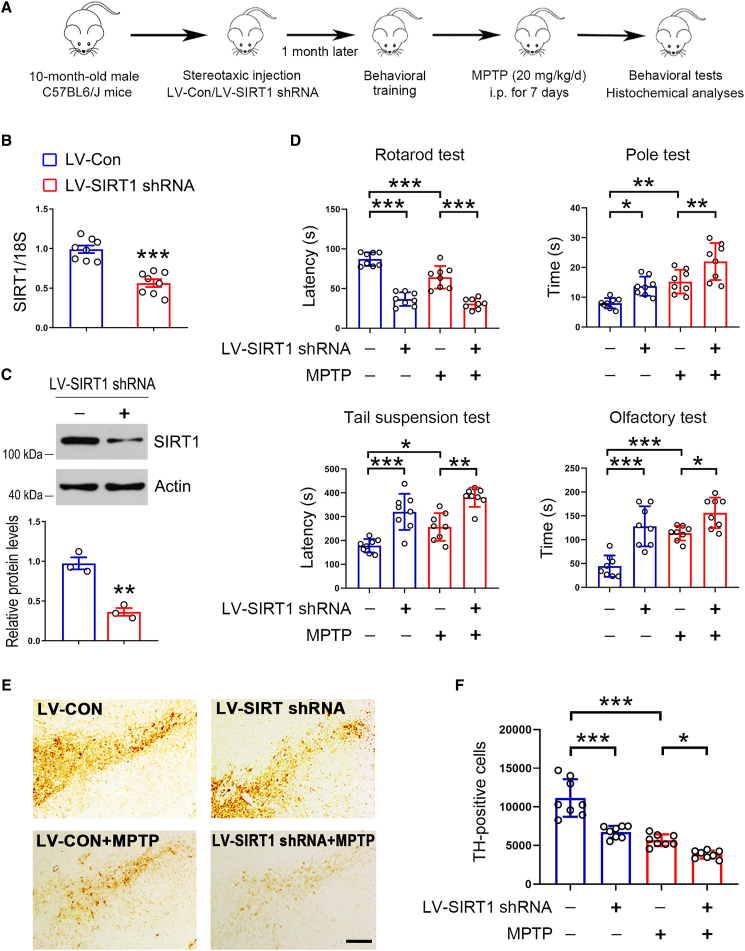
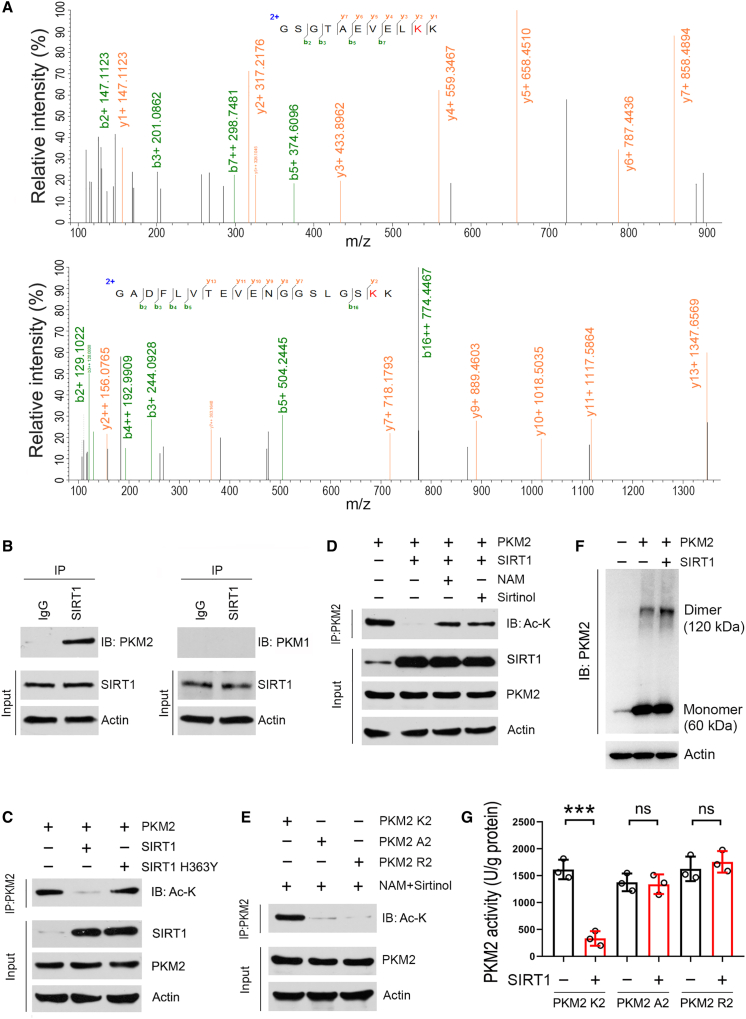
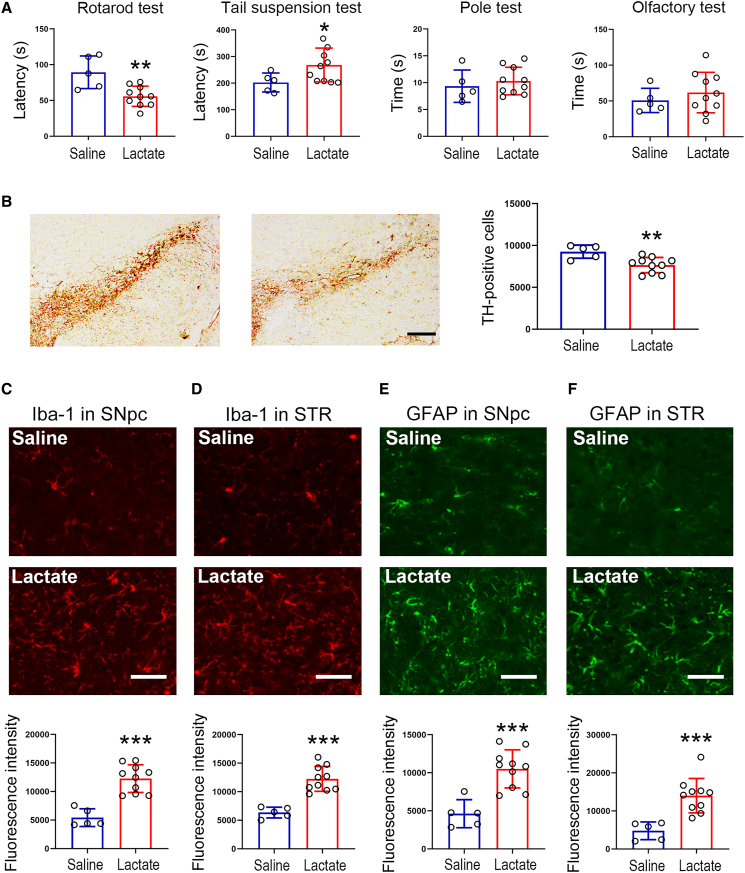
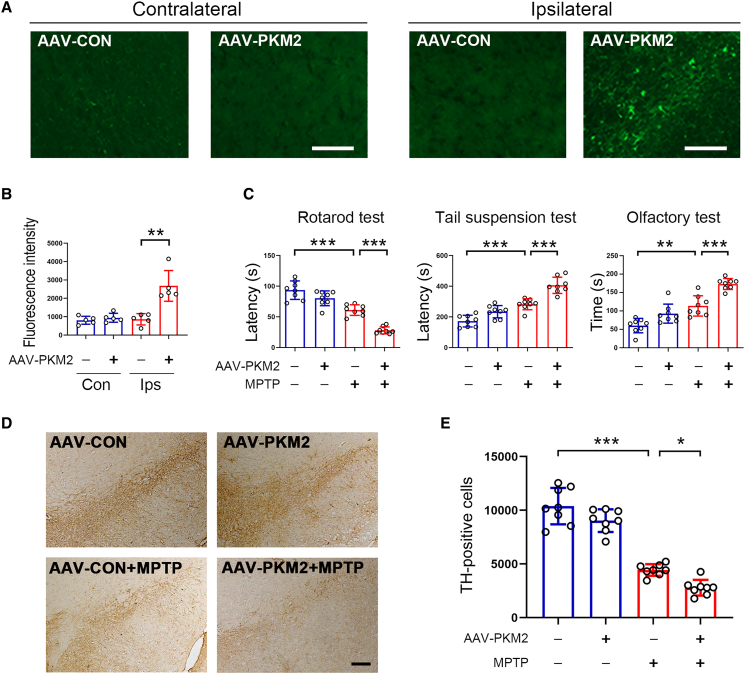
Sirtuin 1 (SIRT1) is a histone deacetylase and plays diverse functions in various physiological events, from development to lifespan regulation. Here, in Parkinson's disease (PD) model mice, we demonstrated that SIRT1 ameliorates parkinsonism, while SIRT1 knockdown further aggravates PD phenotypes. Mechanistically, SIRT1 interacts with and deacetylates pyruvate kinase M2 (PKM2) at K135 and K206, thus leading to reduced PKM2 enzyme activity and lactate production, which eventually results in decreased glial activation in the brain. Administration of lactate in the brain recapitulates PD-like phenotypes. Furthermore, increased expression of PKM2 worsens PD symptoms, and, on the contrary, inhibition of PKM2 by shikonin or PKM2-IN-1 alleviates parkinsonism in mice. Collectively, our data indicate that excessive lactate in the brain might be involved in the progression of PD. By improving lactate homeostasis, SIRT1, together with PKM2, are likely drug targets for developing agents for the treatment of neurodegeneration in PD.


Conflict of interest statement

Declaration of interests The effect of PKM2-IN-1 in treating Parkinson’s disease has been patented (WO2022022748), and C.S. and Y.W. are listed as the inventors.

Figures

None
Graphical abstract
Figure 1
Figure 1
Increased expression of SIRT1 plays beneficial roles against parkinsonism in mice (A) Schematic diagram of experiments. i.p. means intraperitoneal injection. (B) Immunostaining of SIRT1 in the brain for showing efficacy of AAV-SIRT1 transduction. Scale bar, 50 μm. n = 6 for each group. (C) Quantitative analysis of immunostaining data shown in (B). n = 6 for each group. (D) SIRT1 attenuates behavioral defects in PD model mice. n = 8 for each group. (E) Histochemical analysis of tyrosine hydroxylase (TH) expression in the SNpc. Scale bar, 200 μm. n = 8 for each group. (F) Quantitative analysis of TH-positive neurons as shown in (E). n = 8 for each group. Error bar represents ± SD. ∗p < 0.05, ∗∗p < 0.01, ∗∗∗p < 0.001. Two-tailed Student’s t test was used to calculate statistical difference in (C). Two-way ANOVA with Tukey’s test was used to calculate statistical difference in (D) and (F).
Figure 2
Figure 2
SIRT1 rectifies parkinsonism-related dysfunctions in A30P mice (A) Schematic diagram of experiments. (B) Defected behavioral performances in A30P mice were improved by SIRT1. n = 5 for each group. (C and D) TH expression was increased by SIRT1 in the SNpc. TH expression (red) was analyzed by immunostaining. DAPI (blue) was used to identify the nucleus. Scale bar, 500 μm. n = 5 for each group. (E–H) Immunostaining for Iba-1 (green) in the SNpc (E and F) and striatum (G and H). DAPI (blue) was used to identify the nucleus. Scale bar, 50 μm. n = 5 for each group. (I–L) Immunostaining for GFAP (green) in the SNpc (I and J) and striatum (STR; K and L). DAPI (blue) was used to identify the nucleus. Scale bar, 50 μm. n = 5 for each group. Error bar represents ± SD. ∗p < 0.05, ∗∗p < 0.01, and ∗∗∗p < 0.001, two-tailed Student’s t test.
Figure 3
Figure 3
Reduced SIRT1 expression aggravates behavioral defects in mice (A) Schematic diagram of experiments. (B) Real-time qPCR analysis of Sirt1 expression in the midbrain. 18S was used as a house-keeping gene. n = 8 for each group. (C) Western blot analysis of SIRT1 in the midbrain. Actin was used as a loading control. Blots are representative of 3 independent experiments. (D) SIRT1 knockdown further impairs behavioral performances in PD model mice. n = 8 for each group. (E) Histochemical analysis of TH expression in the SNpc. Representative images were shown. Scale bar, 200 μm. n = 8 for each group. (F) Quantitative analysis of TH-positive neurons in the SNpc. n = 8 for each group. Error bar represents ± SD. ∗p < 0.05, ∗∗p < 0.01, and ∗∗∗p < 0.001. Two-tailed Student’s t test was used to calculate statistical difference in (B) and (C). Two-way ANOVA with Tukey’s test was used to calculate statistical difference in (D) and (F).
Figure 4
Figure 4
SIRT1 deacetylates PKM2 and inhibits the activity of PKM2 (A) Identification of SIRT1-mediated deacetylated lysine residues in PKM2. SH-SY5Y cells were transfected with the plasmid expressing S-tag fused PKM2. 12 h post-transfection, cells were treated with NAM and sirtinol for an additional 12 h. PKM2 protein was purified by S-protein agarose and the purified protein was separated by SDS-PAGE. The gel was stained with colloidal Coomassie blue dye and the band for PKM2 was collected and subjected to liquid chromatography-tandem mass spectrometry (LC-MS/MS) analysis. Spectrometry data showing lysine residues of 135 and 206 in PKM2 were acetylated by inhibition of SIRT1. (B) Co-immunoprecipitation analysis. SH-SY5Y cells were transfected with the plasmid expressing Sirt1. 24 h post-transfection, cells were harvested for co-immunoprecipitation analysis by using anti-SIRT1 antibody. IgG was used as a negative control. The immunocomplex was subsequently analyzed by western blot. (C) SIRT1 decreases PKM2 acetylation. SH-SY5Y cells were co-transfected with PKM2 with SIRT1 or SIRT1 H363Y. 24 h post-transfection, cells were harvested for immunoprecipitation assay by using anti-PKM2 antibody. The immunocomplex was subsequently analyzed by western blot. (D) Inhibition of SIRT1 increases PKM2 acetylation. SH-SY5Y cells were co-transfected with PKM2 and SIRT1. 12 h post-transfection, cells were incubated with NAM or sirtinol as indicated. After additional 12 h incubation, cells were harvested for immunoprecipitation by using anti-PKM2 antibody and the immunocomplex was analyzed by western blot. NAM, nicotinamide. (E) Mutations of K135 and K206 in PKM2 with alanine (R2) or arginine (A2) abolish acetylation modification induced by inhibition of SIRT1. SH-SY5Y cells were transfected with wild-type PKM2 (PKM2 K2) or PKM2 R2 or PKM2 R2. 12 h post-transfection, cells were treated with NAM and sirtinol for additional 12 h, and then cells were harvested for immunoprecipitation using anti-PKM2 antibody and the immunocomplex was analyzed by western blot. NAM, nicotinamide. (F) SIRT1 induces PKM2 dimerization. SH-SY5Y cells were transfected with SIRT1 and PKM2 as indicated. 24 h post-transfection, cells were collected and incubated with DSS solution for 30 min. After cross-linking, cells were subjected to cell lysate preparation and resulting protein samples were analyzed by western blot. Actin was used a loading control. (G) SIRT1 inhibits PKM2 activity. SH-SY5Y cells were transfected with SIRT1, SIRT1 H363Y, and PKM2 as indicated. 24 h post-transfection, cells were harvested for PKM2 purification and PKM2 activity assay. n = 3 for each group. Blots are representative of 3 independent experiments. Error bar represents ± SD. ns means no significance. ∗∗∗p < 0.001, two-tailed Student’s t test.
Figure 5
Figure 5
Lactate infusion induces parkinsonism-like phenotypes in mice Mice were administered with sodium lactate (300 mM, 10 μL for each mouse) into the third ventricle. 7 days post-injection, mice were subjected to behavioral tests. (A) Lactate infusion aggravates behavioral defects in mice. n = 5 for saline group; n = 10 for lactate group. (B) Lactate infusion induces dopaminergic neuron loss in the SNpc. Scale bar, 200 μm. n = 5 for saline group; n = 10 for lactate group. (C and D) Lactate infusion induces microglia activation in the SNpc (C) and striatum (D). Scale bar, 50 μm. n = 5 for saline group; n = 10 for lactate group. (E and F) Lactate infusion induces astrocyte activation in the SNpc (E) and striatum (F). Scale bar, 50 μm. n = 5 for saline group; n = 10 for lactate group. Error bar represents ± SD. STR: striatum. ∗p < 0.05, ∗∗p < 0.01, and ∗∗∗p < 0.001, two-tailed Student’s t test.
Figure 6
Figure 6
PKM2 worsened PD symptoms in MPTP-treated mice 10-month-old male C57BL6/J mice received AAV-PKM2 or AAV-Con virus in the SNpc by stereotaxic injection. One month later, mice were subjected to PD model generation by intraperitoneal injection with MPTP at the dosage of 20 mg/kg/day for consecutive 7 days (A) Immunofluorescence analysis for PKM2 expression in the contralateral and ipsilateral regions. Scale bar, 100 μm. n = 5 for each group. (B) Quantitative analysis of PKM2 expression based upon immunofluorescence data as shown in (A). n = 5 for each group. (C) Behavioral performance tests. n = 8 for each group. (D) Immunohistochemical staining for TH-positive cells in the SNpc. Scale bar, 200 μm. (E) Quantitative analysis of TH-positive cells in the SNpc based upon immunohistochemical staining as shown in (D). n = 8 for each group. Error bar represents ± SD. ∗p < 0.05, ∗∗p < 0.01, and ∗∗∗p < 0.001. Two-tailed Student’s t test was used to calculate statistical difference in (B). Two-way ANOVA with Tukey’s test was used to calculate statistical difference in (C) and (E).
Figure 7
Figure 7
PKM2 inhibition attenuates PD-related phenotypes (A) Experimental outlines showing PD model mouse generation and pharmacological interventions. (B) Behavioral tests showing the defects in rotarod, pole, and olfactory tests were improved by shikonin. n = 5 for each group. (C) The behavioral defects in MPTP-treated mice were alleviated by PKM2-IN-1. n = 5 for each group. (D and E) The chemical structures of shikonin (D) and PKM2-IN-1 (E). (F) The levels of shikonin and PKM2-IN-1 in the brain. n = 5 for each group. Error bar represents ± SD. ns means no significance. ∗p < 0.05, ∗∗p < 0.01, and ∗∗∗p < 0.001, two-way ANOVA with Tukey’s test.

References

    1. GBD 2016 Neurology Collaborators Global, regional, and national burden of neurological disorders, 1990-2016: a systematic analysis for the Global Burden of Disease Study 2016. Lancet Neurol. 2019;18:459–480. doi: 10.1016/S1474-4422(18)30499-X. - DOI - PMC - PubMed
    1. Kalia L.V., Lang A.E. Parkinson's disease. Lancet. 2015;386:896–912. doi: 10.1016/S0140-6736(14)61393-3. - DOI - PubMed
    1. Armstrong M.J., Okun M.S. Diagnosis and Treatment of Parkinson Disease: A Review. JAMA. 2020;323:548–560. doi: 10.1001/jama.2019.22360. - DOI - PubMed
    1. Braak H., Del Tredici K., Rüb U., de Vos R.A.I., Jansen Steur E.N.H., Braak E. Staging of brain pathology related to sporadic Parkinson's disease. Neurobiol. Aging. 2003;24:197–211. doi: 10.1016/s0197-4580(02)00065-9. - DOI - PubMed
    1. Bloem B.R., Okun M.S., Klein C. Parkinson's disease. Lancet. 2021;397:2284–2303. doi: 10.1016/S0140-6736(21)00218-X. - DOI - PubMed

MeSH terms

LinkOut - more resources