. 2024 Aug 12;9(1):207.
doi: 10.1038/s41392-024-01923-z.

Potassium voltage-gated channel subfamily H member 2 (KCNH2) is a promising target for incretin secretagogue therapies

Affiliations

Potassium voltage-gated channel subfamily H member 2 (KCNH2) is a promising target for incretin secretagogue therapies

Ying-Chao Yuan et al. Signal Transduct Target Ther. .

Abstract

Derived from enteroendocrine cells (EECs), glucagon-like peptide-1 (GLP-1) and glucose-dependent insulinotropic peptide (GIP) are pivotal incretin hormones crucial for blood glucose regulation. Medications of GLP-1 analogs and GLP-1 receptor activators are extensively used in the treatment of type 2 diabetes (T2D) and obesity. However, there are currently no agents to stimulate endogenous incretin secretion. Here, we find the pivotal role of KCNH2 potassium channels in the regulation of incretin secretion. Co-localization of KCNH2 with incretin-secreting EECs in the intestinal epithelium of rodents highlights its significance. Gut epithelial cell-specific KCNH2 knockout in mice improves glucose tolerance and increases oral glucose-triggered GLP-1 and GIP secretion, particularly GIP. Furthermore, KCNH2-deficient primary intestinal epithelial cells exhibit heightened incretin, especially GIP secretion upon nutrient stimulation. Mechanistically, KCNH2 knockdown in EECs leads to reduced K+ currents, prolonged action potential duration, and elevated intracellular calcium levels. Finally, we found that dofetilide, a KCNH2-specific inhibitor, could promote incretin secretion in enteroendocrine STC-1 cells in vitro and in hyperglycemic mice in vivo. These findings elucidate, for the first time, the mechanism and application of KCNH2 in regulating incretin secretion by EECs. Given the therapeutic promise of GLP-1 and GIP in diabetes and obesity management, this study advances our understanding of incretin regulation, paving the way for potential incretin secretagogue therapies in the treatment of diabetes and obesity.


Conflict of interest statement

The authors declare no competing interests.

Figures

Fig. 1
Fig. 1
Expression of KCNH2 in incretin-producing enteroendocrine cells. a Relative KCNH2 mRNA expression assessed by qRT-PCR in murine heart, intestinal tissues, and esophagus (n = 4). b Relative KCNH2 mRNA expression assessed by qRT-PCR in murine heart, duodenum Venus-positive primary intestinal epithelial cells (PIEC) and ileum Venus-positive PIEC, PIEC from the duodenum (top 10 cm of the small intestine) and ileum (bottom 10 cm of the small intestine) (n = 4). Gene expression was quantified as 2−ΔΔct, with 36B4 as an internal control. c Immunofluorescence analysis depicted the localization of KCNH2 and GIP in the duodenum of control and KCNH2 gut epithelial cell-conditional knockout mice (CKO) mice, with a scale bar representing 50 μm. d Immunofluorescence staining revealed the localization of KCNH2 and GLP-1 in the ileum of control and KCNH2 CKO mice, also with a scale bar of 50 μm
Fig. 2
Fig. 2
KCNH2 deficiency enhances insulin and incretin secretion in response to glucose in vivo. a Blood glucose levels and area under the curve (AUC) during an oral glucose tolerance test (OGTT, 5 g/kg) for mice (high-fat diet (HFD)-fed for 6–8 weeks, started at week 8) (Control, n = 9; CKO, n = 9). b Blood glucose levels and AUC during an intraperitoneal glucose tolerance test (IPGTT) (2 g/kg) for mice (HFD-fed for 6–8 weeks, started at week 8) (Control, n = 9; CKO, n = 9). ce Serum GIP (c), GLP-1 (d), and insulin levels (e), along with their AUC during OGTT (5 g/kg) for mice (HFD-fed for 6–8 weeks, started at week 8) (Control, n = 9; CKO, n = 9). f Blood glucose levels and AUC during an intraperitoneal insulin tolerance test (IPITT) (0.75 U/kg) for mice (HFD-fed for 6–8 weeks, started at week 8) (Control, n = 9; CKO, n = 9). Values are means ± SEM. Statistical significance was assessed by Student’s t-test. *p < 0.05; **p < 0.01; n.s. means not significant
Fig. 3
Fig. 3
KCNH2-deficient PIEC showed enhanced incretin secretion. a, b Protein levels of KCNH2 in PIEC from Control and CKO mice assessed by immunoblotting (n = 3 mice per group). c Quantitative PCR was used to assess the relative mRNA expression of KCNH2, GIP, and GCG in the PIEC of the duodenum and ileum (n = 6 mice per group). 2−ΔΔct was used to calculate gene expression, while 36B4 served as an internal control. dh In vitro 10 mM glucose (d) or 10 mM glucose supplemented with 10 μM Forskolin plus 10 μM IBMX (e), 50 μM α-LA (f) or basal conditions (0 mM glucose), g induced GIP secretion and total GIP content (h) in duodenal PIEC of Control and CKO mice (n = 6 replicates per group). im In vitro 10 mM glucose (i) or 10 mM glucose supplemented with 10 μM Forskolin plus 10 μM IBMX (j), 50 μM α-LA (k) or basal conditions (0 mM glucose), l induced GLP-1 secretion and total GLP-1 content (m) in ileal PIEC of Control and CKO mice (n = 6 replicates per group). Values are means ± SEM. Statistical significance was assessed by Student’s t-test. **p < 0.01; ***p < 0.001; n.s. means not significant
Fig. 4
Fig. 4
Increased incretin secretion in KCNH2-deficient enteroendocrine cells after stimulation. a Immunofluorescence analysis depicted the localization of KCNH2 and GIP/ GLP-1 in STC-1 cells. The scale bar shows 20 μm. At least three replications of each experiment were conducted. b Transfection of the enteroendocrine cell line (STC-1 cells) with either 50 nM scramble siRNA (siRNA-NC) or siRNA against KCNH2 (siRNA-KCNH2) for 48 h, assessed by qPCR (siRNA-NC, n = 3; siRNA-KCNH2, n = 3). cg STC-1 cells were incubated in Krebs–Ringer bicarbonate buffer (KRBB) for 30 min, followed by the 10 mM glucose or 10 mM glucose supplemented with 10 μM Forskolin plus 10 μM IBMX (F/I) or 50 μM α-LA or 0 mM glucose (basal) KRBB for an additional 2 h. Glucose (c), F/I (d), α-LA (e), and basal conditions (f) induced GIP secretion and total GIP content (g) in siRNA-NC and siRNA-KCNH2 STC-1 cells (n = 4 replicates for each group). h, l Glucose (h), F/I (i), α-LA (j), and basal conditions (k) induced GLP-1 secretion and total GLP-1 content (l) in siRNA-NC and siRNA-KCNH2 STC-1 cells (n = 4 replicates for each group). Values are means ± SEM. Statistical significance was assessed by the Student’s t-test. *p < 0.05;**p < 0.01; n.s. means not significant
Fig. 5
Fig. 5
KCNH2 knockdown inhibits Kv currents, prolongs APD, and increases Ca2+ concentration in enteroendocrine cells. a Representative Kv currents of STC-1 cells treated with siRNA-NC or siRNA-KCNH2. The cells were held at a voltage of −70 mV for 2 s before being depolarized to 70 mV in steps of 10 mV. bd Summary of the steady-state current-voltage (I-V) curves for Kv currents (b) and mean Kv current densities at +40 mV (c) and +70 mV (d) in STC-1 cells (siRNA-NC, n = 19; siRNA-KCNH2, n = 17). e Representative action potentials captured in current-clamp mode from STC-1 cells treated with siRNA-NC or siRNA-KCNH2. fh Summary of action potential durations (f), amplitude (g), and resting membrane potential (h) in STC-1 cells (siRNA-NC, n = 15; siRNA-KCNH2, n = 15). i Intracellular calcium concentration was ascertained using 2 μM Fluo4-AM. For a total of 31 min, readings were obtained every 5 s, with 60 s recorded before and 30 min following stimulation with 10 mM glucose and 10 μM forskolin plus IBMX. The fluorescence change ratio (F/F0) was obtained for STC-1 cells treated with scramble siRNA and KCNH2 siRNA. The summary of area under curve (AUC) of STC-1 cells (siRNA-NC, n = 232; siRNA-KCNH2, n = 244). j, k STC-1 cells were incubated in Krebs–Ringer bicarbonate buffer (KRBB) or KRBB supplemented with 10 mM EGTA for 30 min, followed by the 10 mM glucose or 10 mM glucose supplemented with 10 mM EGTA or 0 mM glucose (basal) KRBB for an additional 2 h. GIP secretion (j) and GLP-1 secretion (k) in siRNA-NC and siRNA-KCNH2 STC-1 cells (n = 4 replicates for each group). Values are means ± SEM. Statistical significance was assessed by Student’s t-test. **p < 0.01; ***p < 0.001; n.s. means not significant
Fig. 6
Fig. 6
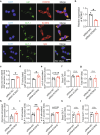
Dofetilide promotes incretin secretion in mice in vivo and in EECs in vitro. a Viability of STC-1 cells incubated with various concentrations of dofetilide for 2 h. (n = 3 replicates for each group). b, c The enteroendocrine cell line (STC-1 cells) were transfected for 48 h with either 50 nM scramble siRNA (siRNA-NC) or siRNA against KCNH2 (siRNA-KCNH2). STC-1 cells were incubated in Krebs–Ringer bicarbonate buffer (KRBB) for 30 min followed by 10 mM glucose KRBB plus vehicle or 10 mM glucose KRBB supplemented with 10 μM dofetilide for an additional 2 h. Glucose-induced GIP secretion (b) and GLP-1 secretion (c) (n = 6 replicates per group). d, e PIEC were cultured in KRBB for 30 min and then treated with 10 mM glucose KRBB plus vehicle or 10 mM glucose KRBB supplemented with 10 μM dofetilide for an additional 2 h. Glucose-induced GIP secretion (d) and GLP-1 secretion (e) (n = 6 replicates for each group). fi HFD-fed (started at week 8 for 6–8 weeks) C57BL/6J were orally administered 5 mg/kg dofetilide or vehicle before being loaded with 5 g/kg glucose for the OGTT. Blood glucose levels and AUC (f), serum GIP levels and AUC (g), serum GLP-1 levels and AUC (h), and serum insulin levels and AUC (i) (Vehicle, n = 6; Dofetilide, n = 6). The values are presented as means ± SEM. The statistical significance of differences between means was assessed by the Student’s t-test. *p < 0.05; **p < 0.01; n.s. means not significant
Fig. 7
Fig. 7
Proposed mechanisms by how dysfunction of KCNH2 channel enhances incretin secretion. In enteroendocrine cells, glucose enters the cell via the apical glucose transporter (SGLT1), which produces ATP, closes the KATP channel, depolarizing the cell membrane and allowing calcium influx, thereby prompting the release of incretin. In addition to this, we found a unique role for KCNH2 in incretin. (1) KCNH2 deficiency led to a reduction in Kv currents and prolonged repolarization in enteroendocrine cells. (2) Prolonged repolarization causes an increase in Ca2+ influx (3) Resulting in the accumulation of intracellular Ca2+. (4) Higher intracellular Ca2+ concentration triggers more incretin secretion. (5) KCNH2-specific inhibitor--dofetilide causes a rise in the intracellular calcium concentration by inhibiting KCNH2, thereby increasing incretin secretion. Therefore, KCNH2 has an important potential as a promising novel target for the treatment of obesity and diabetes

Similar articles

Cited by

References

    1. Baggio, L. L. & Drucker, D. J. Biology of incretins: GLP-1 and GIP. Gastroenterology132, 2131–2157, (2007). 10.1053/j.gastro.2007.03.054 - DOI - PubMed
    1. Ezcurra, M., Reimann, F., Gribble, F. M. & Emery, E. Molecular mechanisms of incretin hormone secretion. Curr. Opin. Pharmacol.13, 922–927, (2013). 10.1016/j.coph.2013.08.013 - DOI - PMC - PubMed
    1. Nauck, M. A. & Meier, J. J. The incretin effect in healthy individuals and those with type 2 diabetes: physiology, pathophysiology, and response to therapeutic interventions. Lancet Diabetes Endocrinol.4, 525–536, (2016). 10.1016/S2213-8587(15)00482-9 - DOI - PubMed
    1. Holst, J. J. The incretin system in healthy humans: the role of GIP and GLP-1. Metabolism96, 46–55 (2019). 10.1016/j.metabol.2019.04.014 - DOI - PubMed
    1. Bergmann, N. C. et al. Effects of combined GIP and GLP-1 infusion on energy intake, appetite and energy expenditure in overweight/obese individuals: a randomised, crossover study. Diabetologia62, 665–675 (2019). 10.1007/s00125-018-4810-0 - DOI - PubMed

Publication types

MeSH terms

LinkOut - more resources