. 2024 Aug 11;30(1):119.
doi: 10.1186/s10020-024-00892-x.

Targeting AGTPBP1 inhibits pancreatic cancer progression via regulating microtubules and ERK signaling pathway

Affiliations

Targeting AGTPBP1 inhibits pancreatic cancer progression via regulating microtubules and ERK signaling pathway

Ding-Zhong Li et al. Mol Med. .

Abstract

Background: AGTPBP1 is a cytosolic carboxypeptidase that cleaves poly-glutamic acids from the C terminus or side chains of α/β tubulins. Although its dysregulated expression has been linked to the development of non-small cell lung cancer, the specific roles and mechanisms of AGTPBP1 in pancreatic cancer (PC) have yet to be fully understood. In this study, we examined the role of AGTPBP1 on PC in vitro and in vivo.

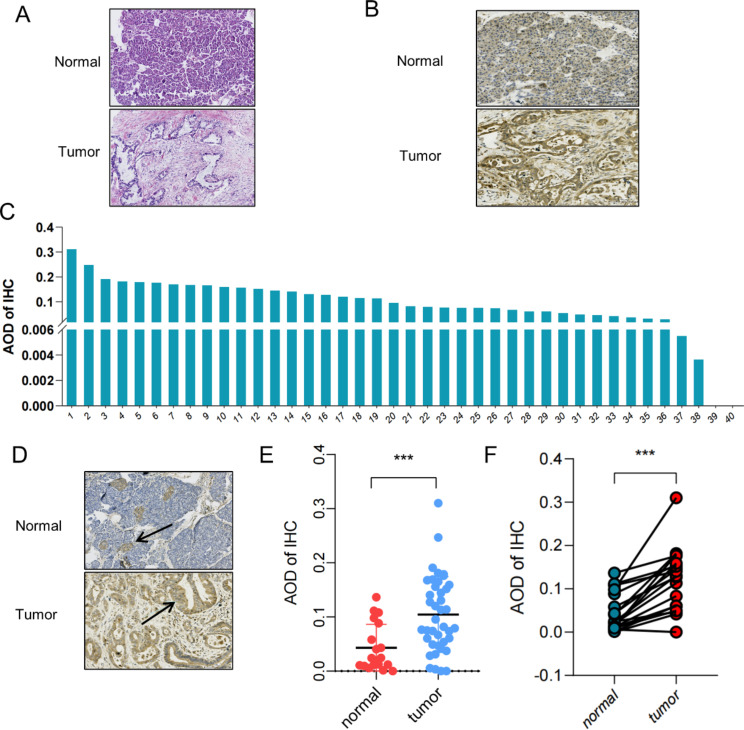
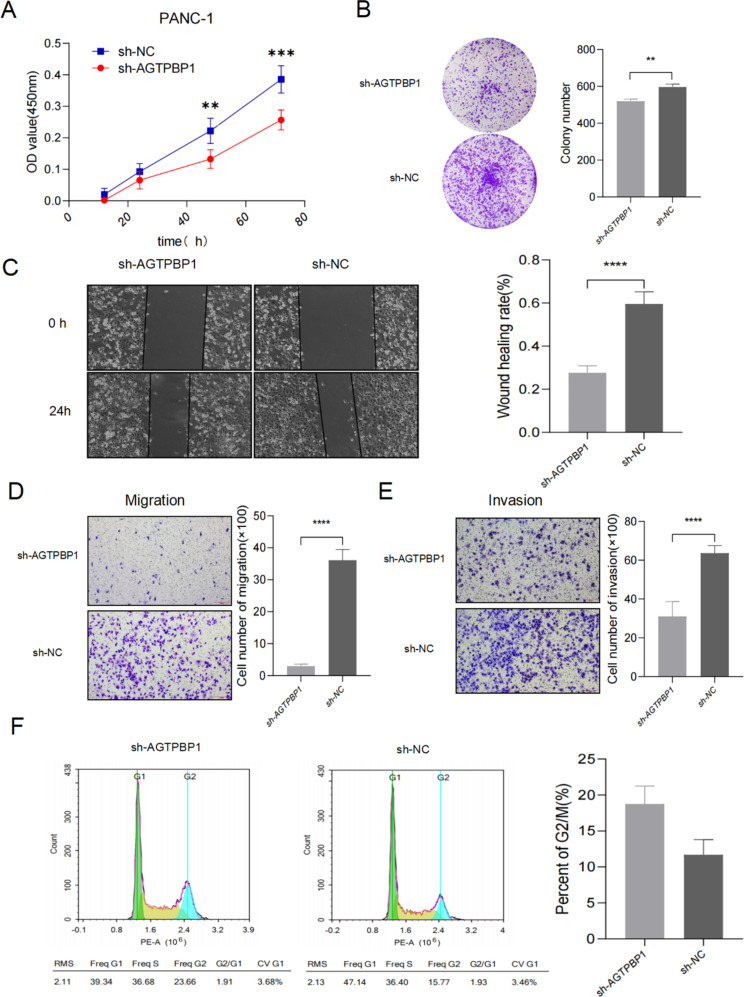
Methods: Immunohistochemistry was used to examine the expression of AGTPBP1 in PC and non-cancerous tissues. Additionally, we assessed the malignant behaviors of PC cells following siRNA-mediated AGTPBP1 knockdown both in vitro and in vivo. RNA sequencing and bioinformatics analysis were performed to identify the differentially expressed genes regulated by AGTPBP1.

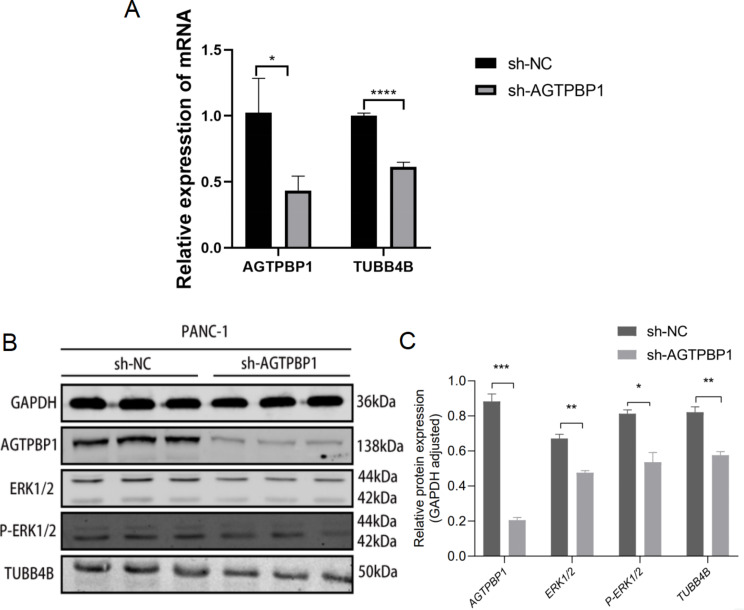
Results: We determined that AGTPBP1 was overexpressed in PC tissues and the higher expression of AGTPBP1 was closely related to the location of tumors. AGTPBP1 inhibition can significantly decrease cell progression in vivo and in vitro. Moreover, the knockdown of AGTPBP1 inhibited the expression of ERK1/2, P-ERK1/2, MYLK, and TUBB4B proteins via the ERK signaling pathway.

Conclusion: Our research indicates that AGTPBP1 may be a putative therapeutic target for PC.

Keywords: AGTPBP1; MAP1A; MYLK; PDAC; Tubulin.


Conflict of interest statement

The authors declare that they have no conflict of interest.

Figures

Fig. 1
Fig. 1
Expression of AGTPBP1 in PDAC tissues. A HE staining of cancer tissue and precancerous normal tissues of PDAC patients was conducted. Scale bar, 100 μm. B Immunohistochemical staining using anti-AGTPBP1 antibody showed higher expression in PDAC than normal pancreatic tissues. Scale bar, 100 μm. C The average optical density (AOD) of AGTPBP1 immunohistochemical staining in the cancer tissues of 40 PDAC patients was measured. D AGTPBP1 immunohistochemical staining showed that it was mainly expressed in pancreatic islets in normal pancreatic tissues, while it was mainly expressed in pancreatic ductal epithelial cells in PDAC tissues. Scale bar, 100 μm. E Expression of AGTPBP1 in 40 PDAC and 19 normal pancreatic tissues. F Expression of AGTPBP1 in 19 pairs of PDAC and normal pancreatic tissues. All data are presented as means ± SD. The Student’s t-test was used to compare the means between the two groups. ***P < 0.001 versus (vs.) normal group
Fig. 2
Fig. 2
Expression of AGTPBP1 in human pancreatic cancer cell lines and siRNA inhibition of AGTPBP1 expression in PANC-1 cells. A The expression of AGTPBP1 was up-regulated in PANC-1 and HPAF-II PC cells compared with normal control pancreatic endothelial cells by RT-qPCR. **P < 0.01, ****P < 0.0001 vs. HPDE6-C7. B-C The siRNA-1(targeting AGTPBP1-1050) and siRNA-2 (targeting AGTPBP1-2136) could inhibit AGTPBP1 expression. B The relative expression of AGTPBP1 by RT-qPCR. C Western blot analysis of AGTPBP1 expression. All data are presented as means ± SD. The Student’s t-test was used for statistical comparison. All experiments were performed in triplicate. **P < 0.0001, ****P < 0.01 vs. sh-NC
Fig. 3
Fig. 3
Knockdown of AGTPBP1 inhibits the malignant biological behaviors of pancreatic cancer cells in vitro A The proliferation experiments using CCK-8 cells showed that knocking out AGTPBP1 in PANC-1 cells could inhibit its proliferation ability (n = 5). B Plate clonalization experiments showed that knocking out AGTPBP1 significantly inhibited the formation of colonies of pancreatic cancer cells, counting the number of colonies containing more than 50 cells (n = 3). Scale bar, 200 μm. C Cell scratch healing experiments showed that knocking out AGTPBP1 significantly inhibited the migration ability of pancreatic cancer cells (n = 3). Scale bar, 200 μm. Transwell compartment migration and invasion experiments showed that knocking down AGTPBP1 could significantly reduce the migration (D) and invasion (E) ability of pancreatic cancer cells (n = 3). Scale bar, 200 μm. F After knocking out AGTPBP1 for pancreatic cancer cells, cells are blocked in the G2/M phase (n = 3). All results are representative of three independent experiments. Values are presented as mean ± SD. The Student’s t-test was used to compare the means between the two groups. **P<0.01,***P<0.001,****P<0.0001 vs. sh-NC
Fig. 4
Fig. 4
Knockdown of AGTPBP1 can inhibit the growth of xenograft tumors and the formation of new blood vessels in pancreatic cancer cells. A Comparative tumor manifestations and volume of subcutaneous tumorigenesis in the PANC-1 cell line AGTPBP1 KD group (n = 5) and the control group (n = 6). B-D Representative images from IHC staining of AGTPBP1 (B), Ki67 (C), and CD31 (D) expression in xenograft tumors. The positive signal was measured by ImageJ. Scale bar, 100 μm. Values are presented as mean ± SD. The Student’s t-test was used to compare the means between the two groups. *(P < 0.05), **P<0.01 vs. sh-NC
Fig. 5
Fig. 5
The differentially expressed genes in the AGTPBP1 KD cells compared to control cells through RNA-seq and bioinformatic analysis.A A volcano map of differentially expressed genes in the AGTPBP1 knockdown and control groups (n = 3/group). Red dots indicate upregulated genes and blue dots indicate downregulated genes. B The heat map with significant expression differences between the AGTPBP1 knockdown group and the control group (n = 3/group). Red: up-regulated DEGs; blue: down-regulated DEGs. The redder the color, the higher the expression, and the greener, the lower the expression. C GO enrichment analysis of significantly differentially expressed genes in the AGTPBP1 knockdown group and the control group cells (n = 3/group). D Bubble plot of KEGG enrichment analysis of significantly differentially expressed genes in the AGTPBP1 knockdown and control groups (n = 3/group). The size of the dot represents the number of genes annotated, and the color from green to red represents the degree of enrichment. formula image is considered significantly different.
Fig. 6
Fig. 6
Expression of MYLK and MAP1A in PC and AGTPBP1 KD cells.A-B MYLK (A) and MAP1A (B) were up-regulated in pancreatic cancers based on GEPIA analysis. PAAD, pancreatic ductal adenocarcinoma; T, tumor; N, normal. C-D Both MYLK (C) and MAP1A (D) were down-regulated after AGTPBP1 knockdown in PANC-1 PC cells by RT-qPCR analysis. n = 3. E-F Positive correlations between the expression of AGTPBP1 and MYLK, AGTPBP1 and MAP1A in PDAC samples were observed by GEPIA analysis. Spearman correlation was used to measure the degree of association between two genes. Values are presented as mean ± SD. The Student’s t-test was used to compare the means between the two groups. *P<0.05, **P<0.01, ****P<0.0001 vs. sh-NC
Fig. 7
Fig. 7
The expression of TUBB4B, ERK1/2, and p-ERK1/2 was down-regulated in PANC-1 cells after AGTPBP1 knockdown. A mRNA level of TUBB4B in AGTPBP1 KD PANC-1 and control cells was detected by RT-qPCR. GAPDH was an internal control. n = 3. B Protein level of AGTPBP1, TUBB4B, ERK1/2, and p-ERK1/2 in AGTPBP1 KD PANC-1 and control cells was detected by western blot. GAPDH was an internal control. n = 3. C The gray density of the immunoblot was estimated and normalized with GAPDH to demonstrate the relative expression level of proteins in B. As a result, the knockdown of AGTPBP1 in PANC-1 cells significantly inhibited the expression of TUBB4B, ERK1/2, and p-ERK1/2. Values are presented as mean ± SD. The Student’s t-test was used to compare the means between the two groups. *P<0.05 , **P<0.01 ,*** P<0.001, **** P<0.0001 vs. sh-NC

References

    1. Albahde M, Abdrakhimov B, LI GQ, et al. The role of microtubules in Pancreatic Cancer: therapeutic Progress[J]. Front Oncol. 2021;11:640863. 10.3389/fonc.2021.640863 - DOI - PMC - PubMed
    1. Berezniuk I, VU H T Lyons P J, et al. Cytosolic carboxypeptidase 1 is involved in processing α- and β-tubulin[J]. J Biol Chem. 2012;287(9):6503–17. 10.1074/jbc.M111.309138 - DOI - PMC - PubMed
    1. Cassimeris LU, Walker RA, Pryer NK, Salmon ED. Dynamic instability of microtubules. BioEssays. 1987;7:149–54. 10.1002/bies.950070403 - DOI - PubMed
    1. de la Rodríguez M, Lorenzo J, Tort O, Avilés FX, Bautista JM. Functional segregation and emerging role of cilia-related cytosolic carboxypeptidases (CCPs). FASEB J. 2013;27:424–31. 10.1096/fj.12-209080. 10.1096/fj.12-209080 - DOI - PubMed
    1. Desai A, Mitchison TJ. Microtubule polymerization dynamics. Annu Rev Cell Dev Biol. 1997;13:83–117. 10.1146/annurev.cellbio.13.1.83 - DOI - PubMed

MeSH terms

Substances

LinkOut - more resources