. 2024 Dec 4;120(15):1907-1923.
doi: 10.1093/cvr/cvae169.

PITX2 deficiency leads to atrial mitochondrial dysfunction

Affiliations

PITX2 deficiency leads to atrial mitochondrial dysfunction

Jasmeet S Reyat et al. Cardiovasc Res. .

Abstract

Aims: Reduced left atrial PITX2 is associated with atrial cardiomyopathy and atrial fibrillation (AF). PITX2 is restricted to left atrial cardiomyocytes (aCMs) in the adult heart. The links between PITX2 deficiency, atrial cardiomyopathy, and AF are not fully understood.

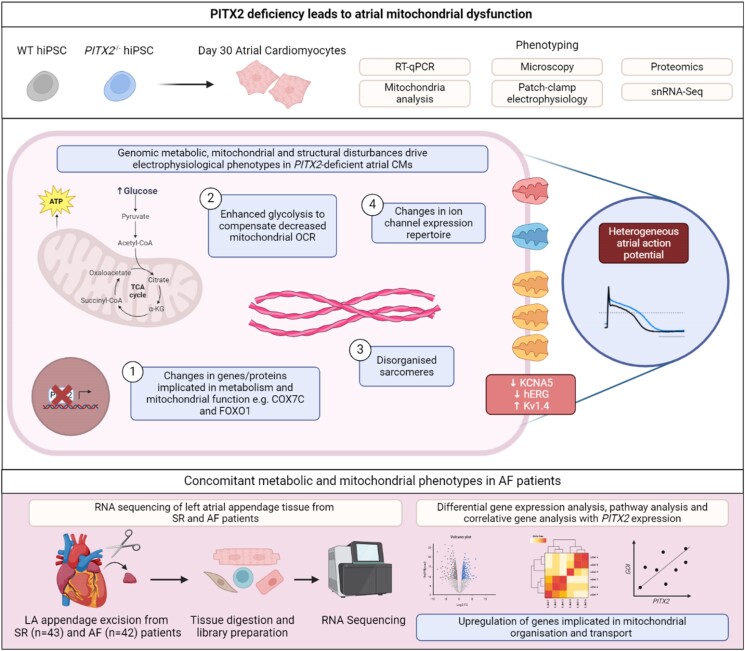
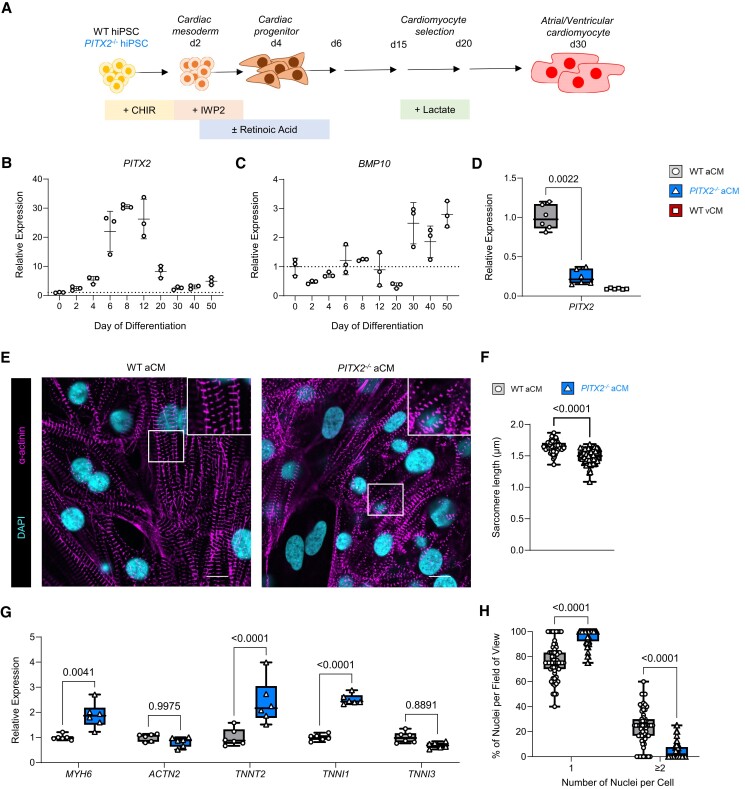
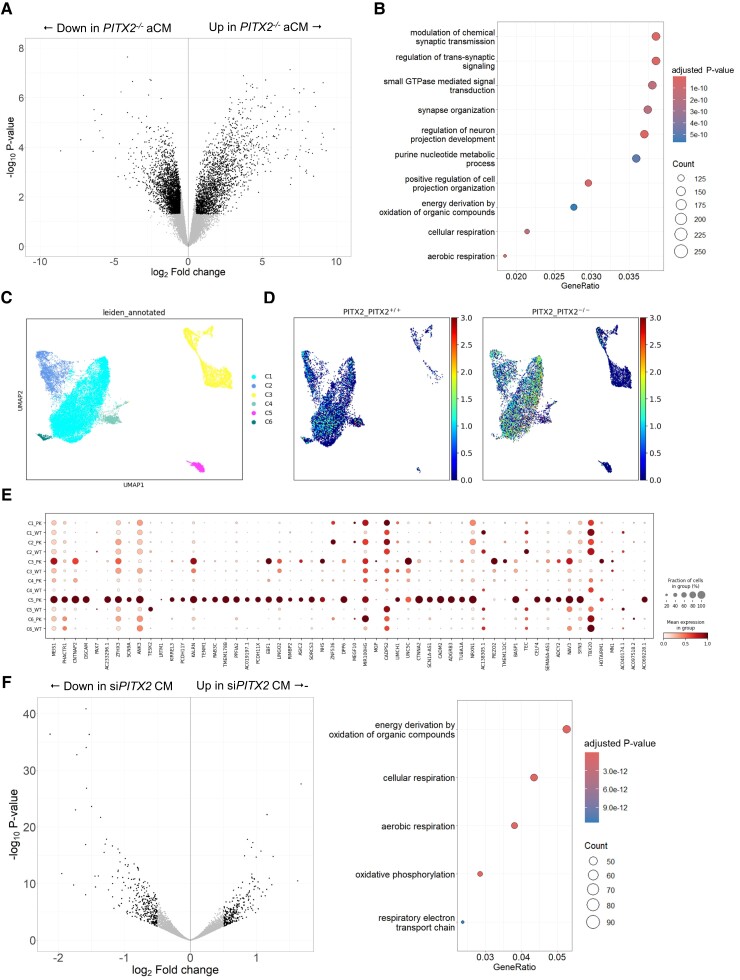
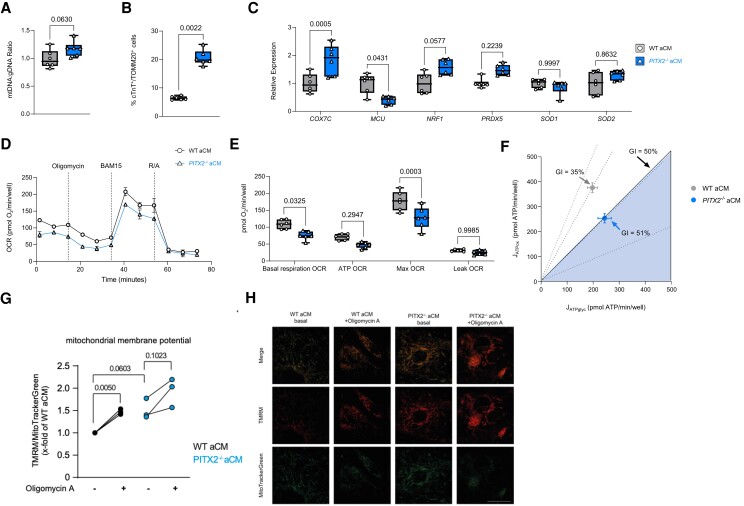
Methods and results: To identify mechanisms linking PITX2 deficiency to AF, we generated and characterized PITX2-deficient human aCMs derived from human induced pluripotent stem cells (hiPSC) and their controls. PITX2-deficient hiPSC-derived atrial cardiomyocytes showed shorter and disorganized sarcomeres and increased mononucleation. Electron microscopy found an increased number of smaller mitochondria compared with isogenic controls. Mitochondrial protein expression was altered in PITX2-deficient hiPSC-derived atrial cardiomyocytes. Single-nuclear RNA-sequencing found differences in cellular respiration pathways and differentially expressed mitochondrial and ion channel genes in PITX2-deficient hiPSC-derived atrial cardiomyocytes. PITX2 repression in hiPSC-derived atrial cardiomyocytes replicated dysregulation of cellular respiration. Mitochondrial respiration was shifted to increased glycolysis in PITX2-deficient hiPSC-derived atrial cardiomyocytes. PITX2-deficient human hiPSC-derived atrial cardiomyocytes showed higher spontaneous beating rates. Action potential duration was more variable with an overall prolongation of early repolarization, consistent with metabolic defects. Gene expression analyses confirmed changes in mitochondrial genes in left atria from 42 patients with AF compared with 43 patients with sinus rhythm. Dysregulation of left atrial mitochondrial (COX7C) and metabolic (FOXO1) genes was associated with PITX2 expression in human left atria.

Conclusion: PITX2 deficiency causes atrial mitochondrial dysfunction and a metabolic shift to glycolysis in human aCMs. PITX2-dependent metabolic changes can contribute to the structural and functional defects found in PITX2-deficient atria.

Keywords: PITX2; Atrial fibrillation; Human heart tissue; Human induced pluripotent stem cells; Metabolic shift; Mitochondrial dysfunction.


Conflict of interest statement

Conflict of interest: L.F. has received institutional research grants and non-financial support from European Union, British Heart Foundation, Medical Research Council (U.K.), DFG, German Centre for Heart Research DZHK and several biomedical companies. P.K. has received additional support for research from the European Union, British Heart Foundation, Foundation Leducq, Medical Research Council (U.K.), and German Centre for Cardiovascular Research, from several drug and device companies active in AF, Honoria from several such companies, but not in the last three years. P.K. and L.F. are listed as inventors on two patents held by University of Birmingham (AFTherapy WO 2015140571, Markers for AF WO 2016021783). U.S. has received consultancy fees or honoraria from Università della Svizzera Italiana (USI, Switzerland), Roche Diagnostics (Switzerland), EP Solutions Inc. (Switzerland), Johnson & Johnson Medical Limited, (U.K.), Bayer Healthcare (Germany). U.S. is co-founder and shareholder of YourRhythmics BV, a spin-off company of the University Maastricht. K.G. has received additional support for research from the British Heart Foundation, Medical Research Council (U.K.), and Rocket Pharmaceuticals Inc. All other authors declare they have no competing interests.

Figures

Graphical Abstract
Graphical Abstract
Deficiency in PITX2, a gene with left atrial and skeletal muscle expression in adults leads to mitochondrial dysfunction. PITX2 deficiency is likely to underlie the genomic basis for atrial fibrillation (AF). Reduced PITX2 in atrial cardiomyocytes (aCMs) conveys electrical changes and structural alterations. The cellular mechanisms linking PITX2 deficiency to AF are not fully understood. PITX2 deficiency increases cellular and functional heterogeneity in human iPSC-derived aCMs. These experiments show that PITX2 alters mitochondrial function and metabolism by altering gene and protein expression in aCMs, creating a metabolic shift away from respiration towards glycolysis. Left atrial tissue from patients with AF shows similar changes in gene expression patterns of mitochondrial genes and their association with PITX2. Figure was generated using BioRender.com.
Figure 1
Figure 1
Characterization of WT and PITX2−/− hiPSC-derived atrial cardiomyocytes (aCMs). (A) Schematic overview of differentiation protocol used to generate hiPSC-derived aCMs. (B) Gene expression analysis of PITX2 and (C) BMP10 over the time course of atrial cardiomyocyte differentiation using WT hiPSC-derived aCMs (WT aCMs) as assessed by RT-qPCR (n = 3). Dashed line represents the basal expression of PITX2 or BMP10 in WT hiPSCs. (D) Gene expression of PITX2 in day 30 aCMs from WT and PITX2−/ (PITX2−/− aCMs) lines as assessed by RT-qPCR. Day 30 hiPSC-derived ventricular cardiomyocytes from the WT line (WT vCMs) were used as a control (n = 6). (E) Confocal microscopy of immunofluorescently labelled α-actinin in WT and PITX2−/− aCMs. Scale bar = 10 µm. (F) Sarcomere length measurements in WT and PITX2−/− aCMs (WT aCMs = 63 images; PITX2−/− aCMs = 62 images). (G) Gene expression of MYH6, ACTN2, TNNT2, TNNI1 and TNNI3 in WT and PITX2−/− aCMs as assessed by RT-qPCR (n = 6). Data are expressed as the mean relative expression and presented as box and whisker plots (min to max). Mann–Whitney U tests were used to compare gene concentrations between groups. (H) Bi-nucleated and mono-nucleated cell analysis in WT and PITX2−/− aCMs.
Figure 2
Figure 2
Proteomic analysis of PITX2−/−­ hiPSC-derived atrial cardiomyocytes (aCMs). (A) Principal component analysis (PCA) of samples used in proteomic analysis. (B) Volcano plot showing protein enriched in WT aCMs vs. PITX2−/− aCMs. Significantly enriched proteins (log2FC > 1) are shown in black. (C) Differentially expressed mitochondrial proteins in WT aCMs and PITX2−/− aCMs presented as a heatmap. (D) Gene-set enrichment analysis of enriched and down-regulated pathways in WT aCMs and PITX2−/− aCMs. Proteins with an FDR < 0.05 and an absolute log2-fold-change > 1 were considered significantly changed. Further information on data analysis can be found in the Supplementary materials. (E, F) Expression of proteins linked to mitochondrial fission and fusion (E) and related to mitochondrial biogenesis and mitophagy (F) in WT and PITX2−/− aCMs (n = 6).
Figure 3
Figure 3
Transcriptional changes in PITX2-deficient hiPSC-derived atrial cardiomyocytes (aCM). (A) Volcano plot of differentially expressed genes in ‘pseudo-bulk’ mRNA sequencing analysis of nuclei from PITX2−/− and WT control hiPSC-derived atrial cardiomyocytes. (B) Gene ontology analysis of the bulk RNA-sequencing data. (C) Leiden plot of single-nuclei RNA-sequencing identifies six clusters of cells, including one cluster containing mainly PITX2−/− cells. (D) Differential gene expression patterns in the single-nuclear RNA-sequencing data sets of WT (PITX2+/+) and PITX2−/− aCM depicted by cell cluster (Leiden plot). (E) List of 56 most differentially expressed genes in PITX2−/− hiPSC-derived atrial cardiomyocytes (PK) vs. WT based on the single-nuclear RNA-sequencing analysis. (F) Gene expression differences in a published data set of hiPSC-derived cardiomyocytes exposed to PITX2-small interfering RNA (siRNA) or scrambled control siRNA. Left panel: Volcano plot. Right panel: Gene ontology analysis of differentially expressed genes.
Figure 4
Figure 4
Glycolytic metabolism in PITX2−/− hiPSC-derived atrial cardiomyocytes (aCMs). (A) Electron microscopy revealed no overt morphological differences between genotypes. Mitochondria appeared elongated and structured in WT aCMs, while they were smaller with in part fractured outer membranes in PITX2−/− aCMs. G: golgi; L: lipid droplet; M: mitochondria; scale bar 500 nm. (B) Gene expression of FOXO1, PFKM, PPARAGC1a, PYGM and SCL2A1 in WT and PITX2−/− aCMs (n = 6) as assessed by qRT-PCR. Data are expressed as the mean relative expression and presented as box and whisker plots (min to max). (C) Measurement of glycolysis (glycoPER) as assessed by Seahorse measurements (n = 6). Traces shown are PER corrected after subtracting non-glycolytic acidification from the rates post 2-DE addition and mitochondrial acidification contributions., For representation purposes, oligomycin A and BAM addition have been removed from the trace as these are not relevant to the glycolytic measurements reported. (D) Quantification of basal glycolysis (glycoPER) and maximal glycolysis (Max glycoPER). (E) Gene expression of ADIPOR2, CD36, LPIN1, PPARA, SLC27A1 and SLC27A6 in WT and PITX2−/− aCMs (n = 6) as assessed by qRT-PCR. Data are expressed as the mean relative values and presented as box and whisker plots (min to max). Statistical analyses were carried out using Mann–Whitney U tests to compare between two groups.
Figure 5
Figure 5
Mitochondrial respiration in PITX2−/− hiPSC-derived atrial cardiomyocytes (aCMs). (A) Mitochondrial (ND1) to nuclear DNA (B2M) ratio as assessed by RT-qPCR (n = 6). (B) Flow cytometry analysis of mitochondrial membrane content in WT and PITX2−/− aCMs using TOMM20 staining (n = 6). (C) Gene expression of COX7C, MCU, NRF1, PRDX5, SOD1 and SOD2 in WT and PITX2−/− aCMs (n = 6) as assessed by RT-qPCR. (D) Traces showing oxygen consumption rates (OCR) in WT and PITX2−/− aCMs (n = 6). (E) Quantification of OCRs shown in (D). (F) Quantification of JATP from either oxidative phosphorylation or glycolytic sources. Data are expressed as glycolytic indexes (GI) showing absolute values of ATP supply. (G) aCMs were loaded with the mitochondrial membrane-sensitive dye tetramethylrhodamine methyl ester (TMRM) and MitoTrackerGreen as a mitochondrial-selective loading control. Subsequently, aCMs were exposed to oligomycin A (2 µM for 10 min). Alterations in mitochondrial membrane potential of PITX2−/− aCMs (blue) or the isogenic control cells (wild-type WT; black) at baseline (−) or in response to oligomycin A (+) were expressed as the ratio of TMRM/MitoTrackerGreen fluorescence as fold change of the WT. The graph represents the data summarized from three independent experiments of at least 20 images per experiment from three independent aCM differentiation runs. One-way ANOVA with Sidak post-test for multiple comparisons was performed. (H) Exemplary fluorescence images used to generate the mitochondrial potential data shown in Figure 5G. Scale bar indicates 25 µm.
Figure 6
Figure 6
Electrophysiological characterization of PITX2−/− hiPSC-derived atrial cardiomyocytes (aCMs). (A) Spontaneous beating rate in WT and PITX2−/− aCMs (WT n = 43, PITX2−/− n = 87). (B) Gene expression of NKX2-5, NPPA, SHOX2, and TBX3 in WT and PITX2−/− aCMs (n = 6) as assessed by RT-qPCR. (C) Combined APs from 1, 2, and 3 Hz WT and PITX2−/− aCMs following unsupervised clustering categorized into three distinct clusters. Computationally modelled APs are shown (top) with the percentage of APs representative of those traces in WT and PITX2−/− aCMs quantified (below). (D) Representative action potential (AP) traces of spontaneously beating or 1 Hz paced WT aCMs and PITX2−/− aCMs using whole-cell patch-clamp (top). Quantification of action potential duration (APD) at APD30, 50, 70 and 90 in spontaneously beating or 1 Hz paced WT and PITX2−/− aCMs (spontaneously beating WT n = 43, PITX2−/−n = 87; 1 Hz WT n = 82, PITX2−/−n = 112 over five batches of independently differentiated cells: below). (E) Action potential amplitude (APA) in 1 Hz paced WT or PITX2−/− aCMs (1 Hz—WT n = 82, PITX2−/− n = 112). Diastolic potential and peak upstroke velocity (dV/dtmax) in spontaneously beating (F) and 1 Hz paced (G) WT or PITX2−/− aCMs (spontaneously beating—WT n = 43, PITX2−/− n = 87; 1 Hz—WT n = 82, PITX2−/− n = 112). Note that only some cells showed spontaneous beating, resulting in different diastolic potential values than in paced cells. (H) Gene expression of KCNA5, KCNA4, KCNJ12 and KCNH2 in WT and PITX2−/− aCMs (n = 6) as assessed by RT-qPCR. (I) Western blot analysis of KCNA5, Kv1.4, Kir2.2 and hERG in WT and PITX2−/− aCMs (n = 4). Western blots are shown on top with quantification below. GAPDH was used as a loading control. Data are expressed as the mean relative expression and presented as box and whisker plots (min to max). For electrophysiological analysis, statistics were carried out using a repeated measures ANOVA to compare differences in electrophysiological parameters. For gene and protein analysis, Mann–Whitney U tests were used to compare between two groups.
Figure 7
Figure 7
Bulk RNA-sequencing of left atrial appendage tissue from AF and SR patients. Left atrial tissue was collected during open-heart surgery from patients without known AF and in sinus rhythm (SR) during the operation (‘SR’) and from patients with permanent AF including during surgery. (A) Volcano plot showing genes in patients with AF (permanent AF) vs. those in SR at the time of tissue harvest. Significantly enriched genes [false discovery rate (FDR) < 0.05] in AF patients (blue) and significantly enriched genes in SR patients (grey) are shown. (B) Differentially expressed genes in individual samples of patients in SR and AF. Selected genes represent the top 10 enriched genes in either SR patients (top) or AF patients (bottom). (C) Expression of COX7A1 and SLC25A4 in sinus rhythm (SR) and permanent AF patients’ atrial tissue (Sinus rhythm n = 42; AF n = 43). Correlation analysis of PITX2-regulated genes in patients with chronic (permanent) AF implicated in (D) metabolism (SLC27A6, FOXO1, and PYGM), (E) mitochondrial function (COX7C, MCU, and NRF1) and (F) cardiomyocyte structure (MYH6, TNNT2, and TNNI1). Data represent n = 43 with Spearman r values and corrected P-values shown on graph.

References

    1. Hindricks G, Potpara T, Dagres N, Arbelo E, Bax JJ, Blomstrom-Lundqvist C, Boriani G, Castella M, Dan GA, Dilaveris PE, Fauchier L, Filippatos G, Kalman JM, La Meir M, Lane DA, Lebeau JP, Lettino M, Lip GYH, Pinto FJ, Thomas GN, Valgimigli M, Van Gelder IC, Van Putte BP, Watkins CL; ESC Scientific Document Group . 2020 ESC guidelines for the diagnosis and management of atrial fibrillation developed in collaboration with the European Association for Cardio-Thoracic Surgery (EACTS): the task force for the diagnosis and management of atrial fibrillation of the European Society of Cardiology (ESC) developed with the special contribution of the European Heart Rhythm Association (EHRA) of the ESC. Eur Heart J 2021;42:373–498. - PubMed
    1. Kirchhof P. The future of atrial fibrillation management: integrated care and stratified therapy. Lancet 2017;390:1873–1887. - PubMed
    1. Linz D, Andrade JG, Arbelo E, Boriani G, Breithardt G, Camm AJ, Caso V, Nielsen JC, De Melis M, De Potter T, Dichtl W, Diederichsen SZ, Dobrev D, Doll N, Duncker D, Dworatzek E, Eckardt L, Eisert C, Fabritz L, Farkowski M, Filgueiras-Rama D, Goette A, Guasch E, Hack G, Hatem S, Haeusler KG, Healey JS, Heidbuechel H, Hijazi Z, Hofmeister LH, Hove-Madsen L, Huebner T, Kaab S, Kotecha D, Malaczynska-Rajpold K, Merino JL, Metzner A, Mont L, Ng GA, Oeff M, Parwani AS, Puererfellner H, Ravens U, Rienstra M, Sanders P, Scherr D, Schnabel R, Schotten U, Sohns C, Steinbeck G, Steven D, Toennis T, Tzeis S, van Gelder IC, van Leerdam RH, Vernooy K, Wadhwa M, Wakili R, Willems S, Witt H, Zeemering S, Kirchhof P. Longer and better lives for patients with atrial fibrillation: the 9th AFNET/EHRA consensus conference. Europace 2024;26:euae070. - PMC - PubMed
    1. Schnabel RB, Marinelli EA, Arbelo E, Boriani G, Boveda S, Buckley CM, Camm AJ, Casadei B, Chua W, Dagres N, de Melis M, Desteghe L, Diederichsen SZ, Duncker D, Eckardt L, Eisert C, Engler D, Fabritz L, Freedman B, Gillet L, Goette A, Guasch E, Svendsen JH, Hatem SN, Haeusler KG, Healey JS, Heidbuchel H, Hindricks G, Hobbs FDR, Hubner T, Kotecha D, Krekler M, Leclercq C, Lewalter T, Lin H, Linz D, Lip GYH, Lochen ML, Lucassen W, Malaczynska-Rajpold K, Massberg S, Merino JL, Meyer R, Mont L, Myers MC, Neubeck L, Niiranen T, Oeff M, Oldgren J, Potpara TS, Psaroudakis G, Purerfellner H, Ravens U, Rienstra M, Rivard L, Scherr D, Schotten U, Shah D, Sinner MF, Smolnik R, Steinbeck G, Steven D, Svennberg E, Thomas D, True Hills M, van Gelder IC, Vardar B, Pala E, Wakili R, Wegscheider K, Wieloch M, Willems S, Witt H, Ziegler A, Daniel Zink M, Kirchhof P. Early diagnosis and better rhythm management to improve outcomes in patients with atrial fibrillation: the 8th AFNET/EHRA consensus conference. Europace 2023;25:6–27. - PMC - PubMed
    1. Gudbjartsson DF, Arnar DO, Helgadottir A, Gretarsdottir S, Holm H, Sigurdsson A, Jonasdottir A, Baker A, Thorleifsson G, Kristjansson K, Palsson A, Blondal T, Sulem P, Backman VM, Hardarson GA, Palsdottir E, Helgason A, Sigurjonsdottir R, Sverrisson JT, Kostulas K, Ng MC, Baum L, So WY, Wong KS, Chan JC, Furie KL, Greenberg SM, Sale M, Kelly P, MacRae CA, Smith EE, Rosand J, Hillert J, Ma RC, Ellinor PT, Thorgeirsson G, Gulcher JR, Kong A, Thorsteinsdottir U, Stefansson K. Variants conferring risk of atrial fibrillation on chromosome 4q25. Nature 2007;448:353–357. - PubMed

Publication types

MeSH terms