. 2024 Sep;55(9):2340-2352.
doi: 10.1161/STROKEAHA.123.045248. Epub 2024 Aug 12.

Loss of TGFβ-Mediated Repression of Angiopoietin-2 in Pericytes Underlies Germinal Matrix Hemorrhage Pathogenesis

Affiliations

Loss of TGFβ-Mediated Repression of Angiopoietin-2 in Pericytes Underlies Germinal Matrix Hemorrhage Pathogenesis

Jui M Dave et al. Stroke. 2024 Sep.

Abstract

Background: TGF (transforming growth factor)-β pathway is central to blood-brain barrier development as it regulates cross talk between pericytes and endothelial cells. Murine embryos lacking TGFβ receptor Alk5 (activin receptor-like kinase 5) in brain pericytes (mutants) display endothelial cell hyperproliferation, abnormal vessel morphology, and gross germinal matrix hemorrhage-intraventricular hemorrhage (GMH-IVH), leading to perinatal lethality. Mechanisms underlying how ALK5 signaling in pericytes noncell autonomously regulates endothelial cell behavior remain elusive.

Methods: Transcriptomic analysis of human brain pericytes with ALK5 silencing identified differential gene expression. Brain vascular cells isolated from mutant embryonic mice with GMH-IVH and preterm human IVH brain samples were utilized for target validation. Finally, pharmacological and genetic inhibition was used to study the therapeutic effects on GMH-IVH pathology.

Results: Herein, we establish that the TGFβ/ALK5 pathway robustly represses ANGPT2 (angiopoietin-2) in pericytes via epigenetic remodeling. TGFβ-driven SMAD (suppressor of mothers against decapentaplegic) 3/4 associates with TGIF1 (TGFβ-induced factor homeobox 1) and HDAC (histone deacetylase) 5 to form a corepressor complex at the Angpt2 promoter, resulting in promoter deacetylation and gene repression. Moreover, murine and human germinal matrix vessels display increased ANGPT2 expression during GMH-IVH. Isolation of vascular cells from murine germinal matrix identifies pericytes as a cellular source of excessive ANGPT2. In addition, mutant endothelial cells exhibit higher phosphorylated TIE2 (tyrosine protein kinase receptor). Pharmacological or genetic inhibition of ANGPT2 in mutants improves germinal matrix vessel morphology and attenuates GMH pathogenesis. Importantly, genetic ablation of Angpt2 in mutant pericytes prevents perinatal lethality, prolonging survival.

Conclusions: This study demonstrates that TGFβ-mediated ANGPT2 repression in pericytes is critical for maintaining blood-brain barrier integrity and identifies pericyte-derived ANGPT2 as an important pathological target for GMH-IVH.

Keywords: angiogenesis; angiopoietin-2; blood-brain barrier; endothelial cells; epigenomics; intrancranial hemorrhages; pericytes.


Conflict of interest statement

Dr Ballabh reports employment by Albert Einstein College of Medicine and Yeshiva University. Dr Martin reports grants from the National Institutes of Health Office of Director. The other authors report no conflicts.

Figures
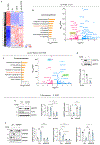
Figure 1.
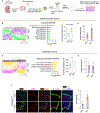
Figure 1.. ANGPT2 is repressed by TGFβ signaling pathway in human brain PCs.
PCs were transfected with scrambled (Scr) or siRNA specific to ALK5 (siALK5) and then treated with or without TGFβ. RNA was isolated from each treatment group and utilized for bulk RNA seq (n=4 per group). (A) Heat map of the differentially expressed genes. (B) Canonical pathway enrichment analysis related to differential gene expression from Scr+TGFβ vs. Scr and corresponding volcano plot shown on right. (C) Canonical pathway enrichment analysis for siALK5+TGFβ vs. Scr+TGFβ and corresponding volcano plot shown on right. (D-F) Non-transfected PCs (D) or PCs transfected with Scr or siALK5 (E) and Scr or siSMAD3 (F) were treated with or without TGFβ, and protein lysates were analyzed. Western blots probed for ANGPT2 and GAPDH along with ALK5 (E) and pSMAD3, SMAD3 (F). Histograms depict densitometric analysis of indicated proteins relative to GAPDH and normalized to untreated group (D, n=4) or to untreated Scr group (E, F, n=3). Student’s t-test (D) and one-way ANOVA. with Tukey’s multiple comparison test (E, F); *P<0.05, **P<0.01 ***P<0.001 and ****P<0.0001.
Figure 2.
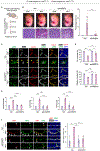
Figure 2.. HDAC5 interacts with SMAD3 to repress ANGPT2 by reducing histone acetylation.
(A, B, E) Genomic DNA was isolated from non-transfected PCs (A, B, E) or PCs transfected with Scr or siSMAD3 (B, right) in presence or absence of TGFβ and chromatin immunoprecipitation (ChIP) was performed with antibodies directed against RNA Pol II (A) or H3K27Ac (B) or HDAC5 (E) along with IgG control. qPCR was then conducted with primers specific for a region upstream of the ANGPT2 transcription start site. Graphs show qPCR results calculated by the percentage input method and normalized to untreated control (n=4-6). (C) PCs were transfected with Scr or HDAC-specific siRNA as indicated, and lysates were analyzed. Histogram shows ANGPT2 transcript levels relative to 18S rRNA as assessed by qRT-PCR and normalized to Scr (n=3-4). (D) Immunoprecipitations were performed on lysates of PCs, pretreated with or without TGFβ, using monoclonal anti-HDAC5 antibody or IgG control. Inputs and immunoprecipitated lysates were probed for SMAD3 and HDAC5 by Western blotting. Densitometric analyses of SMAD3 relative to input (n=3). (F) Scr or siHDAC5 transfected PCs were treated with or without TGFβ. Protein lysates were analyzed by Western blotting for HDAC5, ANGPT2 and GAPDH. Densitometric analysis of indicated proteins relative to GAPDH and normalized to untreated Scr group are shown (n=3). Student’s t-test (C, D) or one-way ANOVA with Tukey’s multiple comparison test (A, B, E, F) was used; *P<0.05, **P<0.01 ***P<0.001 and ****P<0.0001.
Figure 3.
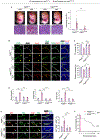
Figure 3.. ANGPT2 is upregulated in GM vessels of mutant mice and human preterm neonates with IVH.
(A) Representative brightfield images of whole embryos of Pdgfrb-Cre, Alk5(flox/+) control and Pdgfrb-Cre, Alk5(flox/flox) mutant mice at E13.5 (black arrow indicates hemorrhage) are shown. H&E-stained coronal brain sections on right demonstrate GMH (black arrowheads) in mutants. GM, germinal matrix; +, ventricle. Close-up of GM regions (boxed) shown below. (B) Brain lysates from mice in (A) were analyzed by Western blotting for ANGPT2 and GAPDH. Quantification of ANGPT2 protein relative to GAPDH and normalized to control shown on right (n=3 mice per group). (C) GM vessels from controls and mutants also bearing ROSA26R(Zs/+) are stained for ANGPT2 (yellow arrowheads) and CDH5 (EC). Zs green channel displays PCs. Quantification of ANGPT2 staining intensity on CDH5+ Zs+ vessels depicted on right. At least 50 blood vessels quantified per mouse (n=3 mice per condition). (D) Immunohistochemistry of GM vessels from coronal sections taken through the dorsal telencephalon of human premature infants (27 gestation week, autopsy samples) with and without IVH. Brain sections were co-stained with ANGPT2 (yellow arrowheads) and either NG2 (left) or CD31 (center). Quantification of ANGPT2 staining intensity on CD31+ vessels shown on right. 164 and 188 blood vessels were quantified in groups with or without IVH, respectively (n=5 patients per group). Student’s t-test, *P<0.05, **P<0.01 and ****P<0.0001. Scale bars, 1 mm (A, left), 200 μm (A, right), 10 μm (C) and 20 μm (D).
Figure 4.
Figure 4.. In mutants, isolated mural cells display higher ANGPT2 levels and GM vessels exhibit increased TIE2 activation.
(A) Schematic of experimental design. Control and mutant embryos also bearing ROSA26R(Zs/+) were harvested at E13.5, and embryonic heads were dissected as indicated. After tissue digestion, single cell suspensions were stained with anti-CD31 antibody and subjected to FACS. Total RNA from sorted Zs+ (i.e., PDGFR-β+) mural cells and CD31+ ECs was utilized for bulk RNA-seq analysis. (B, D) Heat map of filtered genes in isolated mural cells (B) or ECs (D) from controls vs. mutants (n=3-5 mice per group). In (B), top canonical pathways associated with mutant mural cells and in (D), top molecular and cellular functions perturbed in mutant ECs are shown. Normalized ANGPT2 counts from isolated mural cells (P =9.17 x 10⁻⁶) or ECs (ns, not significant) are displayed on far right, respectively. (C, E) RNA from isolated mural cells (C) or ECs (E) was subjected to qRT-PCR. Angpt2 mRNA levels were assessed relative to 18S rRNA and normalized to control. (n=3-5 mice per group). (F) GM vessels from brain sections of control and mutant mice also bearing ROSA26R(Zs/+) stained for pTIE2 (yellow arrowheads) and CDH5. Zs green channel displays PCs. Scale bar, 10 μm. Histogram on right represents pTIE2 staining intensity on CDH5+ Zs+ vessels. At least 50 blood vessels quantified per mouse (n=3 mice). Student’s t-test, *P<0.05, **P<0.01.
Figure 5.
Figure 5.. Treatment of mutants with anti-ANGPT2 mitigates GMH pathogenesis and improves vessel morphology.
(A) Schematic of experimental setup. Pregnant dams bearing controls and mutants were injected daily from E10.5-12.5 with vehicle or anti-ANGPT2 blocking antibody, and embryos were harvested at E13.5. (B) Brightfield images of whole embryos (top; black arrow indicates hemorrhage) and H&E-stained GM region from coronal brain sections (bottom) from indicated genotype and treatment. Quantification of gross hemorrhage at E13.5 shown on right (n=11-13 mutants). (C) GM sections stained for CDH5, NG2 and Col-IV. Yellow arrowheads indicate areas on EC vessels lacking PC and Col-IV coverage. Histograms represent quantification of PC and Col-IV coverage (D), vessel diameter, lumen area, and vessel area (E) of GM vessels from controls or mutants subjected to vehicle or anti-ANGPT2 treatment. (F) GM sections stained for Ki67 (proliferation marker), ERG (EC nuclei), CDH5 and DAPI. White arrowheads indicate Ki67+ERG+ nuclei within CDH5+ vessels. Percentage of EC nuclei that are Ki67+ per treatment group shown on right. One-way ANOVA with Tukey’s multiple comparison test; *P<0.05; **P<0.01; ***P<0.001 and ****P<0.0001. At least 50 blood vessels quantified per mouse (n=3-4 mice per condition). Scale bars, 1 mm (B, top), 50 μm (B, bottom) and 10 μm (C, F).
Figure 6.
Figure 6.. PC-specific deletion of Angpt2 in mutants attenuates GMH incidence and extends survival.
(A) Brightfield images of whole embryos with brain hemorrhage (black arrow, top) and H&E-stained GM region from coronal brain sections (bottom) of indicated genotypes. Quantification of gross hemorrhage in mutants at E13.5 shown on right (n=14-16 mutants). (B) GM sections stained for CDH5, NG2 and Col-IV. Yellow arrowheads indicate area on EC vessels lacking PC and Col-IV coverage. Histograms represent quantification of PC and Col-IV coverage (C) and vessel diameter, lumen area, and vessel area (D) of GM vessels from controls or mutants bearing wildtype or floxed alleles for Angpt2. At least 50 blood vessels were quantified per mouse (n=3-4 mice per condition). (E) GM sections stained for Ki67, ERG, CDH5 and DAPI. White arrowheads indicate Ki67+ERG+ nuclei within CDH5+ vessels. Percentage of EC nuclei that are Ki67+ per treatment group shown on right. (F) Kaplan-Meier survival curves of mutants bearing wildtype or floxed alleles for Angpt2 from day of birth (postnatal day 0). One-way ANOVA with Tukey’s multiple comparison test, **P<0.01; ***P<0.001; ****P<0.0001 (A-E) and log-rank test (F), ****P<0.001. At least 50 blood vessels quantified per mouse (n=3-4 mice per condition). Scale bars, 1 mm (A, top), 50 μm (A, bottom) and 10 μm (B, E).

References

    1. Mazurek R, Dave JM, Chandran RR, Misra A, Sheikh AQ, Greif DM. Vascular Cells in Blood Vessel Wall Development and Disease. Adv Pharmacol. 2017;78:323–350. doi: 10.1016/bs.apha.2016.08.001 - DOI - PMC - PubMed
    1. Ballabh P Intraventricular hemorrhage in premature infants: mechanism of disease. Pediatr Res. 2010;67:1–8. doi: 10.1203/PDR.0b013e3181c1b176 - DOI - PMC - PubMed
    1. Jobe AH, Goldenberg RL. Antenatal corticosteroids: an assessment of anticipated benefits and potential risks. Am J Obstet Gynecol. 2018;219:62–74. doi: 10.1016/j.ajog.2018.04.007 - DOI - PubMed
    1. Dave JM, Mirabella T, Weatherbee SD, Greif DM. Pericyte ALK5/TIMP3 Axis Contributes to Endothelial Morphogenesis in the Developing Brain. Dev Cell. 2018;44:665–678 e666. doi: 10.1016/j.devcel.2018.01.018 - DOI - PMC - PubMed
    1. Daneman R, Zhou L, Kebede AA, Barres BA. Pericytes are required for blood-brain barrier integrity during embryogenesis. Nature. 2010;468:562–566. doi: 10.1038/nature09513 - DOI - PMC - PubMed

Publication types

MeSH terms

Substances