. 2024 Jul 18;15(34):13937-13941.
doi: 10.1039/d3sc03466f. Online ahead of print.

Ion carrier modulated MRI contrast

Affiliations

Ion carrier modulated MRI contrast

Anna M Duncan et al. Chem Sci. .

Abstract

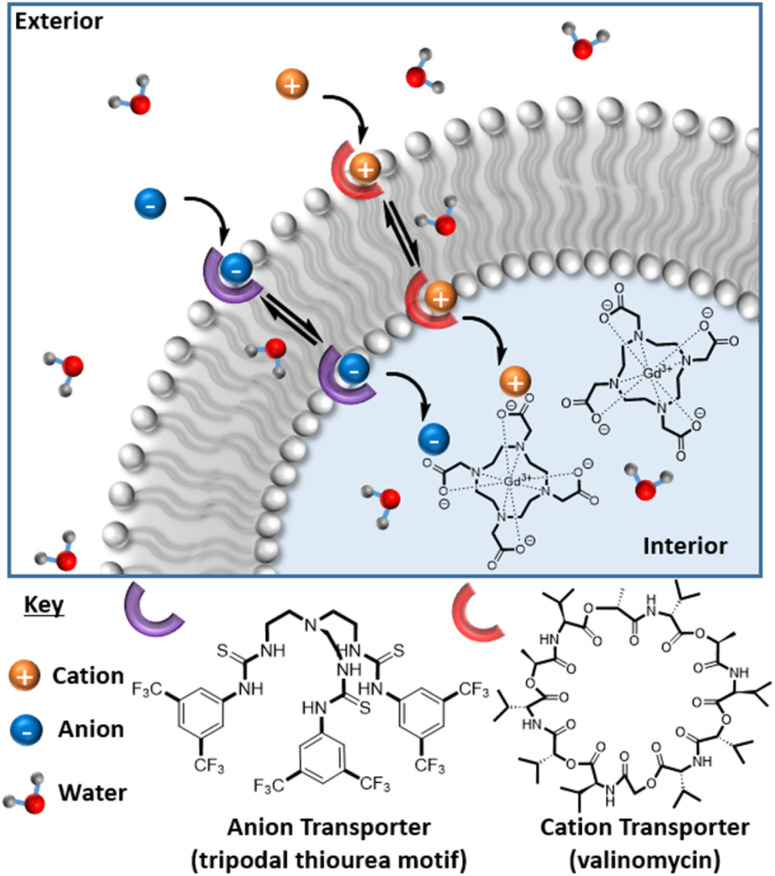
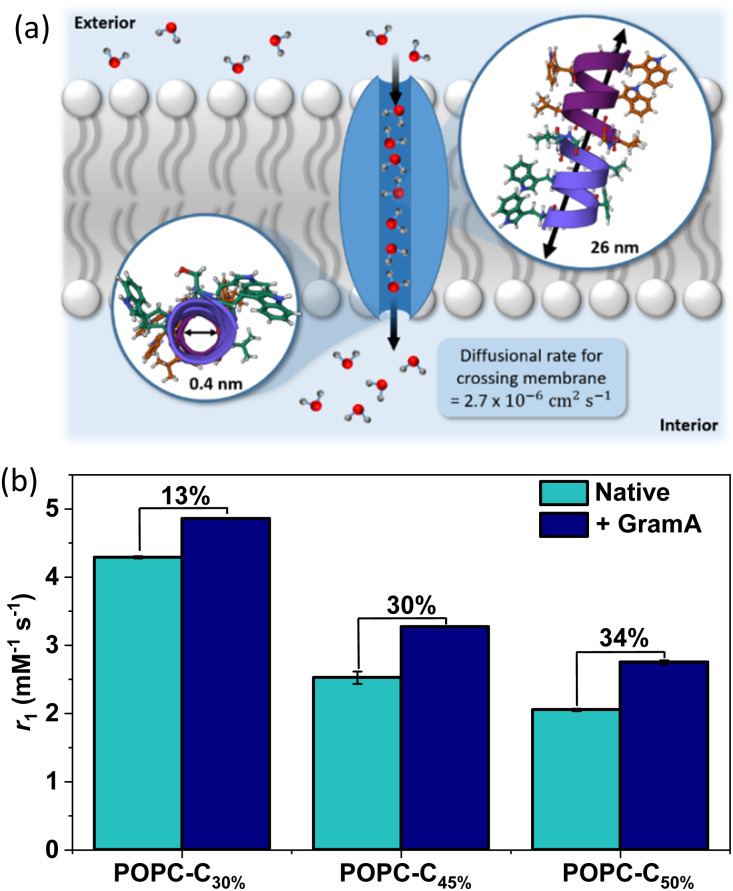
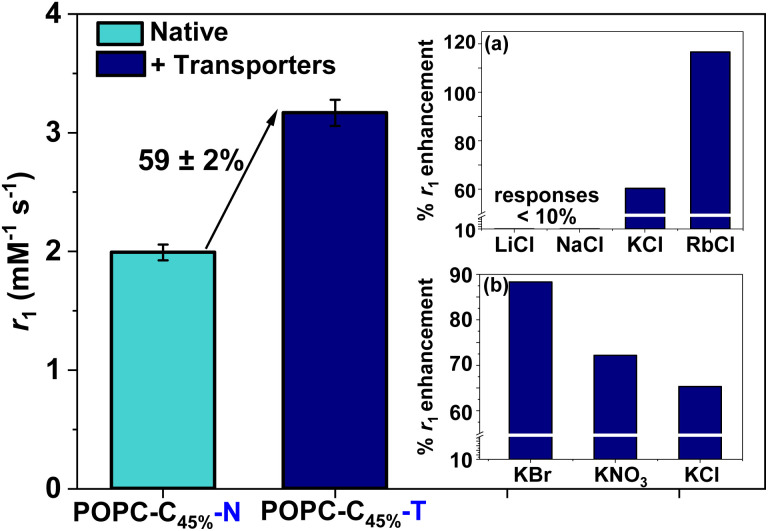
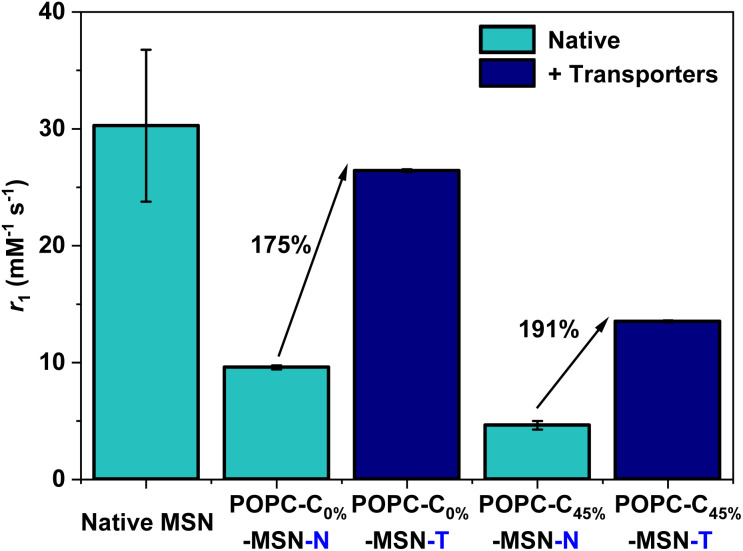
An ion-responsive MRI contrast agent based on a POPC liposomal scaffold is generated that displays a large amplitude relaxivity switch. Entrapment of MR active Gd-DOTA within cholesterol-doped, i.e., membrane rigidified, liposomes dampens the MR response through diminished water exchange across the lipid bilayer. Relaxivity is re-established by integration of ion carriers in the liposome membrane to mediate solvated ion flux.


Conflict of interest statement

There are no conflicts to declare.

Figures

Fig. 1
Fig. 1. A schematic illustrating the transfer of electrostatically bound K+ to Vln and Cl by tripodal thiourea across the lipid bilayer of MR-active liposomes, accompanied by associated water transport which switches on MR image contrast.
Fig. 2
Fig. 2. (a) A schematic highlighting the transport of water molecules from the exterior solution to the interior pool of the liposomes, mediated by GramA (PDB ID: 1MAG). The pore diameter and the length of GramA are 0.4 nm and 26 nm respectively, with the diffusion rate of water highlighted. The diameter of the pore channel is narrow and therefore it enables a single chain of 7–9 water molecules to align within it. (b) The influence of GramA integration (2 mol% w.r.t. POPC) on the relaxivity (obtained at 1.41 T, 298 K) of pre-formed Gd loaded vesicles, across a range of cholesterol doping levels, to highlight the increased rigidification at higher cholesterol loading. Error bars for all data points were obtained from a linear regression analysis on linear plots of 1/T1versus [Gd(iii)] to obtain a value for the gradient, which is equal to r1 ± 1 s d.
Fig. 3
Fig. 3. Longitudinal relaxivity values obtained at 1.41 T, 298 K for 45 mol% cholesterol-doped liposomes in both the absence and presence of KCl (1.08 mM) and transporters (1 mol% each). Error bars represent 1 s d. on either side of the mean r1 value across two independent samples. Inset (a) shows the cation selectivity (1.08 mM MCl) with the greatest response observed for RbCl (∼120%). Analogous Li and Na responses were <10%. Inset (b) displays the anion selectivity trend (1.08 mM KX).
Fig. 4
Fig. 4. T 1 weighted MRI maps, recorded at 1.5 T and 3 T (298 K) for the cholesterol doped lipids in the absence and presence of the transporters and KCl salt (1.08 mM).
Fig. 5
Fig. 5. r 1 values obtained at 1.41 T, 298 K for the POPC–MSNs (for 0 mol% and 45 mol% cholesterol modified bilayers), in both the absence and presence of the ionophores (1 mol% each), with the associated relative percentage switch in r1 highlighted. Error bars are calculated as described in Fig. 2(b).

References

    1. Wahsner J. Gale E. M. Rodríguez-Rodríguez A. Caravan P. Chem. Rev. 2019;119:957–1057. doi: 10.1021/acs.chemrev.8b00363. - DOI - PMC - PubMed
    1. Pellico J. Ellis C. M. Davis J. J. Contrast Media Mol. Imaging. 2019;2019:1–13. doi: 10.1155/2019/1845637. - DOI - PMC - PubMed
    1. Ni D. Bu W. Ehlerding E. B. Cai W. Shi J. Chem. Soc. Rev. 2017;46:7438–7468. doi: 10.1039/C7CS00316A. - DOI - PMC - PubMed
    1. Yuan D. Ellis C. M. Davis J. J. Materials (Basel) 2020;13:3795. doi: 10.3390/ma13173795. - DOI - PMC - PubMed
    1. Zhang W. Liu L. Chen H. Hu K. Delahunty I. Gao S. Xie J. Theranostics. 2018;8:2521–2548. doi: 10.7150/thno.23789. - DOI - PMC - PubMed

LinkOut - more resources