. 2024;84(8):784.
doi: 10.1140/epjc/s10052-024-12982-5. Epub 2024 Aug 7.

The XENONnT dark matter experiment

XENON CollaborationE Aprile  1 J Aalbers  2 K Abe  3 S Ahmed Maouloud  4 L Althueser  5 B Andrieu  4 E Angelino  6 J R Angevaare  2 V C Antochi  7 D Antón Martin  8 F Arneodo  9 M Balata  10 L Baudis  11 A L Baxter  12 M Bazyk  13 L Bellagamba  14 R Biondi  15 A Bismark  11 E J Brookes  2 A Brown  16 S Bruenner  2 G Bruno  13 R Budnik  17 T K Bui  3 C Cai  18 J M R Cardoso  19 F Cassese  20 A Chiarini  14 D Cichon  15 A P Cimental Chavez  11 A P Colijn  2 J Conrad  7 R Corrieri  10 J J Cuenca-García  11 J P Cussonneau  13 O Dadoun  4 V D'Andrea  10   21 M P Decowski  2 B De Fazio  20 P Di Gangi  14 S Diglio  13 J M Disdier  10 D Douillet  22 K Eitel  23 A Elykov  23 S Farrell  24 A D Ferella  10   25 C Ferrari  10 H Fischer  16 M Flierman  2 S Form  15 D Front  17 W Fulgione  6   10 C Fuselli  2 P Gaemers  2 R Gaior  4 A Gallo Rosso  7 M Galloway  11 F Gao  18 R Gardner  8 N Garroum  4 R Glade-Beucke  16 L Grandi  8 J Grigat  16 H Guan  12 M Guerzoni  14 M Guida  15 R Hammann  15 A Higuera  24 C Hils  26 L Hoetzsch  15 N F Hood  27 J Howlett  1 C Huhmann  5 M Iacovacci  20 G Iaquaniello  22 L Iven  11 Y Itow  28 J Jakob  5 F Joerg  15 A Joy  7 M Kara  23 P Kavrigin  17 S Kazama  28 M Kobayashi  28 G Koltman  17 A Kopec  27 F Kuger  16 H Landsman  17 R F Lang  12 L Levinson  17 I Li  24 S Li  12   29 S Liang  24 S Lindemann  16 M Lindner  15 K Liu  18 J Loizeau  13 F Lombardi  26 J Long  8 J A M Lopes  19   30 Y Ma  27 C Macolino  10   25 J Mahlstedt  7 A Mancuso  14 L Manenti  9 F Marignetti  20 T Marrodán Undagoitia  15 P Martella  10 K Martens  3 J Masbou  13 D Masson  16 E Masson  4 S Mastroianni  20 E Mele  20 M Messina  10 R Michinelli  14 K Miuchi  31 A Molinario  6 S Moriyama  3 K Morå  1 Y Mosbacher  17 M Murra  1 J Müller  16 K Ni  27 S Nisi  10 U Oberlack  26 D Orlandi  10 R Othegraven  26 B Paetsch  17 J Palacio  15 S Parlati  10 P Paschos  8 Q Pellegrini  4 R Peres  11 C Peters  24 J Pienaar  8 M Pierre  2 G Plante  1 T R Pollmann  2 J Qi  27 J Qin  12 D Ramírez García  11 M Rynge  8   32 J Shi  18 R Singh  12 L Sanchez  24 J M F Dos Santos  19 I Sarnoff  9 G Sartorelli  14 J Schreiner  15 D Schulte  5 P Schulte  5 H Schulze Eißing  5 M Schumann  16 L Scotto Lavina  4 M Selvi  14 F Semeria  14 P Shagin  26 S Shi  1 E Shockley  27 M Silva  19 H Simgen  15 J Stephen  8 M Stern  1 B K Stillwell  8 A Takeda  3 P-L Tan  7 D Tatananni  10 A Terliuk  15   33 D Thers  13 F Toschi  23 G Trinchero  6 C Tunnell  24 F Tönnies  16 K Valerius  23 G Volta  11 C Weinheimer  5 M Weiss  17 D Wenz  5   26 J Westermann  15 C Wittweg  11 T Wolf  15 V H S Wu  23 Y Xing  13 D Xu  1 Z Xu  1 M Yamashita  3 L Yang  27 J Ye  1   34 L Yuan  8 G Zavattini  35 M Zhong  27 T Zhu  1
Affiliations

The XENONnT dark matter experiment

XENON Collaboration et al. Eur Phys J C Part Fields. 2024.

Abstract

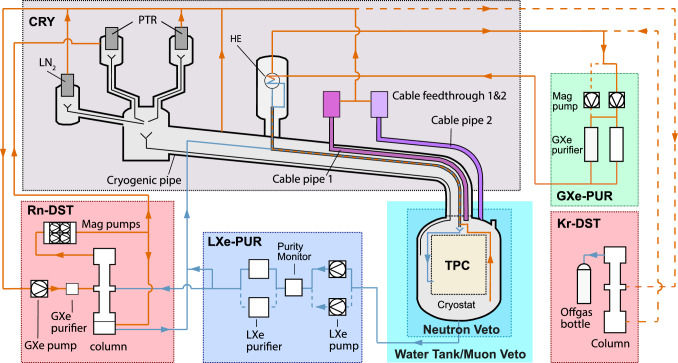
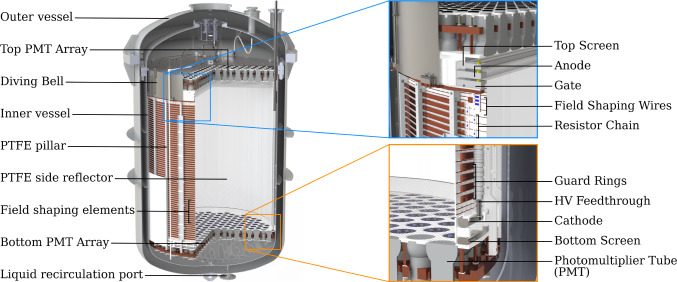
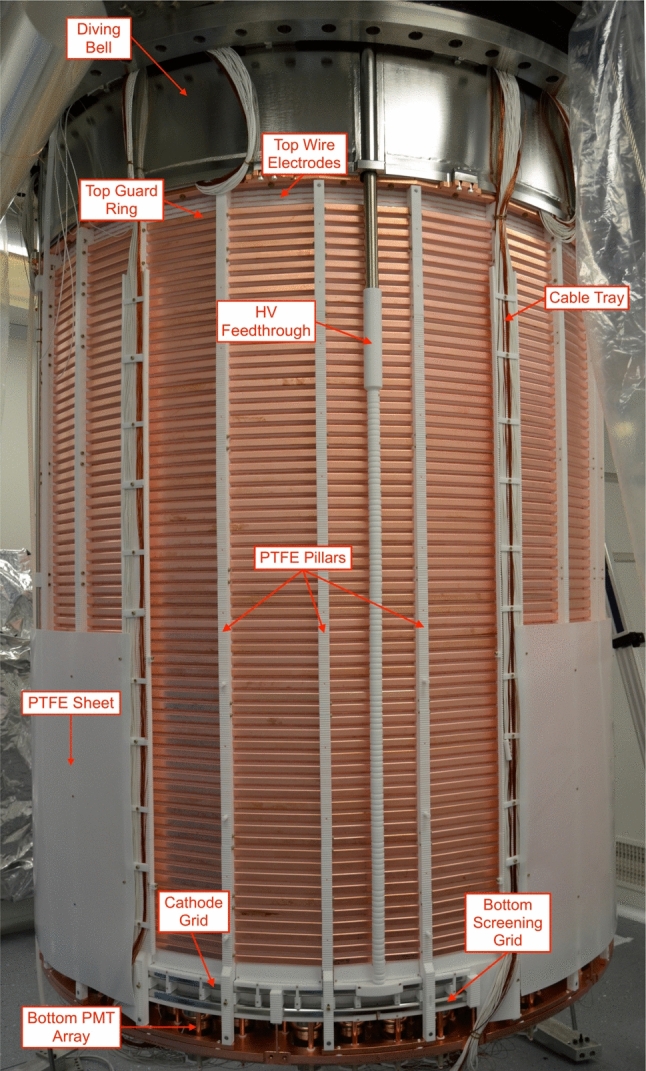
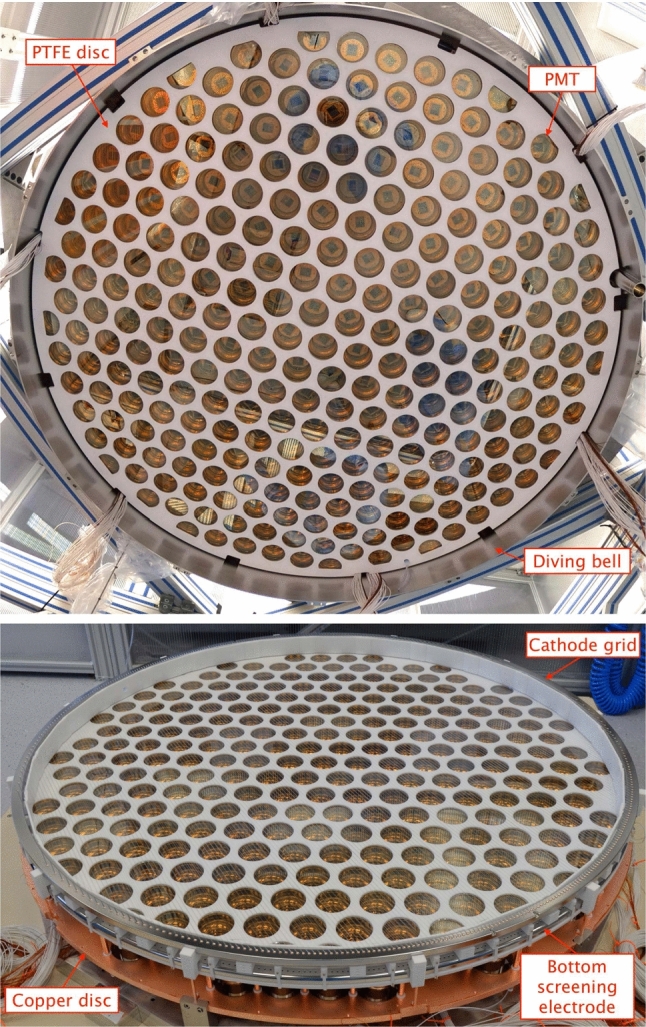
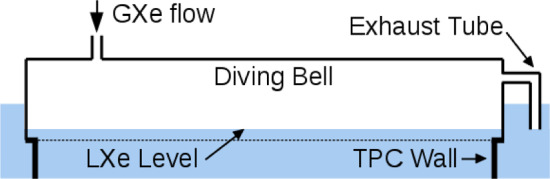
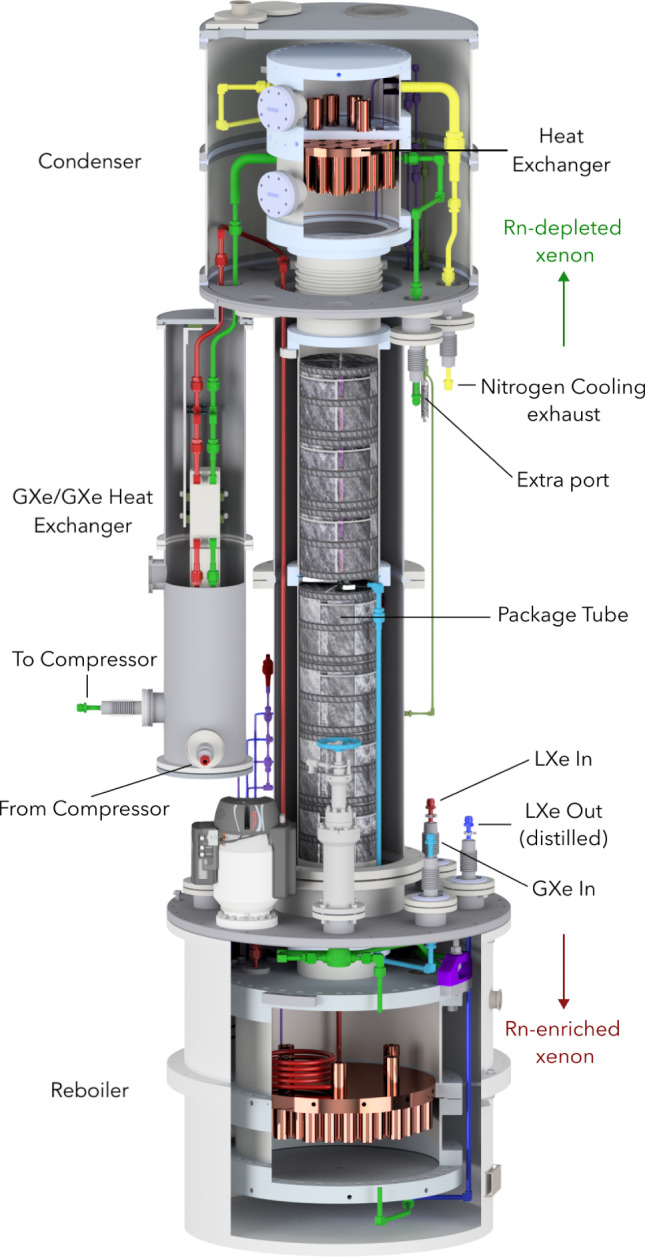
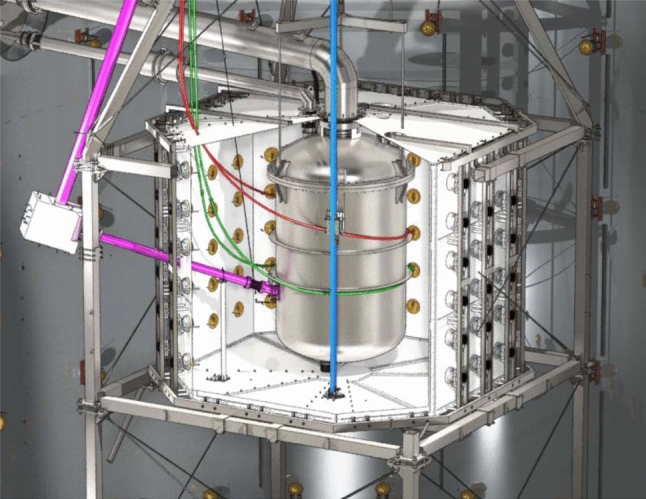
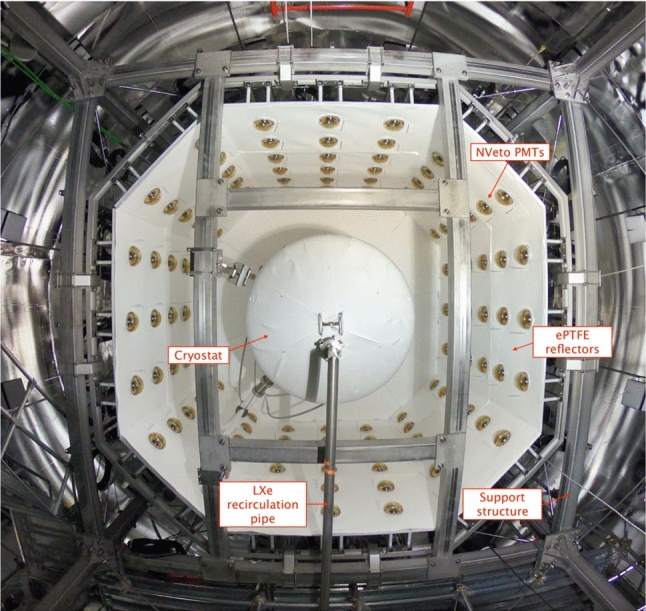
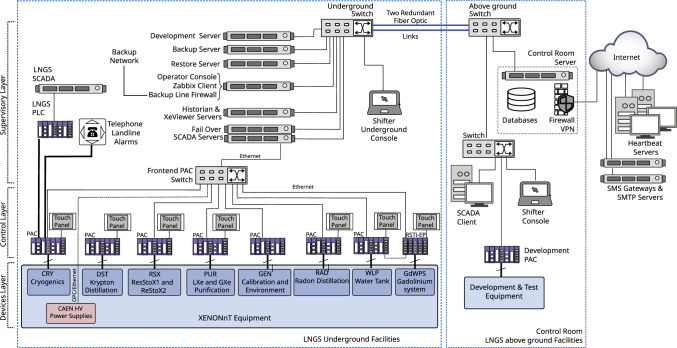
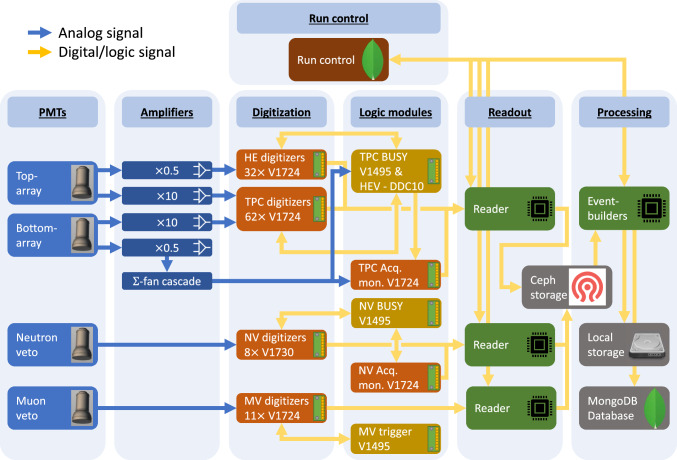
The multi-staged XENON program at INFN Laboratori Nazionali del Gran Sasso aims to detect dark matter with two-phase liquid xenon time projection chambers of increasing size and sensitivity. The XENONnT experiment is the latest detector in the program, planned to be an upgrade of its predecessor XENON1T. It features an active target of 5.9 tonnes of cryogenic liquid xenon (8.5 tonnes total mass in cryostat). The experiment is expected to extend the sensitivity to WIMP dark matter by more than an order of magnitude compared to XENON1T, thanks to the larger active mass and the significantly reduced background, improved by novel systems such as a radon removal plant and a neutron veto. This article describes the XENONnT experiment and its sub-systems in detail and reports on the detector performance during the first science run.


Figures

Fig. 1
Fig. 1
Schematic of the XENONnT experiment highlighting the detectors (TPC, neutron veto, muon veto) as well as the sub-systems for cryogenics and purification. Orange and blue arrows are used to show the path of gaseous and liquid xenon, respectively. The solid lines indicate the default flow path during normal operation, while the dashed lines indicate redundant flow paths and the optional flow path to allow for online krypton distillation. Details on the cryogenic system (CRY), the gaseous and liquid purification systems (GXe-PUR and LXe-PUR), and the krypton and radon removal plants (Kr-DST and Rn-DST) are reported in Sect. 2.2. The TPC and the veto systems are described in Sects. 2.1 and 2.3, respectively
Fig. 2
Fig. 2
CAD rendering of the XENONnT TPC within the cryostat. The zoomed insets show details about the field cage, the electrode stacks at the top and bottom of the TPC, and the implementation of the PMT arrays
Fig. 3
Fig. 3
The XENONnT TPC suspended from the top flange of the inner cryostat vessel shortly before the assembly was completed within the cleanroom inside the water tank. One panel of the PTFE sheet surrounding the lower part of the TPC was removed to show how the cathode high voltage feedthrough connects to the cathode electrode
Fig. 4
Fig. 4
PMT arrays during TPC assembly: (top) The top array installed inside the diving bell. (bottom) The cathode and bottom screening electrodes are installed above the bottom PMT array
Fig. 5
Fig. 5
Illustration (not to scale) of setting LXe level of the TPC with a diving bell: The lower end of the exhaust pipe defines the height of the liquid–gas interface
Fig. 6
Fig. 6
The Hamamatsu R11410-21 PMTs in the top (253 units) and bottom (241) arrays were distributed according to their room-temperature quantum efficiency (QE, color code). PMT 383 was added just before assembly to replace one of the PMTs which performed worst during testing, i.e., it was not positioned based on its QE
Fig. 7
Fig. 7
(top) The electrode wires are individually fixed by copper pins to the electrode frames (here: anode). Two transverse wires, installed to reduce sagging, are shown as well. (bottom) Detailed outside view of the TPC field-shaping elements during installation: the massive guard rings (15 mm height) and the thinner wire field electrodes (2 mm diameter) are installed at half pitch at different distances from the 3 mm thick PTFE reflectors. The guard electrodes consist of two pieces fixed together by two M3 SS bolts at each junction. The other two bolts are used to fix the guard-ring resistor chain (installed within the guard rings). Also visible are the 5 GΩ resistors on PTFE supports connecting the wire field electrodes
Fig. 8
Fig. 8
CAD rendering of the xenon handling system in XENONnT. It includes the cryostat hosting the LXe TPC, the cryogenic system used to cool the xenon (CRY), the liquid (LXe-PUR) and gaseous purification (GXe-PUR) systems for electronegative impurity removal, the cryogenic distillation columns for krypton (Kr-DST) and radon removal (Rn-DST), ReStoX1 and ReStoX2 for LXe storage, filling and recovery, and the gas bottle rack for adding xenon gas into the system
Fig. 9
Fig. 9
3D CAD rendering of the radon distillation column. Its total height is 3.8 m and it is continuously operated to reduce the 222Rn level to the design goal
Fig. 10
Fig. 10
CAD rendering of the neutron veto structure (white reflectors, 120 PMTs) and the calibration system. The I-belt (blue) is used to move a tungsten collimator containing a source close to the cryostat. The L-shaped beam pipe (pink) for neutron calibrations consists of the neutron guide and beam arms, pointing towards the water tank top and the cryostat, respectively. Unshielded calibration sources can be inserted into the two U-tubes (red, green) surrounding the cryostat
Fig. 11
Fig. 11
A picture of the neutron veto taken from below during its assembly (the bottom octagon of light reflectors was not yet in place). In the center the cryostat, covered with ePTFE sheets, and the LXe recirculation pipe are visible
Fig. 12
Fig. 12
Overview of the XENONnT slow control system: the information from the various sub-systems underground is acquired by Programmable Automation Controllers (PACs) and eventually stored in a database. The remote accessibility of the system is crucial for safe detector operation and continuously monitored by heartbeat servers
Fig. 13
Fig. 13
Overview of the XENONnT data acquisition system [90]. The PMT signals from the neutron and muon veto systems and the amplified TPC PMT signals (top and bottom array) are digitized and time-stamped before being read out. The attenuated signals (0.5×) of the bottom array PMTs are summed using a cascade of linear fan-in/fan-out modules. Logic modules inhibit data readout in case of high-energy events or if digitizers are busy
Fig. 14
Fig. 14
Signals detected during a calibration with an Am-Be source. They are associated to a neutron interaction in the TPC and a coincident 4.4 MeV γ-photon interacting in the neutron veto (filled with demineralized water), followed by a 2.2 MeV γ from subsequent neutron capture in the water. The bottom combined display summarizes the time correlation between these events in the two detectors: at t=0 a neutron is emitted; the associated γ-photon interacts through Compton scattering in the water, inducing Cherenkov light, which is detected by neutron veto PMTs within few tens of ns. At the same time, the neutron scatters in the xenon target producing a nuclear recoil and inducing the emission of prompt light (S1). The back-scattered neutron leaves the TPC and, upon reaching the NV, is moderated and captured by a proton, inducing the emission of a 2.2 MeV photon detected by the neutron veto PMTs after 200 μs. Within the TPC two S2-type signals are detected. Properties of the S1 and of the S2-like signals are used to define the primary S2 that, in this case, is the one recorded around 550 μs. The alternative S2 is compatible with a single electron signal. The S1 and S2 signals are shown with higher time resolution in the top left two panels. The top-right plot shows a top view of TPC and neutron veto, with the hit pattern for the S2 signal as seen by the TPC top PMT array (see central circular panel; the magenta dot indicates the reconstructed S2 position) as well as the hit pattern from the detection of the 4.4 MeV γ-photon in the neutron veto PMTs. The staggered circles indicate the PMTs of the neutron veto from the bottom (inner) to the top (outer circles). The circle size is proportional to the detected signal and the color code shows the time of detection
Fig. 15
Fig. 15
Event rate in the neutron veto as a function of time for 4 (red), 6 (green), and 10-fold (blue) PMT coincidence after filling the water shield with demineralized water. The initial high rate due to contamination with natural 222Rn decreases consistent with its half-life, after which the rates stabilize to below 100 Hz even for the 4-fold coincidence requirement
Fig. 16
Fig. 16
Electron lifetime evolution as measured with the purity monitor. A clear improvement occurs after the start of cryogenic LXe purification operated at 2 LPM with the high-efficiency O2 purifier (Q-5). The model assumes a purifier efficiency of 100% and an O2 outgassing rate of 0.11 mg/day
Fig. 17
Fig. 17
Light yield variation as a function of the reconstructed interaction depth and radius derived from the 41.6 keV 83mKr summation line. The reference frame is such that the liquid/gas interface and cathode planes are located at z = 0 cm and z-149 cm, respectively
Fig. 18
Fig. 18
Relative S2 correction maps for the top array (top) and bottom array (bottom) as a function of the reconstructed coordinates Xobs and Yobs derived from 83mKr data. The two evident narrow bands with enhanced S2 response are produced by the transverse wires located on the gate and anode electrodes to mitigate their sagging
Fig. 19
Fig. 19
2D histogram of the S2 area (with XY spatial corrections applied) as a function of drift time for 83mKr decays. In red, overlaid to the 2D histogram, a negative exponential fit of the average S2 area values (black points) used to extract the electron lifetime τe=(15.0±0.4) ms for this run
Fig. 20
Fig. 20
Light yield Ly and charge yield Qy (in PE/keV) for several monoenergetic ER lines between 2.8 keV (37Ar [85]) and 4.4 MeV (12C). The values from low-energy lines 37Ar, 83mKr, 131mXe and 129mXe (the latter two activated during neutron calibration) are fitted with the function Qy=-g2g1Ly+g2W derived from Eq. (2). The best-fit result is shown in red. Higher-energy lines were excluded from the fit since they are more affected by potential reconstruction biases

References

    1. E. Aprile et al., Design and Performance of the XENON10 Dark Matter Experiment. Astropart. Phys. 34, 679 (2011). 10.1016/j.astropartphys.2011.01.006
    1. E. Aprile et al., The XENON100 Dark Matter Experiment. Astropart. Phys. 35, 573 (2012). 10.1016/j.astropartphys.2012.01.003
    1. E. Aprile et al., The XENON1T Dark Matter Experiment. Eur. Phys. J. C 77(12), 881 (2017). 10.1140/epjc/s10052-017-5326-3
    1. E. Aprile et al., Dark Matter Search Results from a One Ton-Year Exposure of XENON1T. Phys. Rev. Lett. 121(11), 111302 (2018). 10.1103/PhysRevLett.121.111302 - PubMed
    1. E. Aprile et al., First Results on the Scalar WIMP-Pion Coupling, Using the XENON1T Experiment. Phys. Rev. Lett. 122, 071301 (2019). 10.1103/PhysRevLett.122.071301 - PubMed