Examining cognition and brain networks using magnetoencephalography in paediatric autoimmune encephalitis and acute disseminated encephalomyelitis: a preliminary study
- PMID: 39130516
- PMCID: PMC11316206
- DOI: 10.1093/braincomms/fcae248
Examining cognition and brain networks using magnetoencephalography in paediatric autoimmune encephalitis and acute disseminated encephalomyelitis: a preliminary study
Abstract
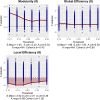
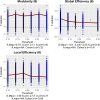
Paediatric autoimmune encephalitis, including acute disseminated encephalomyelitis, are inflammatory brain diseases presenting with cognitive deficits, psychiatric symptoms, seizures, MRI and EEG abnormalities. Despite improvements in disease recognition and early immunotherapy, long-term outcomes in paediatric autoimmune encephalitis remain poor. Our aim was to understand functional connectivity changes that could be associated with negative developmental outcomes across different types of paediatric autoimmune encephalitis using magnetoencephalography. Participants were children diagnosed with paediatric autoimmune encephalitis at least 18 months before testing and typically developing children. All completed magnetoencephalography recording at rest, T1 MRI scans and neuropsychology testing. Brain connectivity (specifically in delta and theta) was estimated with amplitude envelope correlation, and network efficiency was measured using graph measures (global efficiency, local efficiency and modularity). Twelve children with paediatric autoimmune encephalitis (11.2 ± 3.5 years, interquartile range 9 years; 5M:7F) and 12 typically developing controls (10.6 ± 3.2 years, interquartile range 7 years; 8M:4F) participated. Children with paediatric autoimmune encephalitis did not differ from controls in working memory (t(21) = 1.449; P = 0.162; d = 0.605) but had significantly lower processing speed (t(21) = 2.463; P = 0.023; Cohen's d = 1.028). Groups did not differ in theta network topology measures. The paediatric autoimmune encephalitis group had a significantly lower delta local efficiency across all thresholds tested (d = -1.60 at network threshold 14%). Theta modularity was associated with lower working memory (β = -0.781; t(8) = -2.588, P = 0.032); this effect did not survive correction for multiple comparisons (P(corr) = 0.224). Magnetoencephalography was able to capture specific network alterations in paediatric autoimmune encephalitis patients. This preliminary study demonstrates that magnetoencephalography is an appropriate tool for assessing children with paediatric autoimmune encephalitis and could be associated with cognitive outcomes.
Keywords: NMDAR-Ab encephalitis; acute disseminated encephalomyelitis (ADEM); autoimmune encephalitis; magnetoencephalography (MEG); neurodevelopment.
© The Author(s) 2024. Published by Oxford University Press on behalf of the Guarantors of Brain.
Conflict of interest statement
The authors report no competing interests.
Figures


References
-
- McKeon GL, Robinson GA, Ryan AE, et al. Cognitive outcomes following anti-N-methyl-D-aspartate receptor encephalitis: A systematic review. J Clin Exp Neuropsychol. 2018;40:234–252. - PubMed
-
- Shim Y, Kim SY, Kim H, et al. Clinical outcomes of pediatric anti-NMDA receptor encephalitis. Eur J Paediatr Neurol. 2020;29:87–91. - PubMed
-
- Flet-Berliac L, Tchitchek N, Lépine A, et al. Long-term outcome of paediatric anti-N-methyl-D-aspartate receptor encephalitis. Dev Med Child Neurol. 2023;65:691–700. - PubMed
LinkOut - more resources
Full Text Sources
