. 2024 Jul 26:15:1439171.
doi: 10.3389/fgene.2024.1439171. eCollection 2024.

Identification and experimental validation of programmed cell death- and mitochondria-associated biomarkers in osteoporosis and immune microenvironment

Affiliations

Identification and experimental validation of programmed cell death- and mitochondria-associated biomarkers in osteoporosis and immune microenvironment

Xiu Yang et al. Front Genet. .

Abstract

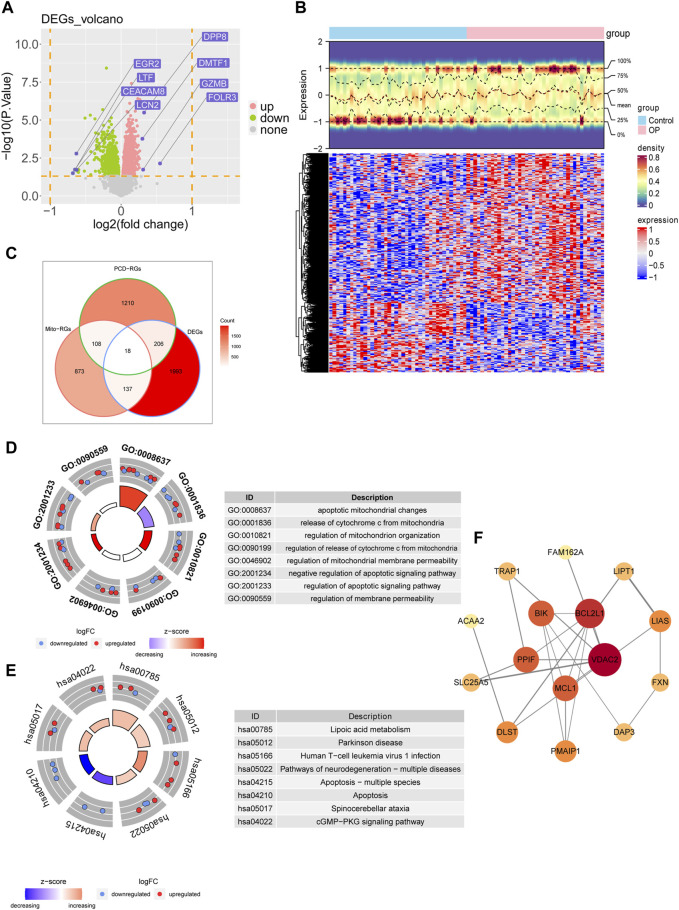
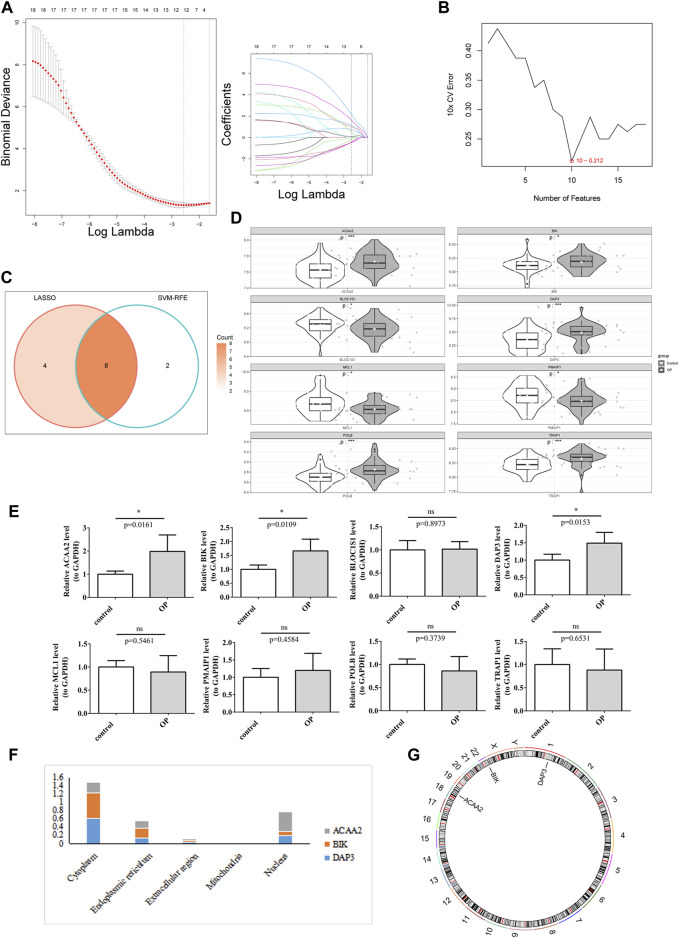
Background: Prior research has demonstrated that programmed cell death (PCD) and mitochondria assume pivotal roles in controlling cellular metabolism and maintaining bone cell equilibrium. Nonetheless, the comprehensive elucidation of their mode of operation in osteoporosis (OP) warrants further investigation. Therefore, this study aimed at analyzing the role of genes associated with PCD (PCD-RGs) and mitochondria (mortality factor-related genes; MRGs) in OP. Methods: Differentially expressed genes (DEGs) were identified by subjecting the GSE56815 dataset obtained from the Gene Expression Omnibus database to differential expression analysis and comparing OP patients with healthy individuals. The genes of interest were ascertained through the intersection of DEGs, MRGs, and PCD-RGs; these genes were filtered using machine learning methodologies to discover potential biomarkers. The prospective biomarkers displaying uniform patterns and statistically meaningful variances were identified by evaluating their levels in the GSE56815 dataset and conducting quantitative real-time polymerase chain reaction-based assessments. Moreover, the functional mechanisms of these biomarkers were further delineated by constructing a nomogram, which conducted gene set enrichment analysis, explored immune infiltration, generated regulatory networks, predicted drug responses, and performed molecular docking analyses. Results: Eighteen candidate genes were documented contingent upon the intersection between 2,354 DEGs, 1,136 MRGs, and 1,548 PCD-RGs. The biomarkers DAP3, BIK, and ACAA2 were upregulated in OP and were linked to oxidative phosphorylation. Furthermore, the predictive ability of the nomogram designed based on the OP biomarkers exhibited a certain degree of accuracy. Correlation analysis revealed a strong positive correlation between CD56dim natural killer cells and ACAA2 and a significant negative correlation between central memory CD4+ T cells and DAP3. DAP3, BIK, and ACAA2 were regulated by multiple factors; specifically, SETDB1 and ZNF281 modulated ACAA2 and DAP3, whereas TP63 and TFAP2C governed DAP3 and BIK. Additionally, a stable binding force was observed between the drugs (estradiol, valproic acid, and CGP52608) and the biomarkers. Conclusion: This investigation evidenced that the biomarkers DAP3, BIK, and ACAA2 are associated with PCD and mitochondria in OP, potentially facilitate the diagnosis of OP in clinical settings.

Keywords: machine learning; mitochondria; nomogram; osteoporosis; programmed cell death.


Conflict of interest statement

The authors declare that the research was conducted in the absence of any commercial or financial relationships that could be construed as a potential conflict of interest.

Figures

FIGURE 1
FIGURE 1
Preliminary identification and analysis of candidate genes. (A) Differential volcano plot analysis of the GSE56815 dataset. (B) Differential heat map analysis of the GSE56815 dataset. (C) Analysis of differential genes with Mito-RGs and PCD-RGs (D) GO enrichment analysis. (E) KEGG enrichment analysis. (F) Reconstruction of the PPI network.
FIGURE 2
FIGURE 2
DAP3, BIK, and ACAA2 were identified as biomarkers. (A) LASSO regression analysis. (B) SVM-RFE algorithm regression analysis. (C) Convergence of the LASSO and SVM-RFE algorithms. (D) Expression of key genes in the training data set. White represents disease samples, gray portrays normal samples. The statistical method used is the Wilcox test. “*” indicates p < 0.05, “**” symbolizes p < 0.01, “***” signifies p < 0.001, “****” depicts p < 0.0001, and “ns” denotes no significant difference. (E) Expression of key genes in qPCR. The expression of DAP3, BIK, and ACAA2 exhibited significant disparities (p < 0.05). (F) Subcellular localization prediction of biomarkers. (G) Chromosomal localization of biomarkers.
FIGURE 3
FIGURE 3
The nomogram exhibited excellent predictive potential for OP. (A) Nomogram construction. Evaluation of the diagnostic model of nomogram: (B) Calibration curve and (C) Decision curve. (D) ROC curve.
FIGURE 4
FIGURE 4
GSEA enrichment analysis. GSEA enrichment analysis based on (A) KEGG and (B) GO.
FIGURE 5
FIGURE 5
Immunoinfiltration analysis. (A) Immune score heat map of immune cell types in different samples obtained by using ssGSEA algorithm. (B) Box plot of immune scores acquired by using ssGSEA algorithm for immune cell types in different samples between OP patients and normal controls. The statistical method was Wilcox.test; ns indicates no significant difference, “*” symbolizes p < 0.05, “**” depicts p < 0.01. (C) Differential immune cell and biomarker correlation heat map. Correlation analysis revealed a highly significant positive correlation between CD56dim natural killer cells and ACAA2 (cor = 0.291, p = 0.009), while a highly significant negative correlation was observed between central memory CD4+ T cells and DAP3 (cor = −0.381, p = 0.0004).
FIGURE 6
FIGURE 6
TF-biomarker regulatory network construction. (A) Relevant acquisition of TFs. (B) Construction of TF-biomarker network map. (C) Construction of miRNA-biomarker network map.
FIGURE 7
FIGURE 7
Drug prediction and molecular docking. (A) Drug-biomarker network map. (B) Visualization of drug molecular docking results.

References

    1. Adejuyigbe B., Kallini J., Chiou D., Kallini J. R. (2023). Osteoporosis: molecular pathology, diagnostics, and therapeutics. Int. J. Mol. Sci. 24, 14583. 10.3390/ijms241914583 - DOI - PMC - PubMed
    1. Antonangeli F., Zingoni A., Soriani A., Santoni A. (2019). Senescent cells: living or dying is a matter of NK cells. J. Leukoc. Biol. 105, 1275–1283. 10.1002/JLB.MR0718-299R - DOI - PubMed
    1. Awuti K., Wang X., Sha L., Leng X. (2022). Exploring the regulatory mechanism of osteoporosis based on intestinal flora: a review. Med. (Baltim) 101, e32499. 10.1097/MD.0000000000032499 - DOI - PMC - PubMed
    1. Bedoui S., Herold M. J., Strasser A. (2020). Emerging connectivity of programmed cell death pathways and its physiological implications. Nat. Rev. Mol. Cell Biol. 21, 678–695. 10.1038/s41580-020-0270-8 - DOI - PubMed
    1. Brylka L. J., Schinke T. (2019). Chemokines in physiological and pathological bone remodeling. Front. Immunol. 10, 2182. 10.3389/fimmu.2019.02182 - DOI - PMC - PubMed

LinkOut - more resources