Review
. 2024 Jul;85(4):714-726.
doi: 10.3348/jksr.2024.0050. Epub 2024 Jul 30.

[Using Artificial Intelligence Software for Diagnosing Emphysema and Interstitial Lung Disease]

[Article in Korean]
Review

[Using Artificial Intelligence Software for Diagnosing Emphysema and Interstitial Lung Disease]

[Article in Korean]
Sang Hyun Paik et al. J Korean Soc Radiol. 2024 Jul.

Abstract

Researchers have developed various algorithms utilizing artificial intelligence (AI) to automatically and objectively diagnose patterns and extent of pulmonary emphysema or interstitial lung diseases on chest CT scans. Studies show that AI-based quantification of emphysema on chest CT scans reveals a connection between an increase in the relative percentage of emphysema and a decline in lung function. Notably, quantifying centrilobular emphysema has proven helpful in predicting clinical symptoms or mortality rates of chronic obstructive pulmonary disease. In the context of interstitial lung diseases, AI can classify the usual interstitial pneumonia pattern on CT scans into categories like normal, ground-glass opacity, reticular opacity, honeycombing, emphysema, and consolidation. This classification accuracy is comparable to chest radiologists (70%-80%). However, the results generated by AI are influenced by factors such as scan parameters, reconstruction algorithms, radiation doses, and the training data used to develop the AI. These limitations currently restrict the widespread adoption of AI for quantifying pulmonary emphysema and interstitial lung diseases in daily clinical practice. This paper will showcase the authors' experience using AI for diagnosing and quantifying emphysema and interstitial lung diseases through case studies. We will primarily focus on the advantages and limitations of AI for these two diseases.

흉부 CT상 폐기종이나 간질성 폐질환의 형태나 범위를 인공지능을 이용하여 자동적으로 객관적으로 진단하는 다양한 알고리즘을 개발되고, 이를 증명하는 연구들이 진행되어 왔다. 흉부 CT상 인공지능을 이용한 폐기종 정량화 연구들을 보면 CT상 폐기종의 상대적인 양이 증가와 폐 기능의 악화와 연관이 있으며, 특히 중심성 폐기종을 중심으로 정량화를 하는 것이 임상 증상이나 만성폐쇄성 폐질환의 사망률을 예측하는 데 도움이 된다고 보고하고 있다. 또한, 간질성 폐질환에서는 인공지능이 CT상 통상성 간질성 폐렴의 형태를 정상, 간유리 음영, 망상형 음영, 벌집 모양, 폐기종, 경화로 분류를 할 수 있고, 인공지능이 흉부영상의학과 전문의와 비슷한 정도로 통상성 간질성 폐렴을 진단(70%–80%) 할 수 있다고 보고했다. 그러나 인공지능의 결과들이 흉부 CT의 스캔 변수들, 재구성 알고리즘, 방사선 선량, 개발된 인공지능 훈련 데이터에 의해 영향을 받으며, 이러한 이유로 아직까지 흉부 CT상 폐기종과 간질성 폐질환의 진단과 정량화는 실제로 일상 업무에서 제한적으로 사용되고 있다. 이 논문에서는 폐기종과 간질성 폐질환의 진단과 정량화를 위해서 인공지능을 사용하고 있는 저자들의 경험을 증례로 소개를 하고, 이 두 질환의 인공지능의 효용성과 제한점에 대해서 언급하고자 한다.


Conflict of interest statement

Conflicts of Interest: Gong Yong Jin has been a Section Editor of the Journal of the Korean Society of Radiology since 2024; however, he was not involved in the peer reviewer selection, evaluation, or decision process of this article. The remaining author has declared no conflicts of interest.

Figures
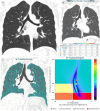
Fig. 1
Fig. 1. A 39-year-old male patient never smoker underwent chest CT. Pulmonary function tests showed normal FEV1/FVC.
A. The inspiratory chest CT scan shows no emphysema. B. Quantitative analysis reveals a 0% low attenuation area. C. Air trapping mapping using paired inspiratory and co-registered chest CT scans demonstrates 0% air trapping in both lungs. FEV1 = forced expiratory volume in one second, FVC = forced vital capacity, HU = Hounsfield unit
Fig. 2
Fig. 2. A 74-year-old male patient current smoker (50 pack-years) with severe shortness of breath underwent chest CT. Pulmonary function tests showed a reduced FEV1/FVC of 68%.
A. Chest CT reveals severe empyema throughout the lungs, with centrilobular and panlobular emphysema with bullae predominantly distributed in both upper lobes. B. Quantitative analysis of the inspiratory chest CT scan shows a 30% low attenuation area (colored). Notably, empyema with a size of 1–7 mm occupies the majority of this area. C. Parametric response mapping using paired inspiratory and expiratory chest CT scans demonstrates 44% SAD (fSAD) in both lungs. FEV1 = forced expiratory volume in one second, fSAD = functional small airway disease, FVC = forced vital capacity, HU = Hounsfield unit
Fig. 3
Fig. 3. A 61-year-old male patient current smoker (30 pack-years) underwent low-dose chest CT.
A. The low-dose chest CT scan shows no emphysema. B. Quantitative analysis of the inspiratory low-dose chest CT scan reveals a 0% low attenuation area.
Fig. 4
Fig. 4. A 67-year-old male patient current smoker (30 pack-years) underwent low-dose chest CT.
A. The inspiratory low-dose chest CT scan shows centrilobular empyema throughout the lungs, with emphysema with bullae predominantly distributed in both upper lobes. B. Quantitative analysis of the low-dose chest CT scan shows a 13% low attenuation area (colored in red).
Fig. 5
Fig. 5. A 61-year-old male patient ex-smoker underwent low-dose chest CT.
A. The low-dose inspiratory chest CT scan shows no emphysema. B. Quantitative analysis of the low-dose chest CT scan reveals a 12% low attenuation area (colored in red). This is an artifact due to the low-dose chest CT.
Fig. 6
Fig. 6. A 74-year-old male patient current smoker (30 pack-years) underwent low-dose chest CT.
A. The patient underwent the low-dose chest CT for initial lung cancer screening at a time when he had no respiratory symptoms. The initial low-dose CT scan shows multifocal traction bronchiolectasis (arrows) in the subpleural area of both lungs. B. Four years later, the patient developed dyspnea and underwent another chest CT scan. A lung biopsy confirmed the usual interstitial lung pneumonia. The chest CT scan shows diffuse GGA with traction bronchiolectasis and interlobular septal thickening (arrows) in the subpleural area of both lungs. Compared to a low-dose chest CT scan from four years ago, there is a progression of subpleural fibrosis in both lungs. Quantitative analysis of the chest CT scan shows 2% reticular opacity (orange color) and less than 1%, honeycomb (red color). C. The patient was treated with Pirespa tablets (200 mg) for one year. A follow-up chest CT scan shows GGA with traction bronchiolectasis and interlobular septal thickening (arrows) in the subpleural area of both lungs. Compared to the chest CT from one year ago, subpleural fibrosis in both lungs has improved. Quantitative analysis of the chest CT scan shows 1% reticular opacity (orange color) and less than 1% honeycomb (red color). GGA = ground glass attenuation
Fig. 7
Fig. 7. A 74-year-old male patient current smoker (30 pack-years) with severe dyspnea underwent chest CT. Pulmonary function tests showed a reduced FEV1/FVC of 32% and a reduced DLCO of 4.8 mL/mmHg/min. Chest CT reveals honeycombing and reticular opacity with GGA in the subpleural area of both lungs. Quantitative analysis of the chest CT scan shows 4% reticular opacity (orange color) and 4% honeycomb (red color).
DLCO = diffusing capacity of the lung for CO, FEV1 = forced expiratory volume in one second, FVC = forced vital capacity, GGA = ground glass attenuation
Fig. 8
Fig. 8. A 78-year-old male patient current smoker (50 pack-years) with severe dyspnea underwent chest CT. Pulmonary function test showed a reduced FEV1/FVC of 73% and a DLCO of 7.9 mL/mmHg/min. Chest CT demonstrates honeycombing, reticular opacity, and lung destruction due to airway enlargement with fibrosis in the subpleural area of both lungs. Quantitative analysis of the chest CT scan shows 1% reticular opacity (orange color) and 5% honeycomb (red color). However, this software cannot measure lung destruction caused by airway enlargement with fibrosis and emphysema within the honeycombing areas.
DLCO = diffusing capacity of the lung for CO, FEV1 = forced expiratory volume in one second, FVC = forced vital Capacity

Similar articles

Cited by

References

    1. El Kaddouri B, Strand MJ, Baraghoshi D, Humphries SM, Charbonnier JP, van Rikxoort EM, et al. Fleischner society visual emphysema CT patterns help predict progression of emphysema in current and former smokers: results from the COPDGene study. Radiology. 2021;298:441–449. - PMC - PubMed
    1. Grenier PA. Deep learning assessment of emphysema progression at CT predicts outcomes. Radiology. 2022;304:680–682. - PubMed
    1. Humphries SM, Notary AM, Centeno JP, Strand MJ, Crapo JD, Silverman EK, et al. Deep learning enables automatic classification of emphysema pattern at CT. Radiology. 2020;294:434–444. - PMC - PubMed
    1. Dack E, Christe A, Fontanellaz M, Brigato L, Heverhagen JT, Peters AA, et al. Artificial intelligence and interstitial lung disease: diagnosis and prognosis. Invest Radiol. 2023;58:602–609. - PMC - PubMed
    1. Oh AS, Lynch DA, Swigris JJ, Baraghoshi D, Dyer DS, Hale VA, et al. Deep learning-based fibrosis extent on computed tomography predicts outcome of fibrosing interstitial lung disease independent of visually assessed computed tomography pattern. Ann Am Thorac Soc. 2024;21:218–227. - PubMed

LinkOut - more resources