

Dynamics of Virological and Clinical Response Parameters of Bulevirtide Treatment for Hepatitis D: Real-World Data
- PMID: 39131142
- PMCID: PMC11308454
- DOI: 10.1016/j.gastha.2024.01.001
Dynamics of Virological and Clinical Response Parameters of Bulevirtide Treatment for Hepatitis D: Real-World Data
Abstract
Background and aims: The entry inhibitor bulevirtide represents the first specific treatment for hepatitis-D virus (HDV)-infected patients. In clinical trials, around 80% of patients achieve normalization of alanine aminotransferase (ALT) with about 60% virological response after 1 year, but little is known about the dynamics of responses and clinical predictors of treatment outcomes. We report our single-center data from 15 patients and describe response dynamics, clinical outcomes, and predictive factors for treatment response.
Methods: Retrospective data from 15 patients have been analyzed at our department who started treatment with bulevirtide between 10/2020 and 08/2022. According to our standard procedures, laboratory parameters were controlled monthly; transient elastography was performed every 3 months, and the treatment duration was 12 months.
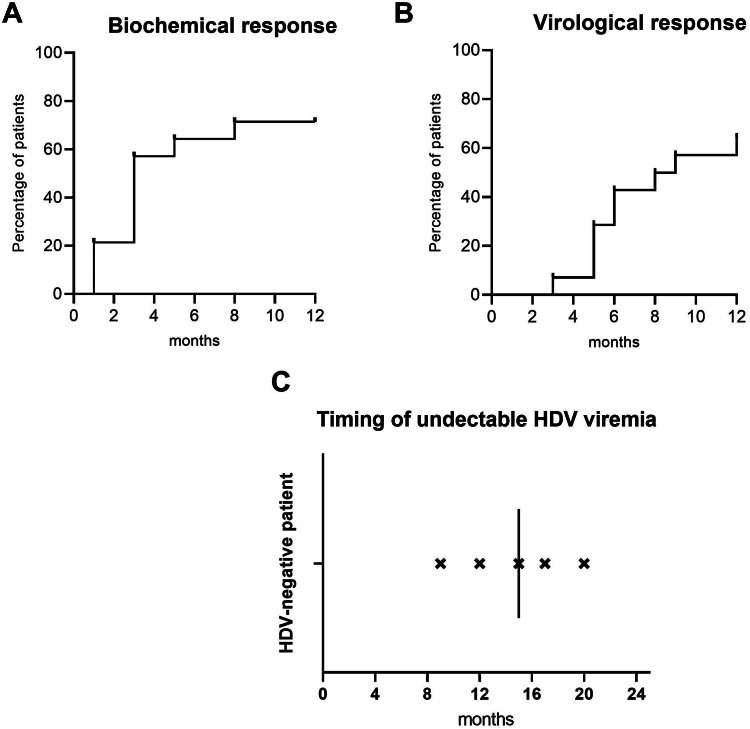
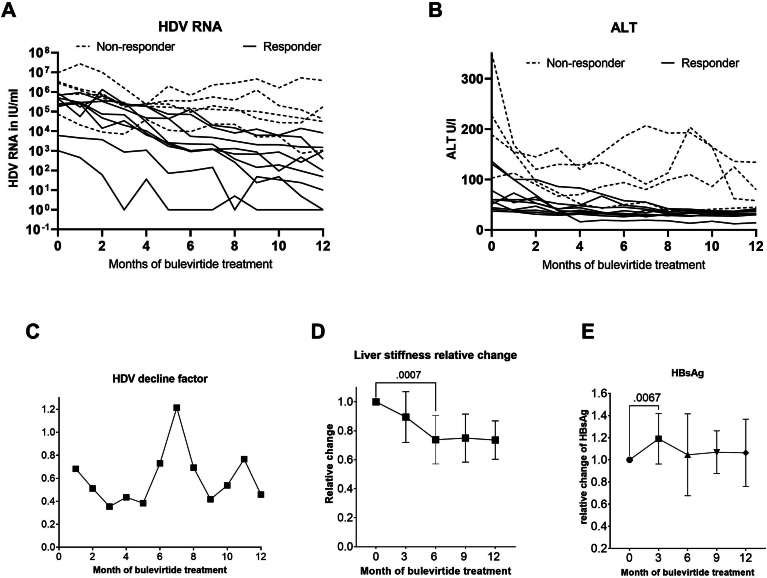
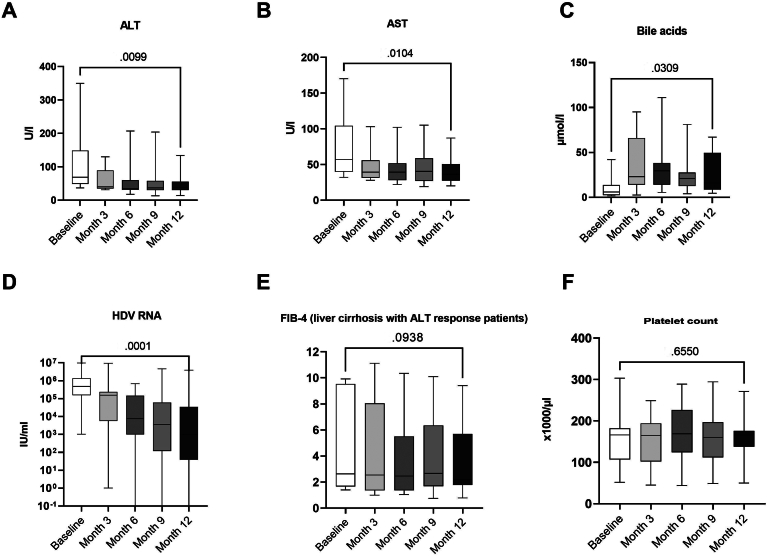
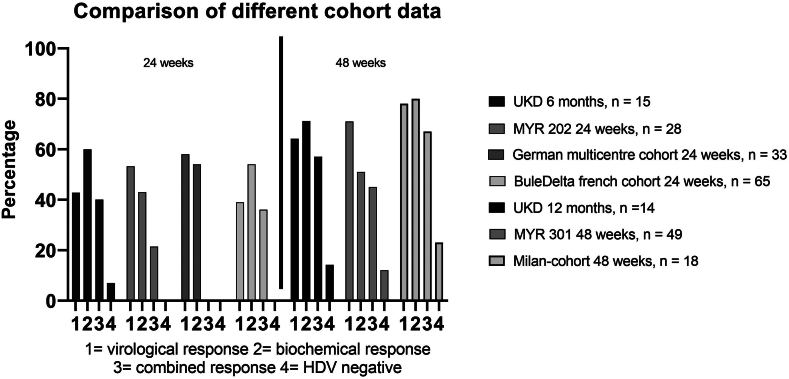
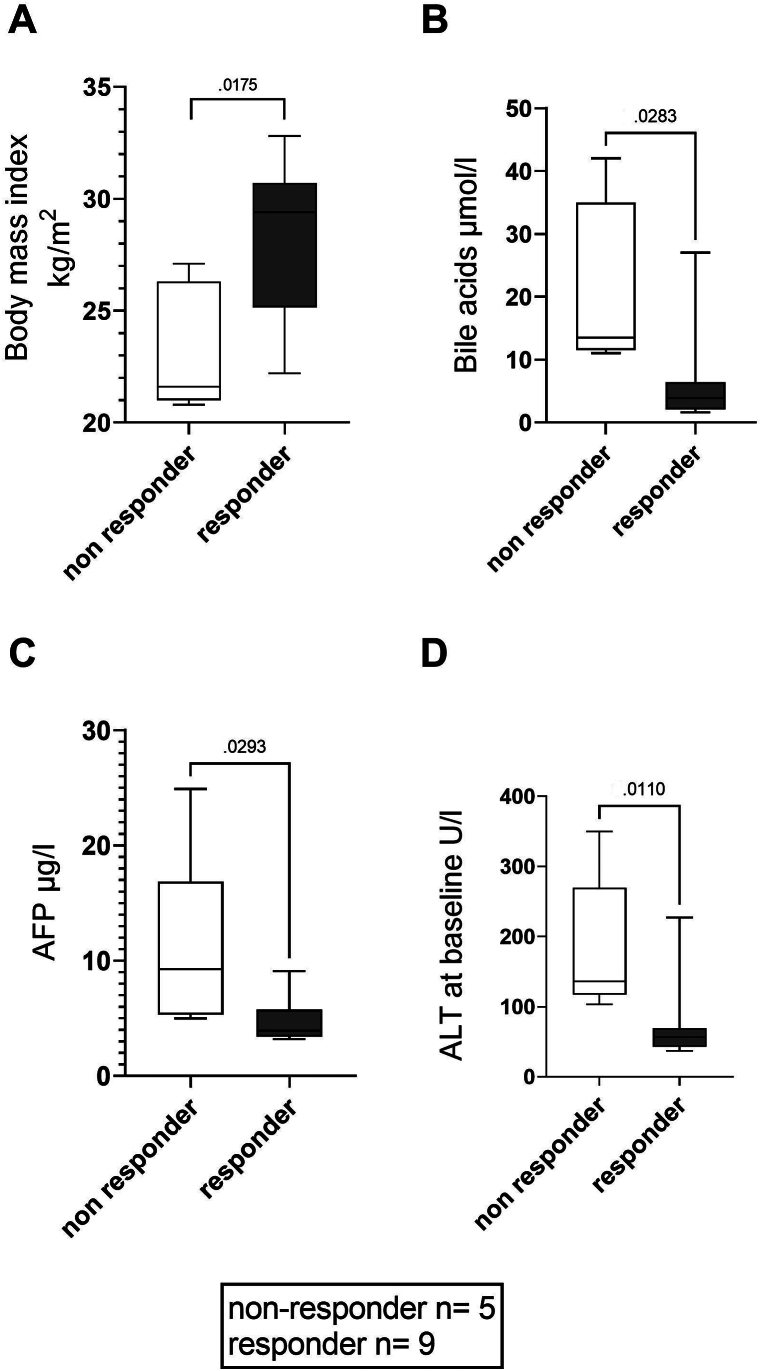
Results: Treatment response rates after 1 year of treatment were similar to published data from clinical trials. ALT normalization usually occurs between months 2-6 of treatment, followed by a virological response after ≥6 months. Patients with more severe hepatitis at the start of treatment were less likely to respond in the first year of treatment. Loss of HDV-RNA was observed in one-third of patients after ≥1 year of treatment. Low body mass index and high alpha-fetoprotein at baseline were possible predictors of a delayed treatment response.
Conclusion: Bulevirtide is a safe treatment option for HDV, leading to a fast hepatological response. Of note, decrease in transaminases precedes virological response. Patients with high viral load and ALT levels respond slower, but nonresponders (as classified by Food and Drug Administration criteria) still show a reduction in viremia. Longer observation periods are required to determine the optimal duration of bulevirtide monotherapy.
Keywords: Antiviral-Treatment; Delta; Entry-Inhibitor; Treatment Kinetics.
© 2024 The Authors.
Figures
References
-
- Wedemeyer H., Manns M.P. Epidemiology, pathogenesis and management of hepatitis D: update and challenges ahead. Nat Rev Gastroenterol Hepatol. 2010;7:31–40. - PubMed
-
- Heller T., Buti M., Lampertico P., et al. Hepatitis D: looking back, looking forward, seeing the reward and the promise. Clin Gastroenterol Hepatol. 2023;21:2051–2064.
-
- Chen H.-Y., Shen D.-T., Ji D.-Z., et al. Prevalence and burden of hepatitis D virus infection in the global population: a systematic review and meta-analysis. Gut. 2019;68:512–521. - PubMed
LinkOut - more resources
Full Text Sources
