. 2023 Dec 26;3(3):385-395.
doi: 10.1016/j.gastha.2023.12.007. eCollection 2024.

Investigating iRHOM2-Associated Transcriptional Changes in Tylosis With Esophageal Cancer

Affiliations

Investigating iRHOM2-Associated Transcriptional Changes in Tylosis With Esophageal Cancer

Stephen Murtough et al. Gastro Hep Adv. .

Abstract

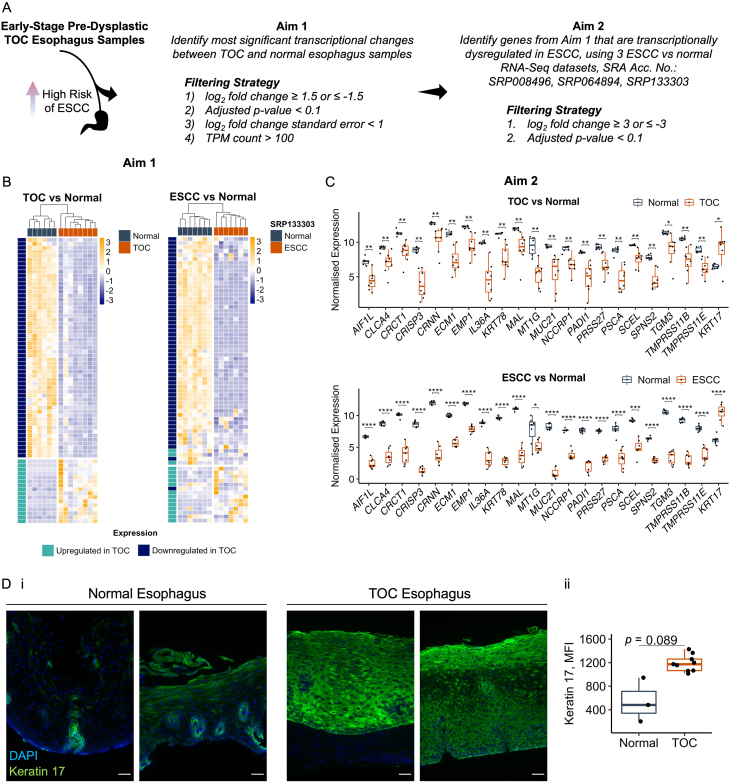
Background and aims: Survival rates for esophageal squamous cell carcinoma (ESCC) are extremely low due to the late diagnosis of most cases. An understanding of the early molecular processes that lead to ESCC may facilitate opportunities for early diagnosis; however, these remain poorly defined. Tylosis with esophageal cancer (TOC) is a rare syndrome associated with a high lifetime risk of ESCC and germline mutations in RHBDF2, encoding iRhom2. Using TOC as a model of ESCC predisposition, this study aimed to identify early-stage transcriptional changes in ESCC development.

Methods: Esophageal biopsies were obtained from control and TOC individuals, the latter undergoing surveillance endoscopy, and adjacent diagnostic biopsies were graded as having no dysplasia or malignancy. Bulk RNA-Seq was performed, and findings were compared with sporadic ESCC vs normal RNA-Seq datasets.

Results: Multiple transcriptional changes were identified in TOC samples, relative to controls, and many were detected in ESCC. Accordingly, pathway analyses predicted an enrichment of cancer-associated processes linked to cellular proliferation and metastasis, and several transcription factors were predicted to be associated with TOC and ESCC, including negative enrichment of GRHL2. Subsequently, a filtering strategy revealed 22 genes that were significantly dysregulated in both TOC and ESCC. Moreover, Keratin 17, which was upregulated in TOC and ESCC, was also found to be overexpressed at the protein level in 'normal' TOC esophagus tissue.

Conclusion: Transcriptional changes occur in TOC esophagus prior to the onset of dysplasia, many of which are associated with ESCC. These findings support the utility of TOC to help reveal the early molecular processes that lead to sporadic ESCC.

Keywords: ESCC; Early Cancer Detection; RNA-Seq; Tylosis With Esophageal Cancer; iRhom2.


Figures

Figure 1
Figure 1
Histological summary of TOC esophageal biopsies (A) Representative H&E images of normal and TOC esophagus tissue. Dotted line is drawn to indicate beginning of superficial terminally differentiated cell layer, and arrows are shown to indicate width of this tissue region. Scale = 100 μm. (B) Pathology reports for biopsies taken at adjacent regions in the esophagus to samples processed for bulk RNA-Seq. Pathology notes were summarized according to relevant histological criteria. N, no; NM, not mentioned; Y, yes.
Figure 2
Figure 2
Early-stage TOC esophageal biopsies display a gene expression profile that is distinct from a normal esophagus state and is transcriptionally similar to ESCC. (A) Boxplots showing expression counts (as log2 [TPM+1]) in TOC and normal esophageal samples for 7 genes associated with TOC and iRhom2. Adjusted P-values are shown, and statistical significance was calculated using a two-sample t-test with the rstatix package (v.0.7.2). ns = not significant, ∗∗P < .01. A plot was produced using ggplot2 (v.3.4.3). (B) Volcano plot showing differentially expressed genes between TOC and normal esophageal samples. Before plotting, differential gene expression matrices were filtered for genes with mean TPM count >5. Vertical red lines indicate log2 fold change of −1 and 1, and the horizontal red line indicates an adjusted P-value of .1. Black points denote nonsignificant genes, blue points denote downregulated genes, and red points denote upregulated genes. (C) Bar plot showing the top 10 upregulated and top 10 downregulated genes (ranked by log2 fold change) in TOC esophagus samples, relative to normal esophagus controls. (D) PCA plot of PC1 and PC2, calculated using 9829 genes with mean TPM count >5. A vertical dotted line is shown, indicating a split of samples along PC1. Principal components were calculated using base R’s stats package (v.4.3.1). (E) (i) Heatmap of TPM values for 1241 differentially expressed genes (identified in TOC vs normal samples by: log2 fold change ≥0.58 or ≤−0.58 (fold change of 1.5), adjusted P-value <.1, and mean TPM value >10) in TOC vs normal samples; (ii) clustering dendrogram, color-coded according to normal, TOC 1, and TOC 2 transcriptional clusters; and (iii) top 5 enriched BioPlanet pathways (ranked by adjusted P-value) associated with downregulated and upregulated genes used to identify the TOC 1 and TOC 2 transcriptional clusters. Heatmap produced using pheatmap package in R (v.1.0.12); dendrogram produced using hclust (R Stats Package, v.4.3.1) and visualized using dendextend (v.1.17.1) and ggplot2 (v.3.4.3); and gene ontology bar plot produced using ggplot2 (v.3.4.3). (F) (i) Heatmap of TPM values for genes identified in part Ei, in ESCC and normal samples (SRP133303). (ii) Euler diagrams showing how many of the 1241 genes are significantly upregulated or downregulated in ESCC samples and how many are shared between 3 publicly available ESCC vs normal datasets; SRP008496, SRP064894, and SRP133303. (iii) Overrepresented BioPlanet pathways associated with the 118 common upregulated genes in ESCC samples. Heatmap produced using pheatmap package in R (v.1.0.12); Euler diagrams produced using eulerr package in R (v.7.0.0); gene ontology bar plot produced using ggplot2 (v.3.4.3). PC1, principal component 1; PC2, principal component 2.
Figure 3
Figure 3
Pathway and transcription factor prediction analyses reveal early molecular changes in TOC that reflect PPK and ESCC. (A) Top 5 (ranked by adjusted P-value) overrepresented Gene Ontology pathways, split by (i) Biological Process, (ii) Molecular Function, (iii) Cellular Component, and (iv) Human Phenotype Ontology terms, associated with 88 upregulated genes in TOC esophageal samples relative to control samples, identified by log2 fold change >1.5, adjusted P-value <.1, log2 fold change standard error <1, and mean TPM value across samples >5. Bar plots produced using ggplot2 (v.3.4.3). (B) Boxplots showing expression counts (as log2 [TPM+1]) in TOC and normal esophageal samples for 7 genes linked to the Palmoplantar Keratoderma Human Phenotype Ontology [HP:0000982] that were identified as being upregulated in TOC esophageal samples. Adjusted P-values are shown. Statistical significance was calculated using a two-sample t-test with the rstatix package (v.0.7.2). ∗P < .05, ∗∗P < .01, ∗∗∗P < .001. Plot produced using ggplot2 (v.3.4.3). (C) (i) Bar plots showing enriched GSEA hallmark gene sets (P < .05 and FDR <0.25) in TOC esophageal samples, relative to controls. (ii) Heatmaps showing expression of core-enriched genes associated with angiogenesis, epithelial to mesenchymal transition (EMT), and cell proliferation (collated across MYC targets V1 and V2, E2F Targets, and G2M Checkpoint pathways) and color-coded according to normal, TOC 1, and TOC 2 transcriptional clusters. Beneath each heatmap, GSEA enrichment plots are shown, and the associated plot for MYC targets V2 is shown as representation for cell proliferation. Enrichment was performed using GSEA software (v.4.3.2). Significance scores are denoted as ∗P < .05, ∗∗P < .01, ∗∗∗P < .001. Plots were produced using pheatmap (v.1.0.12) and ggplot2 (v.3.4.3). (D) Bar plots showing NES for enriched transcription factors in (i) TOC1, (ii) TOC 2, and (iii) ESCC esophageal samples. Transcription factors enriched in ESCC were assessed and satisfied across SRP008496, SRP064894, and SRP133303 datasets. Predictions were calculated using the VIPER algorithm (v.1.34.0) and the human DoRothEA-curated regulon, dorothea_hs (v.1.12.0), for transcription factors with confidence scores, (A–D). (E) Representative immunofluorescence images of GRHL2 in normal and TOC esophagus tissue. GRHL2 is shown in green; DAPI nuclei stain is shown in blue; white arrows indicate examples of cytoplasmic/perinuclear staining; magnification = ×40; scale bar = 25μm. NES, normalized enrichment score.
Figure 4
Figure 4
A comparison of early-stage TOC and ESCC RNA-Seq datasets reveals 22 genes that are commonly dysregulated. (A) Schematic describing the filtering strategy that was designed to identify significant genes and to compare TOC and ESCC RNA-Seq datasets. (B) Heatmaps showing TPM counts for 71 genes that were identified according to Aim 1, described in part A, in TOC and normal, and ESCC and normal (SRP133303) esophageal samples. Heatmaps are produced using pheatmap (v.1.0.12). Normal samples are annotated with dark green-blue; TOC and ESCC samples are annotated with orange; genes downregulated in TOC are annotated with dark blue; and genes upregulated in TOC are annotated with green. (C) Boxplots showing expression counts (as log2 [TPM+1]) for 22 genes identified according to Aim 2, outlined in part A, in TOC and normal, and ESCC and normal (SRP133303) esophageal samples. Adjusted P-values are shown, and statistical significance was calculated using a two-sample t-test with the rstatix package (v.0.7.2). ∗P < .05, ∗∗P < .01, ∗∗∗P < .001, ∗∗∗∗P < .0001. Plots were produced using ggplot2 (v.3.4.3). (D) (i) Representative immunofluorescence images of Keratin 17 in TOC and normal esophagus tissue. Keratin 17 is shown in green; DAPI nuclei stain is shown in blue; magnification = x20; scale bar = 50μm. (ii) Boxplot showing quantification of mean fluorescence intensity of Keratin 17 staining in 3 control and 9 TOC esophagus sections, calculated using FIJI software (v.2.1.0). Statistical significance was calculated using a two-sample t-test with the rstatix package in R (v.0.7.2).

References

    1. Abnet C.C., Arnold M., Wei W.Q. Epidemiology of esophageal squamous cell carcinoma. Gastroenterology. 2018;154:360–373. - PMC - PubMed
    1. Arnold M., Morgan E., Bardot A., et al. International variation in oesophageal and gastric cancer survival 2012-2014: differences by histological subtype and stage at diagnosis (an ICBP SURVMARK-2 population-based study) Gut. 2022;71:1532–1543. - PubMed
    1. Blaydon D.C., Etheridge S.L., Risk J.M., et al. RHBDF2 mutations are associated with tylosis, a familial esophageal cancer syndrome. Am J Hum Genet. 2012;90:340–346. - PMC - PubMed
    1. Ellis A., Risk J.M., Maruthappu T., et al. Tylosis with oesophageal cancer: diagnosis, management and molecular mechanisms. Orphanet J Rare Dis. 2015;10:126. - PMC - PubMed
    1. Brooke M.A., Etheridge S.L., Kaplan N., et al. iRHOM2-dependent regulation of ADAM17 in cutaneous disease and epidermal barrier function. Hum Mol Genet. 2014;23:4064–4076. - PMC - PubMed