. 2024 Jul 24;34(30):2309929.
doi: 10.1002/adfm.202309929. Epub 2024 Mar 10.

DNA Origami-Engineered Plasmonic Nanoprobes for Targeted Cancer Imaging

Affiliations

DNA Origami-Engineered Plasmonic Nanoprobes for Targeted Cancer Imaging

Lintong Wu et al. Adv Funct Mater. .

Abstract

Plasmonic nanomaterials bearing targeting ligands are of great interest for surface-enhanced Raman scattering (SERS)-based bioimaging applications. However, the practical utility of SERS-based imaging strategies has been hindered by the lack of a straightforward method to synthesize highly sensitive SERS-active nanostructures with high yield and efficiency. In this work, leveraging DNA origami principles, we report the first-in-class design of a SERS-based plasmonically coupled nanoprobe for targeted cancer imaging (SPECTRA). The nanoprobe harnesses a cancer cell targeting DNA aptamer sequence and vibrational tag with stretching frequency in the cell-silent Raman window. Through the integration of aptamer sequence specific for DU145 cells, we show the unique capabilities of SPECTRA for targeted imaging of DU145 cells. Our results demonstrate that the scalability, cost-effectiveness, and reproducibility of this method of fabrication of SERS nanoprobes can serve as a versatile platform for creating nanoprobes with broad applications in the fields of cancer biology and biomedical imaging.

Keywords: DNA origami; plasmonic nanoantenna; surface-enhanced Raman scattering (SERS); targeted imaging.


Conflict of interest statement

Conflict of interest The authors declare no conflict of interest.

Figures
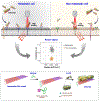
Figure 1.
Figure 1.
Schematic depicting the application of SPECTRA for targeted Raman imaging of metastatic DU145 prostate cancer cells. The distinctive spectral characteristics of SPECTRA, highlighted by the nitrile peak at 2225 cm−1, were predominantly observed in DU145 cells due to the higher affinity of SPECTRA towards these cells. The lower panel illustrates the sequential reaction steps involved in the fabrication of SPECTRA. The aptamer sequence, which exhibits a specific affinity towards DU145 cells, was selectively attached to the edges of a rectangular DNA origami template using biotin-neutravidin conjugation. Subsequently, 4-mercaptobenzonitrile (4-MBN) labeled Au NRs were immobilized on the DNA origami template in a nanoantenna configuration.
Figure 2.
Figure 2.
Characterization of rectangular DNA origami monomer and dimer. (a) Gel electrophoresis image showing migration of M13mp18 scaffold DNA, DNA origami monomer, and dimer. For reference, 1 kb DNA ladder was loaded in the first well. (b-d) TEM and AFM images showing the successful formation of rectangular DNA origami monomer. (e-g) TEM and AFM images showing successful formation of rectangular DNA origami dimer. (h) Average height of DNA origami monomer and dimer constructs (n=11) showing non-significant changes in the height after dimerization. (i) Average length and width of DNA origami monomer and dimer structures (n=11) showing significant changes in the length confirming dimerization happening at the short edge. All the data shown are representative of three independent experiments.
Figure 3.
Figure 3.
Confocal fluorescence microscopy and corresponding bright field images of (a-b) DU145 and (c-d) LNCaP cells incubated with 100 nM Cy5 conjugated DNA aptamer for 4 h, indicating aptamer binding by red fluorescence (Scale bar: 40 μm). Optical and structural characterization of synthesized Au NRs using (e) UV-vis absorption spectroscopy and (f-g) low and high-resolution TEM imaging, respectively. Both confirmed successful formation of highly uniform Au NRs with longitudinal surface plasmon resonance (LSPR) band at 679 nm (h) Schematic illustration of DNA functionalization of Au NRs using salt aging method. (i) UV-Vis absorption spectrum of DNA functionalized nanorods showing a peak at 262 nm corresponding to DNA along with LSPR band of Au NRs at 682 nm. (j) Zeta potential of Au NRs before (positive) and after DNA functionalization (negative). (k) Raman spectrum of Au NRs functionalized with 4-MBN showing nitrile peak at 2225 cm−1. All subpanels reflect representative data from in vitro experiments repeated three times.
Figure 4.
Figure 4.
Assembly and characterization of SPECTRA. (a-b) Low- and high-resolution TEM images showing highly uniform end-to-end configuration of Au NR dimers in SPECTRA. (c) AFM image showcasing both the Au NR dimer and the rectangular DNA origami template in SPECTRA. (d) Height profile illustrating the height variation of the Au NR dimer and rectangular DNA origami template, differences can be correlated with the dimension of the Au NR.
Figure 5.
Figure 5.
(a) Schematic of treatment of cells with SPECTRA and Raman imaging. In vitro cellular Raman imaging of DU145 and LNCaP cells incubated with (b) SPECTRA and (c) CTR (Scale bar: 10 μm). Sequential imaging panels: (Left) bright field image of the cell, (Middle) nitrile signal false colored in red, and (Right) merged image with an overlay of the bright field image and nitrile signal. (d and e) Raman spectra corresponding to the internal region of the cell, with and without the SPECTRA, respectively. The region where SPECTRA is present shows the presence of a prominent nitrile peak. (f) Data analysis result of Raman mapping measurements of cells interpreted as cell occupancy (the area of the cell occupied by SPECTRA divided by the total cell area).
Figure 6.
Figure 6.
(a) Schematic showing methodology of cell pellet Raman measurements. (b) Violin plot showing nitrile peak intensity of 121 individual points obtained by Raman measurements performed on cell pellets of DU145 and LNCaP cells incubated with SPECTRA and CTR. (c and d) Raman spectra acquired from cell pellets of DU145 and LNCaP cells incubated with SPECTRA. Data is plotted as the mean of nine individual points of acquisition. (e) Cell viability of DU145 and LNCaP cells incubated with SPECTRA at different time points of 3 h and 6 h. Data are shown as mean ± standard deviation (n=3 independent experiments); two-way ANOVA multiple comparisons; **P < 0.01 and ns= non-significant vs. control (non-treated) groups. Bright-field and fluorescence images of (f) DU145 and (g) LNCaP cells incubated with DNA origami conjugated with Cy5 labeled DNA aptamer. All subpanels reflect representative data from in vitro experiments repeated three times unless stated.
Scheme 1.
Scheme 1.
Schematic illustration of the construction of multifunctional rectangular DNA origami for capturing aptamer DNA sequences. Single-stranded M13mp18 bacteriophage genomic DNA is folded into a rectangular shape using predesigned short-staple DNA strands. During the synthesis of monomer origami, sticky sequences were introduced at the edges (green color) and on the flat surface (yellow color) for facilitating capturing of DNA aptamers and Au NRs, respectively. Rectangular DNA origami monomer A and monomer B were dimerized using branching staple sequences to yield a rectangular DNA template of dimensions of 180 nm × 60 nm × 2 nm. DU145 cell-targeting DNA aptamers were conjugated at both ends of the DNA template using neutravidin-biotin conjugation chemistry.

References

    1. Cheng J, Xie XS, Science 2015, 350(6264), aaa8870. - PubMed
    1. Jermyn M, Mok K, Mercier J, Desroches J, Pichette J, Saint-Arnaud K, Bernstein L, Guiot M, Petrecca K, Leblond F, Sci. Transl. Med 2015, 7(274), 274ra19. - PubMed
    1. Huang L, Sun H, Sun L, Shi K, Chen Y, Ren X, Ge Y, Jiang D, Liu X, Knoll W, Zhang Q, Wang Y, Nat. Commun 2023, 14(1), 48. - PMC - PubMed
    1. Tanwar S, Haldar K, Sen T, J. Am. Chem. Soc 2017,139(48), 17639–17648. - PubMed
    1. Tanwar S, Kaur V, Kaur G, Sen T, J. Phys. Chem. Lett 2021, 12(33), 8141–8150. - PubMed

LinkOut - more resources