[Preprint]. 2024 Oct 5:2024.07.31.605654.
doi: 10.1101/2024.07.31.605654.

Complete sequencing of ape genomes

DongAhn Yoo  1 Arang Rhie  2 Prajna Hebbar  3 Francesca Antonacci  4 Glennis A Logsdon  1   5 Steven J Solar  2 Dmitry Antipov  2 Brandon D Pickett  2 Yana Safonova  6 Francesco Montinaro  4   7 Yanting Luo  8 Joanna Malukiewicz  9 Jessica M Storer  10 Jiadong Lin  1 Abigail N Sequeira  11 Riley J Mangan  12   13   14 Glenn Hickey  3 Graciela Monfort Anez  15 Parithi Balachandran  16 Anton Bankevich  6 Christine R Beck  10   16   17 Arjun Biddanda  18 Matthew Borchers  15 Gerard G Bouffard  19 Emry Brannan  20 Shelise Y Brooks  19 Lucia Carbone  21   22 Laura Carrel  23 Agnes P Chan  24 Juyun Crawford  19 Mark Diekhans  3 Eric Engelbrecht  25 Cedric Feschotte  26 Giulio Formenti  27 Gage H Garcia  1 Luciana de Gennaro  4 David Gilbert  28 Richard E Green  29 Andrea Guarracino  30 Ishaan Gupta  31 Diana Haddad  32 Junmin Han  33 Robert S Harris  11 Gabrielle A Hartley  10 William T Harvey  1 Michael Hiller  34 Kendra Hoekzema  1 Marlys L Houck  35 Hyeonsoo Jeong  1   36 Kaivan Kamali  11 Manolis Kellis  12   13 Bryce Kille  37 Chul Lee  38 Youngho Lee  39 William Lees  25   40 Alexandra P Lewis  1 Qiuhui Li  41 Mark Loftus  42   43 Yong Hwee Eddie Loh  44 Hailey Loucks  3 Jian Ma  45 Yafei Mao  33   46   47 Juan F I Martinez  6 Patrick Masterson  32 Rajiv C McCoy  18 Barbara McGrath  11 Sean McKinney  15 Britta S Meyer  9 Karen H Miga  3 Saswat K Mohanty  11 Katherine M Munson  1 Karol Pal  11 Matt Pennell  48 Pavel A Pevzner  31 David Porubsky  1 Tamara Potapova  15 Francisca R Ringeling  49 Joana L Roha  50 Oliver A Ryder  35 Samuel Sacco  29 Swati Saha  25 Takayo Sasaki  28 Michael C Schatz  41 Nicholas J Schork  24 Cole Shanks  3 Linnéa Smeds  11 Dongmin R Son  51 Cynthia Steiner  35 Alexander P Sweeten  2 Michael G Tassia  18 Françoise Thibaud-Nissen  32 Edmundo Torres-González  11 Mihir Trivedi  1   36 Wenjie Wei  52   53 Julie Wertz  1 Muyu Yang  45 Panpan Zhang  26 Shilong Zhang  33 Yang Zhang  45 Zhenmiao Zhang  31 Sarah A Zhao  12 Yixin Zhu  48 Erich D Jarvis  38   54 Jennifer L Gerton  15 Iker Rivas-González  55 Benedict Paten  3 Zachary A Szpiech  11 Christian D Huber  11 Tobias L Lenz  9 Miriam K Konkel  42   43 Soojin V Yi  56 Stefan Canzar  49 Corey T Watson  25 Peter H Sudmant  50   57 Erin Molloy  58 Erik Garrison  30 Craig B Lowe  8 Mario Ventura  4 Rachel J O'Neill  10   17   59 Sergey Koren  2 Kateryna D Makova  11 Adam M Phillippy  2 Evan E Eichler  1   36
Affiliations

Complete sequencing of ape genomes

DongAhn Yoo et al. bioRxiv. .

Update in

  • Complete sequencing of ape genomes.
    Yoo D, Rhie A, Hebbar P, Antonacci F, Logsdon GA, Solar SJ, Antipov D, Pickett BD, Safonova Y, Montinaro F, Luo Y, Malukiewicz J, Storer JM, Lin J, Sequeira AN, Mangan RJ, Hickey G, Monfort Anez G, Balachandran P, Bankevich A, Beck CR, Biddanda A, Borchers M, Bouffard GG, Brannan E, Brooks SY, Carbone L, Carrel L, Chan AP, Crawford J, Diekhans M, Engelbrecht E, Feschotte C, Formenti G, Garcia GH, de Gennaro L, Gilbert D, Green RE, Guarracino A, Gupta I, Haddad D, Han J, Harris RS, Hartley GA, Harvey WT, Hiller M, Hoekzema K, Houck ML, Jeong H, Kamali K, Kellis M, Kille B, Lee C, Lee Y, Lees W, Lewis AP, Li Q, Loftus M, Loh YHE, Loucks H, Ma J, Mao Y, Martinez JFI, Masterson P, McCoy RC, McGrath B, McKinney S, Meyer BS, Miga KH, Mohanty SK, Munson KM, Pal K, Pennell M, Pevzner PA, Porubsky D, Potapova T, Ringeling FR, Rocha JL, Ryder OA, Sacco S, Saha S, Sasaki T, Schatz MC, Schork NJ, Shanks C, Smeds L, Son DR, Steiner C, Sweeten AP, Tassia MG, Thibaud-Nissen F, Torres-González E, Trivedi M, Wei W, Wertz J, Yang M, Zhang P, Zhang S, Zhang Y, Zhang Z, Zhao SA, Zhu Y, Jarvis ED, Gerton JL, Rivas-González I, Paten B, Szpiech ZA, Huber CD, Lenz TL, Konkel MK, Yi SV, Canzar S, Watson C… See abstract for full author list ➔ Yoo D, et al. Nature. 2025 May;641(8062):401-418. doi: 10.1038/s41586-025-08816-3. Epub 2025 Apr 9. Nature. 2025. PMID: 40205052 Free PMC article.

Abstract

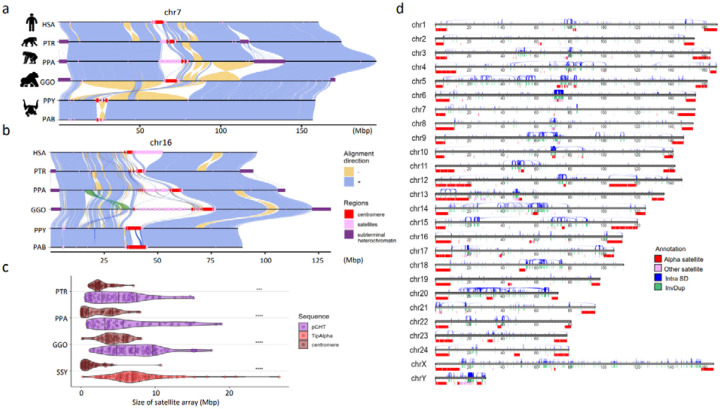
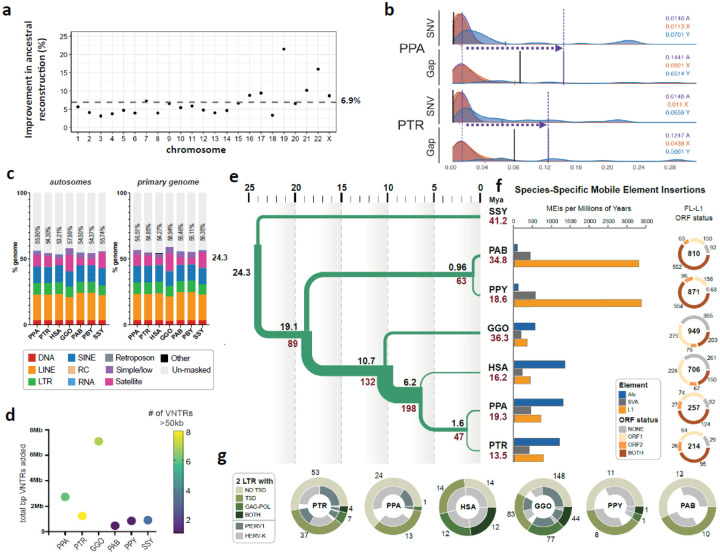
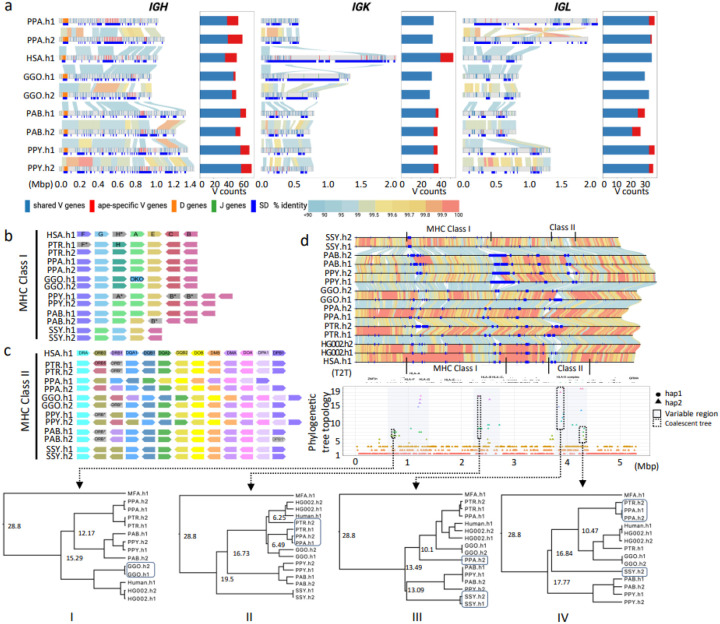
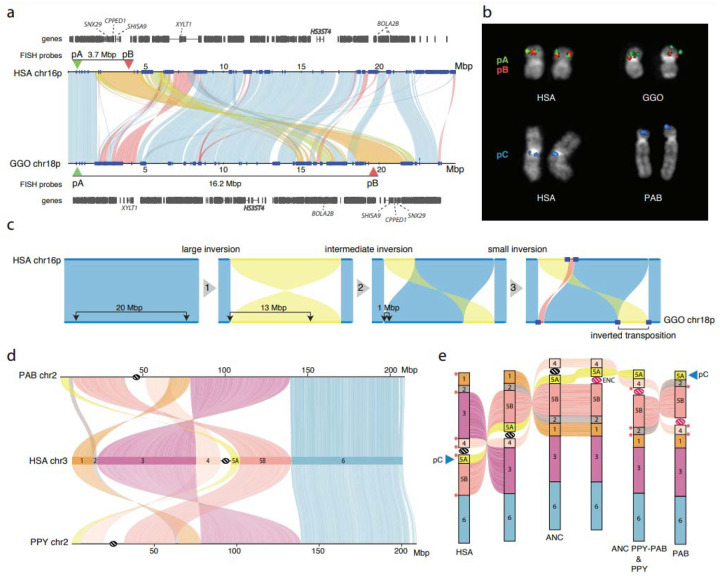
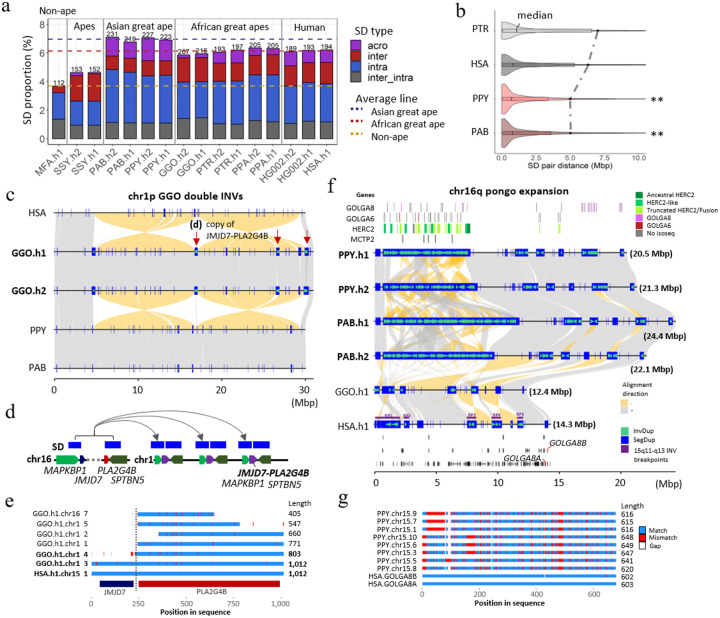
We present haplotype-resolved reference genomes and comparative analyses of six ape species, namely: chimpanzee, bonobo, gorilla, Bornean orangutan, Sumatran orangutan, and siamang. We achieve chromosome-level contiguity with unparalleled sequence accuracy (<1 error in 500,000 base pairs), completely sequencing 215 gapless chromosomes telomere-to-telomere. We resolve challenging regions, such as the major histocompatibility complex and immunoglobulin loci, providing more in-depth evolutionary insights. Comparative analyses, including human, allow us to investigate the evolution and diversity of regions previously uncharacterized or incompletely studied without bias from mapping to the human reference. This includes newly minted gene families within lineage-specific segmental duplications, centromeric DNA, acrocentric chromosomes, and subterminal heterochromatin. This resource should serve as a definitive baseline for all future evolutionary studies of humans and our closest living ape relatives.


Conflict of interest statement

COMPETING INTERESTS E.E.E. is a scientific advisory board (SAB) member of Variant Bio, Inc. C.T.W. is a co-founder/CSO of Clareo Biosciences, Inc. W.L. is a co-founder/CIO of Clareo Biosciences, Inc. The other authors declare no competing interests.

Figures

Figure 1.
Figure 1.. Chromosomal-level assembly of complete great ape genomes.
a) A comparative ape alignment of human (HSA) chromosome 7 with chimpanzee (PTR), bonobo (PPA), gorilla (GGO), Bornean and Sumatran orangutans (PPY and PAB) shows a simple pericentric inversion in the Pongo lineage (PPY and PAB) and b) HSA chromosome 16 harboring complex inversions. Each chromosome is compared to the chromosome below in this stacked representation using the tool SVbyEye (https://github.com/daewoooo/SVbyEye). Regions of collinearity and synteny (+/blue) are contrasted with inverted regions (−/yellow) and regions beyond the sensitivity of minimap2 (homology gaps), including centromeres (red), subterminal/interstitial heterochromatin (purple), or other regions of satellite expansion (pink). A single transposition (green in panel b) relocates ~4.8 Mbp of gene-rich sequence in gorilla from human chromosome 16p13.11 to human chromosome 16p11.2. c) Distribution of assembled satellite blocks for centromere (alpha) and subterminal heterochromatin including, African great ape’s pCht or siamang’s (SSY) α-satellite, shows that subterminal heterochromatin are significantly longer in ape species possessing both heterochromatin types (One-sided Wilcoxon ranked sum test; **** p< 0.0001; *** p< 0.001). d) Schematic of the T2T siamang genome highlighting segmental duplications (Intra SDs; blue), inverted duplications (InvDup; green), centromeric, subterminal and interstitial α-satellites (red), and other satellites (pink).
Figure 2.
Figure 2.. Genome resource improvements.
a) Improvement in the ancestral allele inference by Cactus alignment over the Ensembl/EPO alignment of the T2T ape genomes. b) Genome-wide distribution of 1 Mbp single-nucleotide variant (SNV)/gap divergence between human and bonobo (PPA)/chimpanzee (PTR) genomes. The purple vertical lines represent the median divergence observed. The horizontal dotted arrows highlight the difference in SNV vs. gap divergence. The black vertical lines represent the median of allelic divergence within species. c) Total repeat content of ape autosomes and the primary genome including chrX and Y. d) Total base pairs of previously unannotated VNTR satellite annotations added per species. The color of each dot indicates the number of newly annotated satellites, out of 159, which account for more than 50 kbp in each assembly. (Table Repeat S2). e) Demographic inference. Black and red values refers to speciation times and effective population size (Ne), respectively. For Ne, values in inner branches refer to TRAILS estimates, while that of terminal nodes is predicted via msmc2, considering the harmonic mean of the effective population size after the last inferred split. f) (Left) Species-specific Alu, SVA and L1 MEI counts normalized by millions of years (using speciation times from (2e)). (Right) Species-specific Full-length (FL) L1 ORF status. The inner number within each circle represents the absolute count of species-specific FL L1s. g) Species-specific ERV comparison shows that the ERV increase in gorilla and chimpanzee lineages is due primarily to PTERV1 expansions.
Figure 3.
Figure 3.. IG and MHC genome organization in apes.
a) Annotated haplotypes of IGH, IGK and IGL loci across four primate species and one human haplotype (HSA.h1 or T2T-CHM13). Each haplotype is shown as a line in the genome diagram where the top part shows positions of shared V genes (blue), ape-specific V genes (red), D genes (orange), and J genes (green) and the bottom part shows segmental duplications (SDs) that were computed for a haplotype pair of the same species and depicted as dark blue rectangles. Human SDs were computed with respect to the GRCh38.p14 reference. Alignments between pairs in haplotypes are shown as links colored according to their percent identity values: from blue (<90%) through yellow (99.5%) to red (100%). The bar plot on the right from each genome diagram shows counts of shared and ape-specific V genes in each haplotype. b and c) show schematic representation of MHC locus organization for MHC-I and MHC-II genes, respectively, across the six ape haplotypes (PTR.h1/h2, PPA.h1/h2, GGO.h1/h2, PPY.h1/h2, PAB.h1/h2, SSY.h1/2) and human (HSA.h1). Only orthologs of functional human HLA genes are shown. Loci naming in apes follows human HLA gene names (HSA.h1), and orthologs are represented in unique colors across haplotypes and species. Orthologous genes that lack a functional coding sequence are grayed out and their name marked with an asterisk. One human HLA class I pseudogene (HLA-H) is shown, because functional orthologs of this gene were identified in some apes. d) Pairwise alignment of the 5.31 Mbp MHC region in the genome, with human gene annotations and MHC-I and MHC-II clusters. Below is the variation in phylogenetic tree topologies according to the position in the alignment. The x-axis is the relative coordinate for the MHC region and the y-axis shows topology categories for the trees constructed. The three prominent sub-regions with highly discordant topologies are shown through shaded boxes. Four sub-regions (1–4) used to calculate coalescence times are shown with dashed boxes.
Figure 4.
Figure 4.. Great ape inversions and evolutionary rearrangements.
a) Alignment plot of gorilla chr18p and human chr16p shows a 4.8 Mbp inverted transposition (yellow). SDs are shown with blue rectangles. b) Experimental validation of the gorilla chr18 inverted transposition using FISH with probes pA (CH276–36H14) and pB (CH276–520C10), which are overlapping in human metaphase chromosomes. The transposition moves the red pB probe further away from the green pA probe in gorilla, resulting in two distinct signals. FISH on metaphase chromosomes using probe pC (RP11–481M14) confirms the location of a novel inversion to the p-ter of PAB chr2. c) An evolutionary model for the generation of the inverted transposition by a series of inversions mediated by SDs. d) Alignment plot of orangutan chromosome 2 homologs to human chromosome 3 highlights a more complex organization than previously known by cytogenetics: a novel inversion of block 5A is mapping at the p-ter of both chr2 in PAB and PPY. e) A model of serial inversions requires three inversions and one centromere repositioning event (evolutionary neocentromere; ENC) to create PPY chromosome 2, and four inversions and one ENC for PAB. Red asterisks show the location of SDs mapping at the seven out of eight inversion breakpoints.
Figure 5.
Figure 5.. Divergent regions of the ape genomes.
a) HAQER (human ancestor quickly evolved region) sets identified in gapped (GRCh38) and T2T assemblies show enrichments for bivalent gene regulatory elements across 127 cell types and tissues, with the strongest enrichment observed in the set of HAQERs shared between the two analyses (top). The tendency for HAQERs to occur in bivalent regulatory elements (defined using human cells and tissues) is not present in the sets of bonobo, chimpanzee, or gorilla AQERs (ancestor quickly evolved regions; bottom). b) AQERs are enriched in SVAs, simple repeats, and SDs, but not across the general classes of SINEs, LINEs, and LTRs (left). With T2T genomes, the set of HAQERs defined using gapped genome assemblies became even more enriched for simple repeats and SDs (right).c) HAQERs in a vocal learning-associated gene, ADCYAP1 (adenylate cyclase activating polypeptide 1), are marked as containing alternative promoters (TSS peaks of the FANTOM5 CAGE analysis), candidate cis-regulatory elements (ENCODE), and enhancers (ATAC-Seq peaks). For the latter, humans have a unique methylated region in layer 5 extra-telencephalic neurons of the primary motor cortex. Tracks are modified from the UCSC Genome Browser above the HAQER annotations and the comparative epigenome browser below the HAQER annotations. d) Lineage-specific structurally divergent regions (SDRs). SDRs are detected on two haplotypes and classified by different genomic content. The average number of total bases was assigned to the phylogenetic tree.
Figure 6.
Figure 6.. Organization and sequence composition of the ape acrocentric chromosomes.
a) Sequence identity heatmaps and satellite annotations for the NOR+ short arms of both HSA22 haplotypes across all the great apes, and siamang chr21 (the only NOR+ chromosome in siamang) drawn with ModDotPlot. The short arm telomere is oriented at the top of the plot, with the entirety of the short arm drawn to scale up to but not including the centromeric α-satellite. Heatmap colors indicate self-similarity within the chromosome, and large blocks indicate tandem repeat arrays (rDNA and satellites) with their corresponding annotations given in between. Human is represented by the diploid HG002 genome. b) Estimated number of rDNA units per haplotype (hap) for each species. HSA numbers are given in the first column, with the exception of “s-21” for siamang chr21, which is NOR+ but has no single human homolog. c) Sum of satellite and rDNA sequence across all NOR+ short arms in each species. “unlabeled” indicates sequences without a satellite annotation, which mostly comprise SDs. Total SD bases are given for comparison, with some overlap between regions annotated as SDs and satellites. d) Top tracks: chr22 in the T2T-CHM13v2.0 reference genome displaying various gene annotation metrics and the satellite annotation. Bottom tracks: For each primate haplotype, including the human HG002 genome, the chromosome that best matches each 10 kbp window of T2T-CHM13 chr22 is color coded, as determined by MashMap. On the right side of the centromere (towards the long arm), HSA22 is syntenic across all species; however, on the short arm synteny quickly degrades, with very few regions mapping uniquely to a single chromosome, reflective of extensive duplication and recombination on the short arms. Even the human HG002 genome does not consistently align to T2T-CHM13 chr22 in the most distal (left-most) regions.
Figure 7.
Figure 7.. Assembly of 237 NHP centromeres reveals variation in α-satellite HOR array size, structure, and composition.
a) Sequence and structure of α-satellite HOR arrays from the human (T2T-CHM13), bonobo, chimpanzee, gorilla, Bornean orangutan, and Sumatran orangutan chromosome 1–5 centromeres, with the α-satellite suprachromosomal family (SF) indicated for each centromere. The sequence and structure of all completely assembled centromeres is shown in Fig. CENSATS1. b) Variation in the length of the α-satellite HOR arrays for NHP centromeres. Bonobo centromeres have a bimodal length distribution, with 28 chromosomes showing “minicentromeres” (with α-satellite HOR arrays <700 kbp long). c) Correlation between the length of the bonobo active α-satellite HOR array and the length of the CDR for the same chromosome. d) Example showing that the bonobo and chimpanzee chromosome 1 centromeres are divergent in size despite being from orthologous chromosomes. e) Sequence identity heatmap between the chromosome 17 centromeres from bonobo and chimpanzee show a common origin of sequence as well as the birth of new α-satellite HORs in the chimpanzee lineage. f) Sequence identity heatmap between the chromosome 5 centromeres from the Bornean and Sumatran orangutans show highly similar sequence and structure, except for one pocket of α-satellite HORs that is only present in the Bornean orangutan. *, p < 0.05; n.s., not significant.
Figure 8.
Figure 8.. Subterminal heterochromatin analyses.
a) Overall quantification of subterminal pCht/α-satellites in the African great ape and siamang genomes. The number of regions containing the satellite is indicated below the species name. The pChts of diploid genomes are quantified by Mbp, for ones located in p-arm, q-arm, and interstitial, indicated by orange, green, and purple. Organization of the subterminal satellite in b) gorilla and c) pan lineages. The top shows a StainedGlass alignment plot indicating pairwise identity between 2 kbp binned sequences, followed by the higher order structure of subterminal satellite unit, as well as the composition of the hyperexpanded spacer sequence and the methylation status across the 25 kbp up/downstream of the spacer midpoint. d) Size distribution of spacer sequences identified between subterminal satellite arrays. e) Methylation profile of the subterminal spacer SD sequences compared to the interstitial ortholog copy.
Figure 9.
Figure 9.. Ape SD content and new genes.
a) Comparative analysis of primate SDs comparing the proportion of acrocentric (purple), interchromosomal (red), intrachromosomal (blue), and shared inter/intrachromosomal SDs (gray). The total SD Mbp per genome is indicated above each histogram with the colored dashed lines showing the average Asian, African great ape, and non-ape SD (MFA=Macaca fascicularis; see Fig.SD.S2 for additional non-ape species comparison). b) A violin plot distribution of pairwise SD distance to the closest paralog where the median (black line) and mean (dashed line) are compared for different apes (see Fig. SD.S3 for all species and haplotype comparisons). An excess of interspersed duplications (p<0.001 one-sided Wilcoxon rank sum test) is observed for chimpanzee and human when compared to orangutan. c) Alignment view of chr1 double inversion. Alignment direction is indicated by + as gray and – as yellow. SDs as well as those with inverted orientations are indicated by blue rectangles and green arrowheads. The locations in which the JMJD7-PLA2G4B gene copy was found are indicated by the red arrows. d) duplication unit containing three genes including JMJD7-PLA2G4B. e) Multiple sequence alignment of the translated JMJD7-PLA2G4B. Match, mismatch and gaps are indicated by blue, red and white. Regions corresponding to each of JMJD7 or PLA2G4B are indicated by the track below. f) Alignment view of chr16q. The expansion of GOLGA6/8, HERC2, and MCTP2 genes are presented in the top track. 16q recurrent inversion breakpoints are indicated in the human genome. The track at the bottom indicates the gene track with GOLGA8 human ortholog in red. g) Multiple sequence alignment of the translated GOLGA8.

References

    1. US DOE Joint Genome Institute, Initial sequencing and analysis of the human genome. Nature 409, 860–921 (2001). - PubMed
    1. Venter J. C. et al. The sequence of the human genome. science 291, 1304–1351 (2001). - PubMed
    1. Blanchette M., Green E. D., Miller W. & Haussler D. Reconstructing large regions of an ancestral mammalian genome in silico. Genome research 14, 2412–2423 (2004). - PMC - PubMed
    1. Sequencing Chimpanzee and Consortium Analysis, A. Initial sequence of the chimpanzee genome and comparison with the human genome. Nature 437 (2005). - PubMed
    1. Gordon D. et al. Long-read sequence assembly of the gorilla genome. Science 352, aae0344 (2016). - PMC - PubMed

Publication types