[Preprint]. 2024 Jul 31:2024.07.30.605703.
doi: 10.1101/2024.07.30.605703.

Unraveling cysteine deficiency-associated rapid weight loss

Affiliations

Unraveling cysteine deficiency-associated rapid weight loss

Alan Varghese et al. bioRxiv. .

Update in

  • Unravelling cysteine-deficiency-associated rapid weight loss.
    Varghese A, Gusarov I, Gamallo-Lana B, Dolgonos D, Mankan Y, Shamovsky I, Phan M, Jones R, Gomez-Jenkins M, White E, Wang R, Jones DR, Papagiannakopoulos T, Pacold ME, Mar AC, Littman DR, Nudler E. Varghese A, et al. Nature. 2025 Jul;643(8072):776-784. doi: 10.1038/s41586-025-08996-y. Epub 2025 May 21. Nature. 2025. PMID: 40399674 Free PMC article.

Abstract

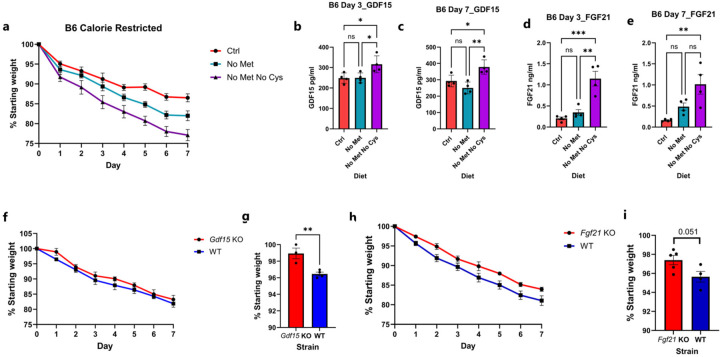
Forty percent of the US population and 1 in 6 individuals worldwide are obese, and the incidence of this disease is surging globally1,2. Various dietary interventions, including carbohydrate and fat restriction, and more recently amino acid restriction, have been explored to combat this epidemic3-6. We sought to investigate the impact of removing individual amino acids on the weight profiles of mice. Compared to essential amino acid restriction, induction of conditional cysteine restriction resulted in the most dramatic weight loss, amounting to 20% within 3 days and 30% within one week, which was readily reversed. This weight loss occurred despite the presence of substantial cysteine reserves stored in glutathione (GSH) across various tissues7. Further analysis demonstrated that the weight reduction primarily stemmed from an increase in the utilization of fat mass, while locomotion, circadian rhythm and histological appearance of multiple other tissues remained largely unaffected. Cysteine deficiency activated the integrated stress response (ISR) and NRF2-mediated oxidative stress response (OSR), which amplify each other, leading to the induction of GDF15 and FGF21, hormones associated with increased lipolysis, energy homeostasis and food aversion8-10. We additionally observed rapid tissue coenzyme A (CoA) depletion, resulting in energetically inefficient anaerobic glycolysis and TCA cycle, with sustained urinary excretion of pyruvate, orotate, citrate, α-ketoglutarate, nitrogen rich compounds and amino acids. In summary, our investigation highlights that cysteine restriction, by depleting GSH and CoA, exerts a maximal impact on weight loss, metabolism, and stress signaling compared to other amino acid restrictions. These findings may pave the way for innovative strategies for addressing a range of metabolic diseases and the growing obesity crisis.


Conflict of interest statement

Conflicts of Interest D.R.L consults for and has equity interest in Vedanta Bioscience, Sonoma Immunotherapeutics, Immunai, IMIDomics, and Pfizer, Inc.

Figures

Extended Data Fig. 1:
Extended Data Fig. 1:. Further characterization of cysteine-induced weight loss.
a, Het and b, KO weight curves with various essential amino acid deficiencies (n>=4). c-e, KO on various essential amino acid deficiencies by class: c, Branched chain amino acids; d, Aromatic amino acids; e, Other EAAs. f, Weight curves of WT compared to Cse Het and KO mice on No Cys diet. Weight loss curves of Cse KO on No Cys plotted individually by g, percentage h, mass i, Weight loss curves by percentage plotted according to different starting weights (n≥5 in all groups) j, Percentage weight loss at Day 7 on a No Cys diet for Cse KO plotted against starting mass k, Weight loss curves of male vs female Cse KO mice on a No Cys diet (n=9)
Extended Data Figure 2:
Extended Data Figure 2:. Effect of other sulfur containing molecules on weight loss.
a, Weight curves of Het and KO mice on a No Cys diet with either 0.4% NAC or 1% GSH in drinking water (n=4). b, Weight curves of mice on a No Cys diet with or without daily injections of 40 mg/kg of GYY4137 (n=2). c, Weight curves on a No Cys diet with and without antibiotic treatment (1 g/L Ampicillin) (n=3). d, Weight curves of mice on a No Met No Cys (Het) compared to No Cys, No Met, or control diets (Cse KO) (n=4). Hets and KOs mice were co-housed for each experimental condition.
Extended Data Figure 3:
Extended Data Figure 3:. Nutrient absorption is not affected by No Cys diet in Cse KO.
a, Amino acid levels in the administered diet and in Het or KO stool from microbiota-depleted mice fed No Cys diet for 3 days. b, Vitamins and palmitic acid levels c, Glucose levels in stools of mice on Day 3 of No Cys diet (n=3).
Extended Data Fig. 4:
Extended Data Fig. 4:. Gross histology of skeletal muscle and liver.
a,b, Representative visceral fat image of Het (a) and KO (b) mice on No Cys diet after 3 days (n=4). c-f, Representative H&E staining of skeletal muscle (quadriceps) (c,d) and liver (e,f) from Het (c,e) and KO (d,f) mice on Days 3 and 7 of calorically restricted Ctrl or No Cys diets (n=4).
Extended Data Fig. 5:
Extended Data Fig. 5:. Transcriptional response to cysteine deficiency.
a, GO enrichment categories from liver comparing Het and KO mice on No Cys diet. b, Gdf15 RFPKM values from liver across all groups. c, Fgf21 RFPKM values from liver across all groups. d, GO enrichment categories from muscle comparing Het and KO mice on No Cys diet. e-g, Muscle bulk RNA-Seq data represented as heatmap for genes in oxidative stress, cellular metabolic process, branched chain amino acid metabolism, NAD, and pantetheinase that are upregulated (e), for genes in extracellular organization and animal organ development that are specifically downregulated (f), and for genes in the ISR that appear minimally affected (g) in No Cys KO mice at Day 2. h, GO enrichment categories from epididymal fat pad comparing Het and KO mice on No Cys diet. i, Ucp1 RFPKM values from epididymal fat pad. All data are at Day 2 based on mice shown in the RNA-seq schematic in Figure 3a. For GO enrichment table, Red indicates upregulated in KO and blue indicates downregulated.
Extended Data Fig. 6:
Extended Data Fig. 6:. Effect of cysteine restriction on tissue GSH, serum GDF15 and FGF21 levels.
a-e, GSH levels in liver (a), muscle (b) and subcutaneous fat pad (c) GDF15 (d) and FGF21 (e) levels in serum from Cse Het and KO mice on Day 2 of CR diets without Cys or Trp or Ctrl diet.
Extended Data Figure 7:
Extended Data Figure 7:. Effect of Cysteine and methionine dual restriction on wild type C57BL/6 mice.
a, Weight loss curves of calorie restricted (2.1 g/day) male mice on Ctrl, No Met or No Met No Cys diet (n=4). b, Serum GDF15 levels across all three conditions on Day 3 or c, Day 7. Serum FGF21 levels across all three conditions on d, Day 3 or e, Day7 (n=4). f, Weight loss curves of male Gdf15 KO or WT mice on No Met No Cys diet (n≥3) g, Weight after one day of No Met No Cys diet in Gdf15 KO or WT mice h, Weight loss curves of female Fgf21 KO or WT mice on No Met No Cys diet (n≥4) i, Weight after one day of No Met No Cys diet in Fgf21 KO or WT mice.
Extended Data Figure 8:
Extended Data Figure 8:. Effect of liver specific Cse expression on rescuing weight loss in cysteine-deficient mice.
a, Experimental scheme. b, Weight loss curves of Cse Het or KO mice infected with AAV8-TBG-EGFP or AAV8-TBG-CSE on a No Cys diet. c-e, Levels at day 7 of GSH (d) and FFA (e) in liver and TG in serum (f) across all 4 groups (n≥3).
Extended Data Fig. 9:
Extended Data Fig. 9:. Metabolite differences in liver and urine of Cse Het and KO mice on No Cys diet.
a, Select metabolites from liver (n=3) and urine (n>=6) of KO mice, normalized to levels in Het mice. b, Glycolysis and TCA cycle pathway metabolites represented with data from liver (n=3) and urine (n>=6) c, Urea cycle and pyrimidine metabolism pathway metabolite profiles represented with data from liver (n=3) and urine (n>=6). Red is higher in KO and Blue is lower. Yellow and blue boxes indicate metabolites that are elevated or reduced, respectively, in urine of KO mice. d, Carnitine and CoA metabolism model to explain excess Acyl-carnitines detected in urine.
Extended Data Figure 10:
Extended Data Figure 10:. 13C-Glucose tracing in Cse het and KO mice on Cys-deficient CR diet.
a, Scheme of 13C glucose tracing experiment (n=4 for liver, n≥4 for urine, all males). b, Pathway depicting the formation of heavy carbon labeled metabolites from m+6 glucose. c, Levels of m+3 lactate in Cse Het or KO mice at 45 minutes in liver d, Levels of m+3 orotate in Urine at 2h in Cse Het or KO mice. e and f, Levels of guanidoacetate m+2 in liver (e) at 45 minutes and urine (f) at 2h in Het or KO mice. g and h, Levels of creatine m+2 in liver (g) at 45 minutes and urine (h) at 2h in Het or KO mice. i, Expression of Ckmt1 and Ckm in epididymal fat of Cse Het and KO mice on No Cys diet (see also Supplementary table 4) (n≥3) j, Peak energy expenditure (EE) at Day 3 of a No Cys diet normalized to body weight, subsequently normalized to Het data (n≥7). k, Creatine levels in liver at Day 6 on a No Cys diet in Het and KO mice (n≥4).
Extended Data Fig. 11:
Extended Data Fig. 11:. Cse KO mice become more dependent on glycolysis when subjected to a No Cys diet.
Seahorse cell energy phenotype assay and basal OCR of CD4 T cells isolated from Cse Het and KO mice on a, Ctrl or No Cys diet b, No Trp diet for 7 days. c, d, O2 consumption of Cse Het and KO mice restricted to 10% galactose as energy source and fed a (c) control diet (n=4) or (d) a No Cys diet compared to a No Trp diet (n=2) as per scheme in Fig 5g.
Extended Data Fig. 12:
Extended Data Fig. 12:. Volcano plots of mitochondrial complex genes across both RNA-seq experiments.
Data points are based on liver bulk RNA-Seq data shown in Figures 3 and 4 (n>=3). Colors represent genes encoding proteins in each of the complexes of the electron transport chain.
Extended Data Figure 13:
Extended Data Figure 13:. Role of CoA in weight recovery.
a, Liver and b, Muscle GSH levels at Day 14 of experiment in Fig 5l (n=5) c, Weight loss curves of female Cse KO mice on No Cys diet for 7 days, followed by either 7 days on Ctrl diet or Vit-B5 (Pan) free diet followed by 7 days on a Ctrl diet or a Vit-B5 free diet with supplemented with 280 mg/ml of Vit-B5 (Pan) (n=4).
Fig. 1:
Fig. 1:. Cysteine deficiency drives rapid weight loss.
a, A simplified cartoon demonstrating the pathways for Cys synthesis (blue) and consumption (reversible – green and irreversible – brown). CSE deletion marked by red cross. GSH synthesis inhibitor BSO shown in purple. b, Average percentage weight loss (from starting weight) with removal of each essential amino acid and cysteine in male Het and KO mice after 1 week (n>=4 for each group). c, Daily weight curves of male Het and KO mice fed control (Ctrl) or No Cys diets at 22 °C housing (n=4). d, Cse KO weight curves of mice deprived of isoleucine, valine, or cysteine at 30 °C (n=4) e, Daily food consumption of Het or KO mice with Ctrl or No Cys diets (n=3). f, Caloric restriction of 2.1 g/day (CR) of male Het and KO mice with control 5CC7 and No Cys diets (n=4). g, Average percentage weight loss unaccounted for by reduced food consumption (including data from PMID: 22016194 for Iso and Val, 34800493 for Trp and Phe), h, Weight of male B6 mice on CR with No Met No Trp compared to No Met No Cys (n=4). i, Weight curves of male Het or KO mice over cycles of No Cys diet versus standard chow 5053 (n=4).
Fig. 2:
Fig. 2:. Cysteine deficiency drives rapid metabolic changes and loss of white adipose tissue mass.
Metabolic cage profiles of male CR Cse Het and KO mice (n=4) for a, Experimental design b, Weight measurements c, Locomotor activity d, Respiratory exchange ratio e, DEXA comparing adipose tissue mass at ad-libitum and CR with cysteine-free (No Cys) diet and control (Ctrl) diets ad libitum at Day 7 (n=4). f-h, Representative images (n=4) of subcutaneous fat pads on CR. f, Male Het or KO on Ctrl or No Cys diets stained by H&E at day 3 and 7 imaged g, Immunohistochemistry of Caspase 3 on Day 7 and h, UCP1 on days 3 and 7 of cysteine restriction.
Fig. 3:
Fig. 3:. Changes in gene expression during cysteine deficiency compared to tryptophan deficiency.
a, Experimental design for bulk RNA sequencing b-c, Liver bulk RNA-seq data represented as heatmap for genes related to ISR and OSR that are specifically upregulated in KO No Cys (AA, amino acids) (b), cholesterol and lipid synthesis and degradation (c) d-e, Heat map of genes that are specifically up- or down-regulated in epididymal adipose tissue in KO No Cys mice, including genes related to, lipid, thiol, and small molecule metabolism (d), and extracellular organization, biosynthetic pathways in small molecules, AA, fatty acids and sterols (e).
Fig. 4:
Fig. 4:. General EAA deficiency coupled with a deficiency in GSH partially phenocopies cysteine deficiency.
a, GSH levels in liver and muscle of CR male Het and KO at Day 2 on a No Cys diet (n=4, n≥3). b, Representative IHC staining (of n=4) of NRF2 and NQO1 in liver of Het and KO mice on CR No Cys diet at Day 3. c, P-eIF2α/ eIF2α ratio in Het and KO mice on CR No Cys diet at Day 2 (n≥5). d, GDF15 and e, FGF21 serum level at Day 2 of CR No Cys diet (n≥7 for GDF15, n≥4 for FGF21). f, Acetyl-CoA carboxylase 1 (ACC1) protein levels normalized to β-tubulin in Het and KO No Cys at Day 2 on CR No Cys diet (n≥4).g, FFA and h, TG and serum levels at Day 2 of CR No Cys diet (n≥5 for FFA and TG)i, Weight measurements of Cse Het and KO mice on different diets (n>=4 in each group). j,k, Bulk liver RNA-seq data for multiple groups represented as heatmap for genes in Integrated Stress response and oxidative stress responses (g), and those related to cholesterol and lipid metabolism (h). l-o, P-eIF2α/ eIF2α ratio in liver (l), liver GSH (m), ACC1 protein levels normalized to β-actin (n), and serum GDF15 (o) in calorie-restricted KO No Cys compared to KO No Trp + BSO mice at Day 2 (n≥4 for all). p, Summary of effects in KO mice by No Trp, No Cys and No Trp+BSO diets.
Fig. 5:
Fig. 5:. Cysteine deficiency leads to metabolic inefficiency by depleting CoA.
a, Structure of CoA and pathways of CoA production and degradation. The red cross depicts how Cys deficiency would inhibit CoA biosynthesis and subsequent pathways involving it. b-d, CoA levels in liver (b) and muscle (c) at day 2 and liver at Day 6 (d) from Cse Het and KO mice on a No Cys diet (n≥3 for all groups) e, Select metabolite levels from urine and liver represented as log2 fold change between KO No Cys and Het No Cys (n≥6 for urine, n=3 for liver), AA: amino acids; KB: ketone bodies. Metabolites have p-values of less than 0.05 in either urine or liver except for 3-Hydroxybutyrate (p-value=0.0891). f, Liver glycolysis intermediate accumulation in KO compared to Het mice at Day 2 on CR No Cys. Red indicates up in KO with p-value<0.05. Number in bracket denotes log2-fold change (n=3). g, O2 consumption by mice provided Galactose or Glucose as sole carbon source after feeding No Cys diet (n=4). The experimental strategy is shown on the left. h, Weight measurements of male Cse Het and KO mice on No Pantothenic acid (No B5) diet or No Pantothenic and No Cys diets (n=4). i, Vnn1 mRNA expression levels in muscle and epidydimal tissue from bulk RNA-seq data (as shown in Fig. 3a). j, Urine pantothenic acid levels in Cse Het and KO mice on CR No Cys diet at Day 2. k, Summary of expected levels of various cysteine-containing metabolites under different conditions l, Weight measurements of male Cse KO mice after 7 days on a No Cys diet followed by 7 days on either a control diet or a No B5 diet (n=5) m, Liver and n, Muscle CoA levels in mice on Day 14 of the experiment shown in l. o, Model summary of the effect of cysteine deficiency on metabolic pathways and weight loss.

References

    1. Collaboration, N. C. D. R. F. Trends in adult body-mass index in 200 countries from 1975 to 2014: a pooled analysis of 1698 population-based measurement studies with 19.2 million participants. Lancet 387, 1377–1396 (2016). 10.1016/S0140-6736(16)30054-X - DOI - PMC - PubMed
    1. Stierman B., A. J.; Carroll M. D.; Chen T. C.; Davy O.; Fink S.; Fryar C. D.; Gu Q.; Hales C. M.; Hughes J. P.; Ostchega Y.; Storandt R. J.; Akinbami L. J.. National health and nutrition examination survey 2017–march 2020 prepandemic data files-development of files and prevalence estimates for selected health outcomes. National Health Statistics Reports (2021). - PMC - PubMed
    1. Fontana L. et al. Decreased Consumption of Branched-Chain Amino Acids Improves Metabolic Health. Cell reports 16, 520–530 (2016). 10.1016/j.celrep.2016.05.092 - DOI - PMC - PubMed
    1. Samaha F. F. et al. A low-carbohydrate as compared with a low-fat diet in severe obesity. The New England journal of medicine 348, 2074–2081 (2003). 10.1056/NEJMoa022637 - DOI - PubMed
    1. Stolt E. et al. Sulfur amino acid restriction, energy metabolism and obesity: a study protocol of an 8-week randomized controlled dietary intervention with whole foods and amino acid supplements. Journal of translational medicine 19, 153 (2021). 10.1186/s12967-021-02824-3 - DOI - PMC - PubMed

Publication types

LinkOut - more resources