[Preprint]. 2024 Oct 14:2024.08.02.606406.
doi: 10.1101/2024.08.02.606406.

Mechanochemical forces regulate the composition and fate of stalled nascent chains

Affiliations

Mechanochemical forces regulate the composition and fate of stalled nascent chains

Danish Khan et al. bioRxiv. .

Abstract

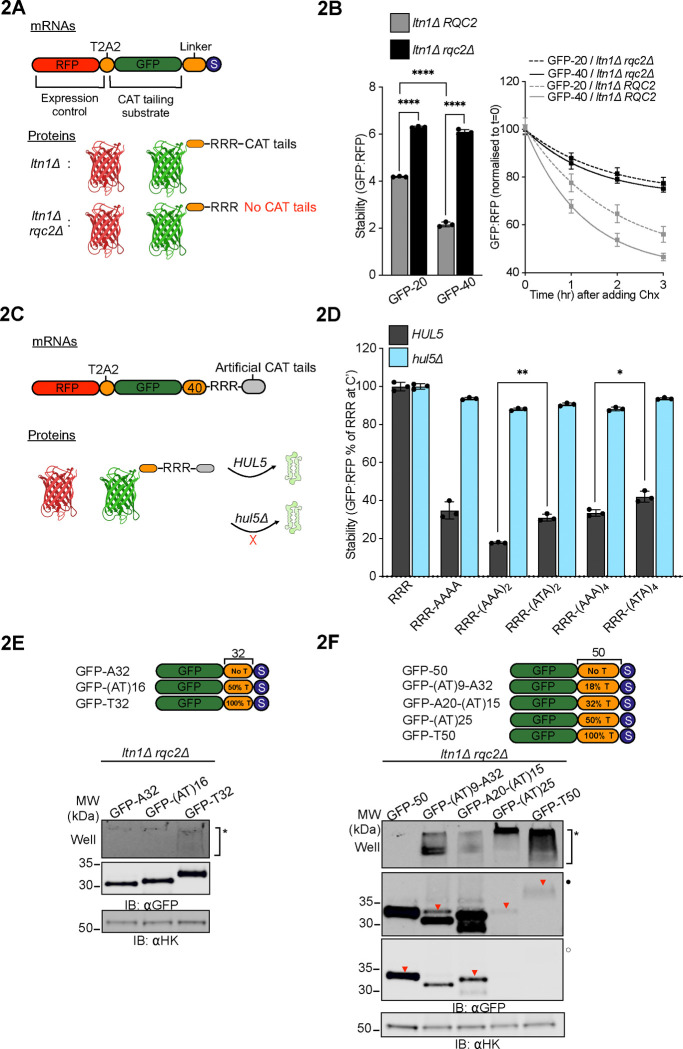
The ribosome-associated quality control (RQC) pathway resolves stalled ribosomes. As part of RQC, stalled nascent polypeptide chains (NCs) are appended with CArboxy-Terminal amino acids (CAT tails) in an mRNA-free, non-canonical elongation process. CAT tail composition includes Ala, Thr, and potentially other residues. The relationship between CAT tail composition and function has remained unknown. Using biochemical approaches in yeast, we discovered that mechanochemical forces on the NC regulate CAT tailing. We propose CAT tailing initially operates in an "extrusion mode" that increases NC lysine accessibility for on-ribosome ubiquitination. Thr in CAT tails enhances NC extrusion by preventing formation of polyalanine, which can form α-helices that lower extrusion efficiency and disrupt termination of CAT tailing. After NC ubiquitylation, pulling forces on the NC switch CAT tailing to an Ala-only "release mode" which facilitates nascent chain release from large ribosomal subunits and NC degradation. Failure to switch from extrusion to release mode leads to accumulation of NCs on large ribosomal subunits and proteotoxic aggregation of Thr-rich CAT tails.

Keywords: CAT tails; mechanochemistry; protein folding; protein quality control; ribosome; ribosome stalling; ribosome-associated quality control (RQC); translation.


Figures

Figure 1
Figure 1. CAT tails have diverse composition, degradation, and aggregation propensities.
(A) Schematic representation of the RQC pathway in yeast. Translational stalls cause ribosomes to collide and form disomes. Stalled disomes are recognized and the leading ribosome is split to generate a NC-tRNA-60S complex. Rqc2p recruits charged tRNA to the 60S as part of mRNA-free elongation of the NC with CAT tails. Ltn1p ubiquitylates the NC and Cdc48p extracts the ubiquitylated NC from the 60S ribosomal subunit. Both CAT tailing and ubiquitylation facilitate degradation of NC by the proteasome. Ub, ubiquitin. (B) Cartoon depicting two model RQC substrates, each fused to GFP via linkers (in orange) of lengths 20 and 40 amino acids followed by polyarginine stall sequence and stop codon (in navy blue). Whole cell immunoblots (IBs) of lysates containing model substrates expressed in different strains. SDS-insoluble aggregates near the well of the gel are indicated by asterisk (*). Filled (•) and empty (◦) dots represent different contrast levels for the same image throughout the figures. Red vertical bars on the right side of bands indicate CAT tails. (C) Maximum CAT tail lengths were quantified by calculating the upshift in molecular mass between ltn1Δ and ltn1Δrqc2Δ strains and dividing that by the average amino acid mass, 110 Da. Protein aggregation was quantified by densitometric analysis of the areas surrounding the wells in the SDS-PAGE gel for each reporter in the ltn1Δ background, with the results normalized relative to the aggregation observed in the ltn1Δrqc2Δ strain. (D) Total amino acid analysis of substrates GFP-40 (left) and GFP-20 (right) from strains that are CAT tailing competent (ltn1Δ) and CAT tailing incompetent (ltn1Δ rqc2Δ). Error bars indicate s.e.m. from n=3 independent experiments. (E) Fluorescence microscopy of cells expressing model RQC substrates. Exposure durations for ltn1Δ rqc2Δ cells were longer than for ltn1Δ cells. Percentages of cells with visible GFP inclusions were calculated from n=3 independent experiments with ~350 cells counted per experiment.
Figure 2
Figure 2. CAT tail sequence determines degradation and aggregation.
(A) Schematic of expression controlled mRNA constructs and expected protein products used in assays for steady state measurement of stability and cycloheximide chases. (B) Left, stability measurements for GFP-20 and GFP-40 substrates in cells with intact RQC2 (ltn1Δ) and lacking RQC2 (ltn1Δ rqc2Δ); data are reported as mean values. Right, normalized stability measurements for GFP-20 and GFP-40 in the ltn1Δ and ltn1Δ rqc2Δ backgrounds, over a 3 hour chase following a 200 μg/mL cycloheximide pulse. ****P < 0.0001, P values are derived from a two-tailed t-test. (C) Schematic of expression controlled mRNA constructs and expected protein products with hard coded CAT tails used in assays measuring stability in WT and HUL5-deficient (hul5Δ) cells. (D) Stability measurements of hard coded CAT tail constructs with the indicated C-terminal sequences in WT and hul5Δ cells. Data are presented as mean values, normalized to the construct containing only the RRR sequence in WT cells. Error bars indicate s.e.m. from at least three independent experiments (n ≥ 3). Stability levels between pairs of similar sized hard coded CAT tails in WT cells were compared via Student’s t test. **P < 0.01; *P < 0.05. R, arginine; A, alanine; T, threonine. (E-F) Cartoon depicting substrates with two distinct linker lengths, 32 and 50, each containing varying percentages of threonine residues (indicated as a proportion of total amino acids in the linker). Whole cell IBs of lysates prepared from non-CAT tailing ltn1Δ rqc2Δ cells expressing the indicated substrates. Inverted red triangles (▼) indicate the expected position for protein bands in SDS-PAGE/IBs.
Figure 3
Figure 3. Folding-induced mechanical forces on the NC determine CAT tail composition.
(A) Cartoon of RQC substrates with linkers of varying lengths (0, 20, 30, 40 and 50 amino acids) between GFP and a stalling sequence. The diagrams above IBs illustrate the predicted RNP-Rqc2p complex folding state for each RQC substrate in the stalled, pre-CAT tailing state. Arrowheads (➤) indicate readthrough products formed by bypassing the polyarginine arrest sequence. (B) Stacked bar graph showing the sum of linker and estimated maximum CAT tail length for each substrate in the ltn1Δ background. (C) Plot depicting the relative aggregation and maximum CAT tail length for each RQC substrate, normalized to the GFP-0 substrate, in the ltn1Δ background. Error bars indicate s.e.m from three biologically independent experiments. (D) Top, cartoons depicting the folded states of stalled NCs as part of the RNP-Rqc2p complex. Cells expressing GFP-40 were grown in media supplemented with DMSO (control), translation inhibitors, 1 mM AZC, or 200 μM canavanine for 3 hours to induce misfolding. Bottom, IBs showing changes in CAT tail lengths. (E) IBs of cells expressing RQC substrates containing WT and mutant versions of spectrin R16 protein. Top, structure of E. coli protein spectrin R16 showing the location of non-folding mutations (PDB: 5M6S). Middle, cartoon depicting RNP-Rqc2p complex with WT and misfolded spectrin R16 in the stalled, pre-CAT tailing state. Bottom, IBs showing CAT tails observed for WT, F11D and L55D variants of spectrin R16 with a 40-amino acid linker and R12 stalling sequence.
Figure 4
Figure 4. Extrinsic mechanical forces on the NC determine CAT tail sequence
(A) Schematic showing the organization of a NC-tRNA-60S-Rqc2p at the Sec61 translocon complex at ER (top) and in the cytoplasm (bottom). Dotted arrow indicates the direction of the pulling force. (B) Cartoons of ER-directed RQC substrate spGFP-20 with an N terminal signal peptide derived from carboxypeptidase Y, alongside cytosolic RQC substrates (no signal peptide). Cells expressing these RQC substrates were analyzed by immunoblot. Hash (#) and asterisk (✻) signs next to CAT tails denote long and short CAT tails respectively. Arrowhead (➤) indicates readthrough product formed after bypassing the polyarginine arrest sequence. (C) Densitometric analysis was used to quantify long and short CAT tailed species and are represented as a ratio (i.e. # to ✻) (See Supplementary File S2). Error bars indicate s.e.m. from n=3 independent experiments.***P <0.001; Student’s t-test. (D) Schematics showing the RQC role of CDC48 in different strain backgrounds. Top, in WT cells Cdc48p binds and extracts the ubiquitylated NC from the 60S for proteasomal degradation. Bottom, cells without the UMP1 gene exhibit impaired proteasome assembly and this stabilizes NCs that have been ubiquitylated by Ltn1p and pulled by Cdc48p. (E) GFP-20 reporter expressed in ump1Δ cells alongside WT, non-ubiquitylated (ltn1Δ) and non-CAT tailed (ltn1Δ rqc2Δ) controls. (F) Total amino acid analysis of immunoprecipitated GFP from ump1Δ cells and ltn1Δ rqc2Δ cells expressing GFP-20. Error bars indicate s.e.m. from n=3 independent experiments.
Figure 5
Figure 5. NC-60S exit tunnel interactions regulate CAT tail sequence
(A) Schematic of the 60S ribosome exit tunnel showing NC residues chosen for mutagenesis (in black) and the constriction site; outline of exit tunnel based on PDB: 5GAK. (B) Residue 224 of GFP-0 reporter, situated 15 amino acids upstream of stalling sequence, to residue 228 were mutated to five consecutive Lys or Asp and analyzed by immunoblots. (C) Residue 263 to 268 of GFP-40 reporter were mutated to Lys or Asp as indicated and analyzed by immunoblots. (D) Immunoblots of RQC reporter consisting of GFP and the polyarginine stalling sequence linked by a 40 amino acid sequence (S4) derived from the N terminus of the fourth transmembrane segment of a bacterial voltage-gated potassium channel. This peptide sequence is reported to be fully extended inside the ribosome exit tunnel 54,. Residue 263 was situated 15 amino acids upstream of the stalling sequence and residues indicated by X were mutated to Gln, Arg, Lys, Glu or Asp, as indicated.
Figure 6
Figure 6. Thr in CAT tails increases the efficiency of NC extrusion and termination of CAT tailing upon NC pulling
(A) Left, schematic representation of the 60S ribosomal subunit showing the ribosome occluded portion of the NC in extended and α-helix forms. In the extended form, the NC is stretched end-to-end. Formation of an α-helix compacts the NC inside the ribosomal exit tunnel, retracting the extra-ribosomal portion of the NC into the ribosome. Center, sequences of the constructs used in experiments below depicting forty C terminal amino acids of RQC reporters before CAT tailing. Right, the helix forming propensity of the forty C terminal amino acids are depicted, as calculated from AGADIR algorithm using these parameters: temperature, 298K; ionic strength, 0.2M; and pH 7.0. (B-C) Reporters expressed in ltn1Δ and ltn1Δrqc2Δ cells and analyzed by immunoblots, with schematics above each reporter showing the predicted structure of hard coded linkers (extended or α-helix) prior to CAT tailing (D-E) Reporters expressed in an ump1Δ background in addition to ltn1Δ and ltn1Δ rqc2Δ, analyzed by immunoblot as above.
Figure 7
Figure 7. CAT tails regulate NC retention and release
(A) Sucrose gradients of the GFP-40 reporter expressed in ltn1Δ cells with WT RQC2 and rqc2-D98A were analyzed by fluorescent polysome profiling. A background fluorescence peak at the 40S position is marked with a star (★) where visible (See Supplementary Figure S7A). (B) From the GFP fluorescence and RNA absorbance plot for each reporter/strain pair in (A), the areas covered by 60S and 80S local peaks were calculated (See methods). Error bars in computed values indicate s.e.m. from four independent experiments. **P < 0.01, Student’s t test. (C) Similar quantification was performed for GFP-S4(K) and GFP-S4(D) reporters expressed in ltn1Δ cells with WT RQC2, rqc2-D9A and rqc2-D98A. (See Supplementary Figures S7C–D for corresponding fluorescent polysome profiles) **P < 0.01; *P < 0.05; ns, not significant, Student’s t test. (D) Polysome profiles of lysates were prepared from ltn1Δ cells with WT RQC2, rqc2-D9A and rqc2-D98A after 8 hours of cycloheximide treatment. (E-F) Areas under the 60S, 80S and polysome peaks (up to tetrasomes) from the sucrose gradient profiles were quantified for each strain across three independent experiments. The ratio of areas covered by 60S and 80S peaks was plotted in (E); ratio of polysomes to 80S was plotted in (F). **P < 0.01; *P < 0.05; Student’s t test. (G) Equivalent number of yeast cells were spotted in 10-fold serial dilutions on YPD plates, with or without cycloheximide, and grown for 60 hrs before imaging. (H) Model for modes of CAT tailing and dysfunction. Left, in ‘extrusion mode’, lack of pulling force facilitates P-site tRNA (in pink) mobility and allows for incorporation of both Ala and Thr into CAT tails to extrude stalled NCs from the 60S exit tunnel into the extra-ribosomal space. Thr disfavors the formation of polyalanine α-helices that interfere with extrusion. NC extrusion increases the accessibility of NC lysines to Ltn1p and thus promotes ubiquitylation. Top right, after NC ubiquitylation, pulling by Cdc48p transmits a force along the NC that limits P-site tRNA mobility and switches CAT tailing to ‘release mode’. This leads to the addition of Ala-only CAT tails that aid in the release of the NC. Ala CAT tails act as degrons off the ribosome. Bottom right, the absence of pulling force leads to accumulation of RNP complexes and NCs with long, Thr-rich tails. These tails are inefficiently released, prone to aggregation, and function poorly as degrons. Ala-tRNA is shown in teal, Thr-tRNA in gold.

References

    1. Sitron C.S., and Brandman O. (2020). Detection and Degradation of Stalled Nascent Chains via Ribosome-Associated Quality Control. Annu. Rev. Biochem. 89, 417–442. 10.1146/annurev-biochem-013118-110729. - DOI - PMC - PubMed
    1. Yip M.C.J., and Shao S. (2021). Detecting and Rescuing Stalled Ribosomes. Trends Biochem. Sci. 46, 731–743. 10.1016/j.tibs.2021.03.008. - DOI - PMC - PubMed
    1. Howard C.J., and Frost A. (2021). Ribosome-associated quality control and CAT tailing. Crit. Rev. Biochem. Mol. Biol. 56, 603–620. 10.1080/10409238.2021.1938507. - DOI - PubMed
    1. Inada T., and Beckmann R. (2024). Mechanisms of Translation-coupled Quality Control. J. Mol. Biol. 436, 168496. 10.1016/j.jmb.2024.168496. - DOI - PubMed
    1. Brandman O., Stewart-Ornstein J., Wong D., Larson A., Williams C.C., Li G.-W., Zhou S., King D., Shen P.S., Weibezahn J., et al. (2012). A ribosome-bound quality control complex triggers degradation of nascent peptides and signals translation stress. Cell 151, 1042–1054. 10.1016/j.cell.2012.10.044. - DOI - PMC - PubMed

Publication types