[Preprint]. 2024 Jul 29:2024.07.28.605521.
doi: 10.1101/2024.07.28.605521.

Synergy and antagonism in the integration of BCR and CD40 signals that control B-cell proliferation

Affiliations

Synergy and antagonism in the integration of BCR and CD40 signals that control B-cell proliferation

Helen Huang et al. bioRxiv. .

Update in

Abstract

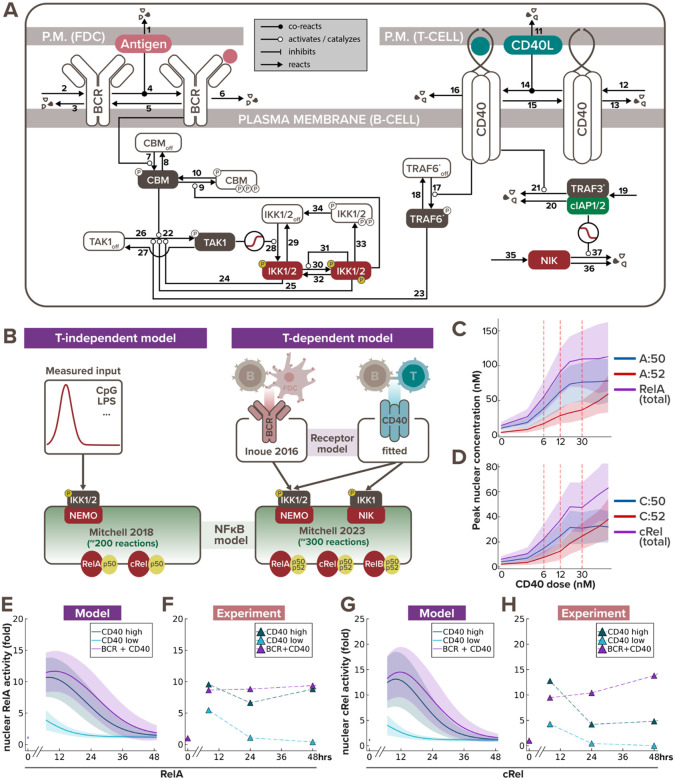
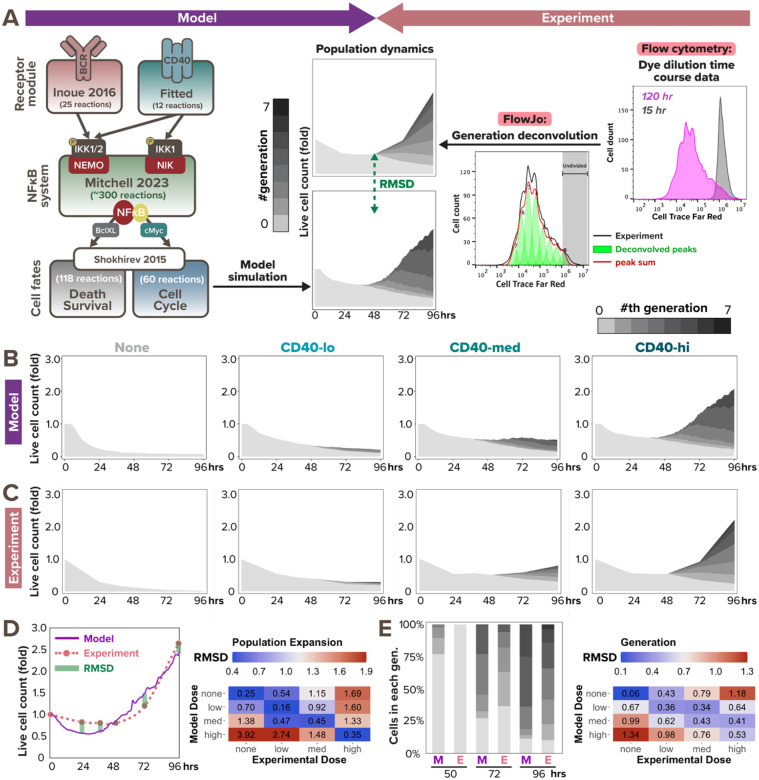
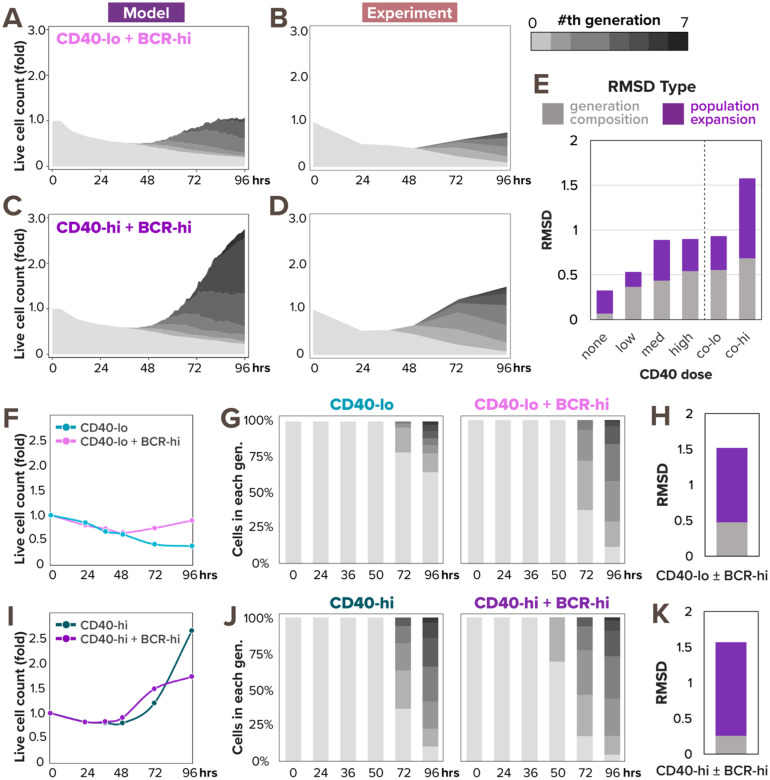
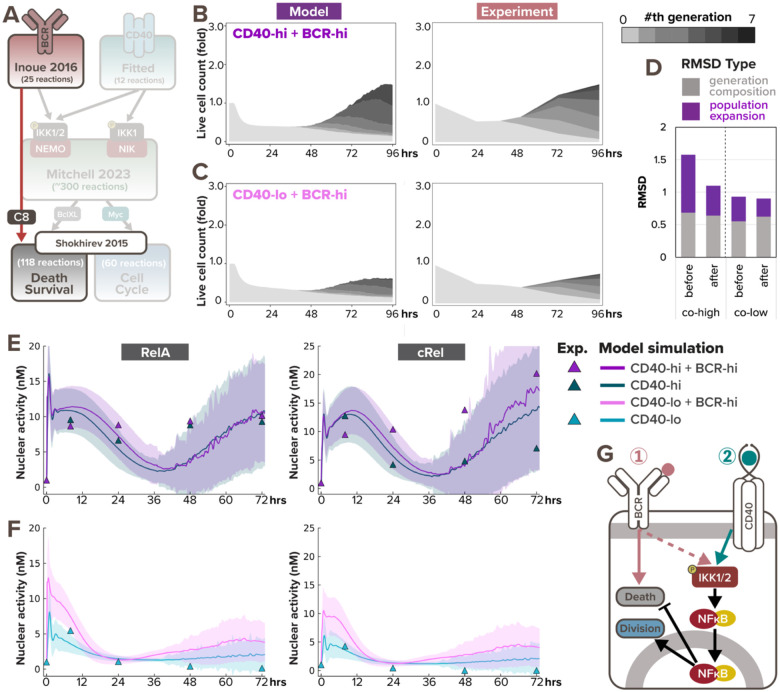
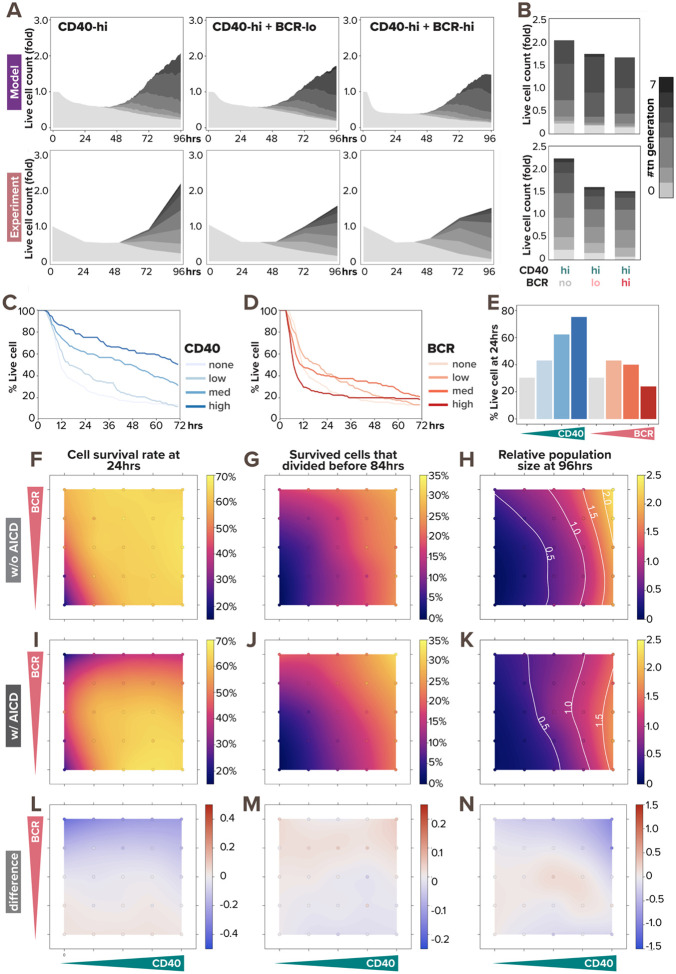
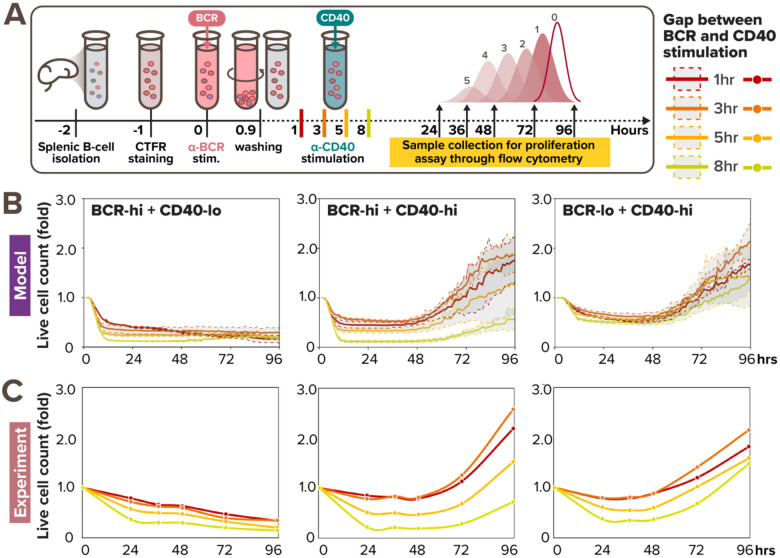
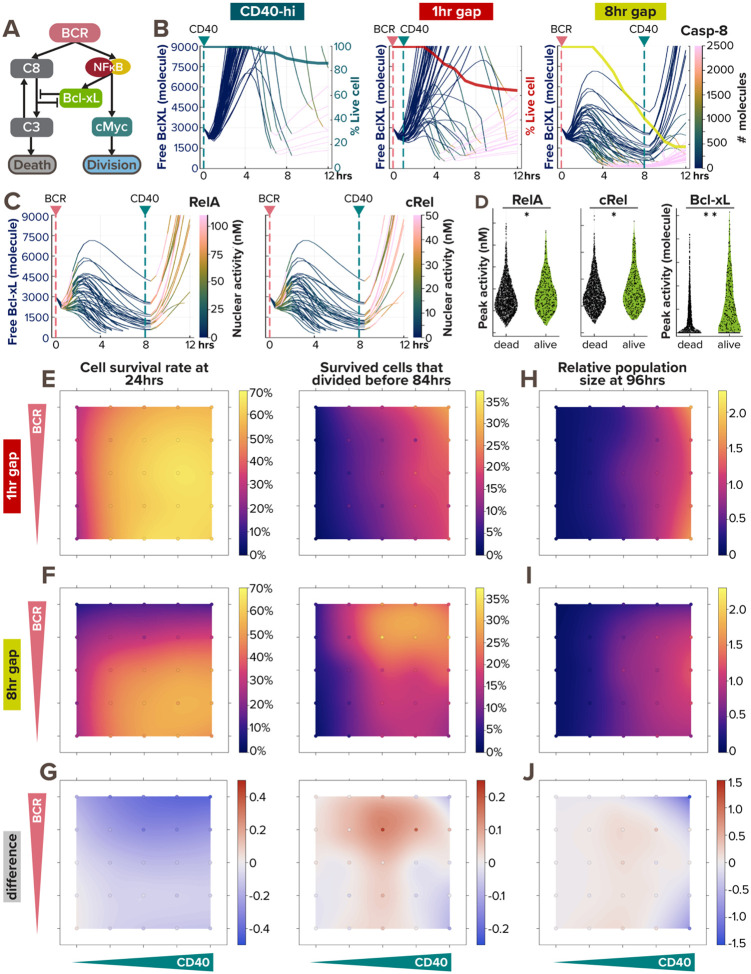
In response to infection or vaccination, a successful antibody response must enrich high-affinity antigen-reactive B-cells through positive selection, but eliminate auto-reactive B-cells through negative selection. B-cells receive signals from the B-cell receptor (BCR) which binds the antigen, and the CD40 receptor which is stimulated by neighboring T-cells that also recognize the antigen. How BCR and CD40 signaling are integrated quantitatively to jointly determine B-cell fate decision and proliferation remains unclear. To investigate this, we developed a differential-equations-based model of the BCR and CD40 signaling networks activating NFκB. Our model accurately recapitulates the NFκB dynamics of B-cells stimulated through their BCR and CD40 receptors, correctly predicting that costimulation induces more NFκB activity. However, when linking it to established cell fate decision models of cell survival and cell cycle control, it predicted potentiated population expansion that was not observed experimentally. We found that this discrepancy was due to a time-dependent functional antagonism exacerbated by BCR-induced caspase activity that can trigger apoptosis in founder cells, unless NFκB-induced survival gene expression protects B-cells in time. Guided by model predictions, sequential co-stimulation experiments revealed how the temporal dynamics of BCR and CD40 signaling control the fate decision between negative and positive selection of B-cell clonal expansion. Our quantitative findings highlight a complex non-monotonic integration of BCR and CD40 signals that is controlled by a balance between NFκB and cell-death pathways, and suggest a mechanism for regulating the stringency of B-cell selection during an antibody response.

Keywords: B-cell selection; BCR signaling; CD40 signaling; Germinal center reaction; NFκB; activation-induced cell death; mathematical modeling; systems immunology.


Conflict of interest statement

Conflict of Interest Statement The authors declare no conflict of interest.

Figures

Figure 1.
Figure 1.. Multi-scale model recapitulates B-cell NFκB dynamics in response to T-dependent stimulation.
(A) Schematic of BCR-CD40 receptor model to recapitulate T-dependent activation of B-cells. (B) Schematics of existing T-independent (left) and newly integrated T-dependent (right) NFκB signaling modeling frameworks. T-independent stimulation typically only involves a single ligand (e.g. CpG or LPS), while T-dependent stimulation always involve a more complex receptor signaling system of both BCR and CD40 ligands. Low, medium and high dose of CD40 were set to 6nM, 12nM, and 30nM, respectively, to correspond to the three experimental doses we used (1μg/mL, 3.3μg/mL, and 10μg/mL). (C-D) Line graph from model simulations show (C) peak nuclear RelA and (D) peak nuclear cRel levels in response to increasing CD40 doses, where the shading represents the sample standard deviation of 1000 cells. X-axes are plotted on a log-scale to accommodate a wide range of concentrations. (E) Line graphs from model simulations of 1000 virtual cells and (F) matching experiments with 600K founder B-cells show temporal trajectories of nuclear RelA level at 0, 7, 24, and 48hrs following stimulation with low α-CD40 (1μg/mL), high α-CD40 (10μg/mL), or costimulation with high α-CD40 and α-BCR (10μg/mL each). Darker colored lines represent the average nuclear RelA level from 1000 cells and the lighter shading represents the sample standard deviation of the 1000 cells. (G-H) Line graphs of nuclear cRel level in matching stimulation conditions as (E-F).
Figure 2.
Figure 2.. Multi-scale model recapitulates B-cell population dynamics in response to CD40 stimulation.
(A) Workflow of fitting model simulations to experimental B-cell population dynamics following stimulation. Left: schematic of full T-dependent modeling framework. Right: experimental workflow with Cell Trace Far Red (CTFR) dye dilution. (B) Stacked area plots from model simulations of 1000 virtual B-cells show their population dynamics in response to stimulation with (from left to right) no (0nM), low (6nM), medium (12nM), and high (30nM) dose of α-CD40. Each subsequent generation of proliferating cells is indicated with a darker gray. (C) Stacked area plots from matching experiments of 19196 founder B-cells show their population dynamics in response to no (0μg/mL), low (1μg/mL), medium (3.3μg/mL), or high (10μg/mL) dose of α-CD40. (D-E) Root mean square deviation (RMSD) is calculated between simulated and experimental data, and is composed of 2 scores: RMSD of (D) relative population size expansion and RMSD of (E) generation composition. An example of RMSD between model and experimental data is shown on the left side of (D) and (E), and a heatmap of the RMSD scores in matching (diagonal) or mismatching (off-diagonal) model-and-experiment pairs is shown on the right side. Lower RMSD scores correspond to better fit.
Figure 3.
Figure 3.. Model predicts synergistic population expansion in response to BCR and CD40 costimulation, but experiment reveals dose-dependent interaction between the stimuli.
(A) Stacked area plot from model simulations of 1000 virtual B-cells show their population dynamics in response to costimulation with high α-IgM (0.25nM) and low α-CD40 (6nM). Each subsequent generation of proliferating cells is indicated with a darker gray. (B) Stacked area plot from matching experiments of 19196 founder B-cells show their population dynamics in response to high α-IgM (10μg/mL) and low α-CD40 (1μg/mL) costimulation. (C) Stacked area plot from model simulations of 1000 virtual B-cells show their population dynamics in response to costimulation with high α-IgM (0.25nM) and high α-CD40 (30nM). (D) Stacked area plot from matching experiments of 19196 founder B-cells show their population dynamics in response to high α-IgM (10μg/mL) and high α-CD40 (10μg/mL) costimulation. (E) Stacked bar graph shows a breakdown of total RMSD by types in the 2 costimulation conditions compared to the 4 model-and-experiment pairs in Fig. 2B–C which includes no, low, medium, and high dose of CD40. (F) Line graph of experimental population expansion index is higher in response to costimulation than without α-IgM. (G) Stacked bar graph of experimental generation composition dynamics in response to low α-CD40 stimulation with or without high α-IgM costimulation. (H) Stacked bar graph of RMSD score between the 2 experimental conditions in (G) shows the addition of high α-IgM changes both population expansion and generation composition. (I) Line graph of experimental population expansion index is lower in response to costimulation than without α-IgM. (J) Stacked bar graph of experimental generation composition dynamics in response to high α-CD40 stimulation with high α-IgM costimulation. (K) Stacked bar graph of RMSD score between the 2 experimental conditions in (J) shows the addition of high α-IgM predominantly affects population expansion.
Figure 4.
Figure 4.. BCR-induced caspase-dependent apoptosis and NFκB signaling saturation explains the dose-dependent interaction in costimulation.
(A) Schematic of updated T-dependent multi-scale B-cell model where activated BCR induces caspase-8 processing. (B) Stacked area plots from model simulation and matching experiment show B-cell population dynamics in response to costimulation with high α-IgM (0.25nM and 10μg/mL) and high α-CD40 (30nM and 10μg/mL) with the addition of BCR-induced caspase processing. Each subsequent generation of proliferating cells is indicated with a darker gray. (C) Stacked area plots from model simulation and matching experiment show B-cell population dynamics in response to costimulation with high α-IgM (0.25nM and 10μg/mL) and low α-CD40 (6nM and 1μg/mL) with the addition of BCR-induced caspase processing. (D) Bar graph of total RMSDs of the 2 costimulation conditions after the addition of BCR-induced caspase processing compared with before the addition. (E-F) Model simulations (lines) and immunoblot quantification (triangles) show consistent average nuclear RelA and cRel level in naïve B-cells costimulated with (E) high α-CD40 and high α-IgM or (F) low α-CD40 and high α-IgM at 0, 7, 24, 48hrs, and 72hrs since stimulation onset. Darker colored lines represent average nuclear RelA level from cells that are alive at the timepoint, whereas the shading represents the sample standard deviation of the cells. (G) Schematic of BCR stimulation being pro-proliferative and anti-apoptotic due to NFκB signaling yet pro-apoptotic due to AICD.
Figure 5.
Figure 5.. BCR-induced apoptosis prevents BCR stimulation from promoting population growth.
(A) Stacked area plots from model simulations of 1000 virtual B-cells (top) and matching experiments of 19196 founder B-cells (bottom) show their population dynamics in response to costimulation with high (30nM and 10μg/mL) α-CD40 and no (0nM and 0μg/mL), low (0.005nM and 1μg/mL), or high (0.25nM and 10μg/mL) dose of α-BCR under the impact of AICD. Each subsequent generation of proliferating cells is indicated with a darker gray. (B) Stacked bar graph from model simulations (top) and experiments (bottom) show a breakdown of live B-cells by generation numbers at 96hrs post-stimulation-onset. (C-D) Model-simulated Kaplan-Meier survival curve in response to (C) α-CD40 dose and (D) α-BCR dose shows distinct pattern regarding monotonicity. (E) Bar graph from model simulations show percentage live B-cells at 24hrs in response to increasing α-CD40 and α-BCR doses. (F-K) Heatmaps from model simulations of 1000 virtual B-cells in response to 25 single- or co-stimulation scenarios (with 5 doses of α-CD40: 0, 6, 12, 18, and 30nM, and 5 doses of α-BCR: 0, 0.0005, 0.005, 0.05, and 0.25nM, combinatorially) show the percentage of survived B-cells at 24 hours under (F) no AICD and (I) with AICD, the percentage of proliferative B-cells by 84hrs out of those that survived (G) without AICD and (J) with AICD, and the relative population size at 96hrs (normalized to founder cell population size) (H) without AICD and (K) with AICD, where white contour lines represent 0.5-, 1.0-, 1.5-, and 2.0-fold changes. (L) Heatmap shows the differences between (F) and (I). (M) Heatmap shows the differences between (G) and (J). (N) Heatmap shows the differences between (H) and (K). In (F-N), the 25 simulated doses are plotted as colored circles in a scatterplot, whereas the space in between doses is interpolated with a locally estimated scatterplot smoothing (LOESS) curve.
Figure 6.
Figure 6.. Sequential BCR-CD40 simulation reveals a limited window of opportunity to acquire CD40 signal.
(A) In vitro experimental workflow where primary B cells are sequentially stimulated with pulsing α-BCR, followed by α-CD40 stimulation 1, 3, 5, or 8hrs later. (B) Line graph from model simulations of 1000 virtual B-cells show their population expansion in response to sequential costimulation with high BCR (0.25nM) and low CD40 (6nM) (left), high BCR (0.25nM) and high CD40 (30nM) (middle), and low BCR (0.005nM) and high CD40 (30nM) (right), colored by the gap between BCR and CD40 stimulation. Each thick colored line represents the average population expansion from 1000 cells, and the shading represents the population standard deviation from the 8 simulations, each with 125 founder cells. (C) Line graph from matching experiments of 19196 founder B-cells show their population expansion in response to sequential costimulation with high BCR (10μg/mL) and low CD40 (1μg/mL) (left), high BCR (10μg/mL) and high CD40 (10μg/mL) (middle), and low BCR (1μg/mL) and high CD40 (10μg/mL) (right), colored by the gap between BCR and CD40 stimulation.
Figure 7.
Figure 7.. BCR-induced anti-apoptotic BclXL protects cells from dying from AICD, as a form of paradoxical signaling.
(A) Schematic of paradoxical BCR signaling that promotes proliferation, survival, and death of B-cells through cMyc, Bcl-xL, and caspase-8, respectively. (B) Line plots of Bcl-xL activity (left axis) colored by caspase-8 level (color bar) in 50 model-simulated single-cells show the correlation between Bcl-xL consumption and caspase-8 activity. The thick line overlaid on top is a Kaplan-Meier survival curve (right axis). The pink and green vertical dashed lines represent the timing of BCR and CD40 stimulation, respectively. From left to right, the 3 conditions are: high α-CD40 costimulation, and sequential α-BCR and α-CD40 stimulation with a 1hr and 8hr gap. When a cell dies, the line continues (and becomes pink due to high caspase-8 level). (C) Line plots of Bcl-xL activity colored by RelA (left) and cRel (right) activity in 50 model-simulated single-cells demonstrate the correlation between NFκB activation and BclXL upregulation in B-cells costimulated sequentially with an 8hr gap. When a cell dies, the line discontinues. (D) Violin plot of peak RelA, cRel, and Bcl-xL activity in 2000 model-simulated B-cells in response to sequential costimulated with an 8hr gap show the differences between cells that died within the first 12 hours and those that survived. Statistical significance is evaluated using a Mann Whitney U test, with p-values of 0.0019, 0.0077, and <1e-18, correspondingly. (E-J) Heatmaps from model simulations of 1000 virtual B-cells in response to 25 single or costimulation scenarios (with 5 doses of α-CD40: 0, 6, 12, 18, and 30nM, and 5 doses of α-BCR: 0, 0.0005, 0.005, 0.05, and 0.25nM, combinatorially) show the percentage of survived cell at 24 hours after stimulation onset (left) and the percentage of survived cells that proliferated by 84hrs (right) in (E) 1hr sequential costimulation or (F) 8hr sequential costimulation. (G) Heatmap highlights the difference between (E) and (F). (H-I) Heatmap of relative population size at 96hrs between (H) 1hr sequential stimulation and (I) 8hr sequential stimulation shows the biggest difference (J) in the upper right and lower right corners. In (E-J), the 25 simulated doses are plotted as colored circles in a scatterplot, whereas the space in between doses is interpolated with a locally estimated scatterplot smoothing (LOESS) curve.

References

    1. Akiyama T., Shinzawa M. and Akiyama N. (2012) ‘TNF receptor family signaling in the development and functions of medullary thymic epithelial cells’, Frontiers in immunology, 3, p. 278. Available at: 10.3389/fimmu.2012.00278. - DOI - PMC - PubMed
    1. Akkaya M. et al. (2018) ‘Second signals rescue B cells from activation-induced mitochondrial dysfunction and death’, Nature Immunology, 19(8), pp. 871–884. Available at: 10.1038/s41590-018-0156-5. - DOI - PMC - PubMed
    1. Bretscher P. and Cohn M. (1970) ‘A Theory of Self-Nonself Discrimination’, Science, 169(3950), pp. 1042–1049. - PubMed
    1. Burnet M. (1957) ‘Cancer—A Biological Approach’, British Medical Journal, 1(5023), pp. 841–847. - PMC - PubMed
    1. Caldwell A.B. et al. (2014) ‘Network dynamics determine the autocrine and paracrine signaling functions of TNF’, Genes & Development, 28(19), pp. 2120–2133. Available at: 10.1101/gad.244749.114. - DOI - PMC - PubMed

Publication types