[Preprint]. 2024 Jul 31:2024.07.30.605867.
doi: 10.1101/2024.07.30.605867.

Mechanism of neurodegeneration mediated by clonal inflammatory microglia

Affiliations

Mechanism of neurodegeneration mediated by clonal inflammatory microglia

Rocio Vicario et al. bioRxiv. .

Abstract

Langerhans cell Histiocytosis (LCH) and Erdheim-Chester disease (ECD) are clonal myeloid disorders, associated with MAP-Kinase activating mutations and an increased risk of neurodegeneration. Surprisingly, we found pervasive PU.1+ microglia mutant clones across the brain of LCH and ECD patients with and without neurological symptoms, associated with microgliosis, reactive astrocytosis, and neuronal loss. The disease predominated in the grey nuclei of the rhombencephalon, a topography attributable to a local proliferative advantage of mutant microglia. Presence of clinical symptoms was associated with a longer evolution of the disease and a larger size of PU.1+ clones (p= 0.0003). Genetic lineage tracing of PU.1+ clones suggest a resident macrophage lineage or a bone marrow precursor origin depending on patients. Finally, a CSF1R-inhibitor depleted mutant microglia and limited neuronal loss in mice suggesting an alternative to MAPK inhibitors. These studies characterize a progressive neurodegenerative disease, caused by clonal proliferation of inflammatory microglia (CPIM), with a decade(s)-long preclinical stage of incipient disease that represent a therapeutic window for prevention of neuronal death.


Conflict of interest statement

Conflict of Interest. FG has performed consulting for Third Rock venture in the past. Targeted Sequencing was funded in part by a grant from Third Rock venture. FG and RV are inventors in MSKCC’s United States application or PCT international application number PCT/US2018/047964 filed on 8/24/2018 (KINASE MUTATION-ASSOCIATED NEURODEGENERATIVE DISORDERS)

Figures

Figure 1.
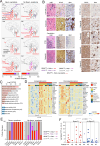
Figure 1.. Detection of mutations in brain and matching blood or bone marrow from histiocytosis patients.
(A) Left, schematic of post-mortem brain samples obtained from patients. Right, representative flow cytometry dot-plots of brain nuclei from patient #1 and labeled with anti-NeuN and anti-PU.1 antibodies (% of total). (B) Oncoplot represents mutated genes (with 4 or more mutant reads), number of mutations per sample and % of samples carrying mutations in PU.1+ samples (n=71) and matching blood or bone marrow samples (BM) (n=12) from Histiocytosis patients (n=8). (C) Variant allelic frequency (VAF, %, HemePACT) for BRAFc.1799T>A (V600E) in PU.1+, NeuN+, DN (PU.1-,NeuN-) and blood or bone marrow samples from Histiocytosis patients (71 brain samples from 8 patients), and controls (104 samples from n=35). Each dot represents a sample. Statistics: p-values are calculated with unpaired two-tailed Mann-Whitney U test.
Figure 2.
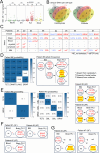
Figure 2.. Histological and molecular analysis of the brain of histiocytosis patients.
(A) Schematic of the brains of the 8 patients annotated for the detection of BRAFc.1799T>A (V600E) and/or of histological signs of neurodegeneration (Histo+). Bar graphs represents the proportion of tested brain samples positive for BRAFc.1799T>A (V600E) by HemePACT and/or histological signs of neurodegeneration among patients with (left) or without (right) neurological symptoms. (B). Left, representative H&E, IBA1 (microglia marker) and GFAP (astrocyte marker) of pons and cerebellum from patient #1 and an age-match control for comparison. Right, representative IBA1 and GFAP of pons from patient #8, #4, #5, #7 and an age-match control for comparison. Arrows indicate neuron nuclei. (C) Pathway enrichment among differentially expressed genes (DEG, red: upregulated genes, blue: downregulated genes) by RNAseq analysis (FDR <0.05, log2FC >= or <= 1.5/−1.5) of whole brain of Histiocytosis patients (n=13) and controls (n=11) using g:profiler webtool. Pathways are selected based on FDR <= 0.05 and ordered by significance. (D) Hierarchical clustering of DEG (log2FC >= 1.5, log2FC <= −1.5, FDR <0.05) between brain samples from Histiocytoses (n=13) and controls (n=11). Expression values are Z score transformed. (E) Bar graphs represents the proportion of tested brain samples positive for BRAFc.1799T>A (V600E) by HemePACT and/or histological signs of neurodegeneration among patients with (left) or without (right) neurological symptoms. (F) Variant allelic frequency (VAF, %, HemePACT)) for BRAFc.1799T>A (V600E) in PU.1+, samples from patients with (red) and without (blue) neurological symptoms. Each symbol represents a patient. Statistics: p-value is calculated using a mixed-effects linear regression model (see methods).
Figure 3.
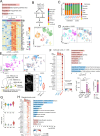
Figure 3.. Analysis of mutant microglia across brain regions in human and mouse models of neuro-histiocytosis.
(A) Variant allelic frequency (VAF, %, b HemePACT) of BRAFc.1799T>A (V600E) in PU.1+ nuclei from histiocytosis patients across brain regions (n=8, patients with neuro-histiocytosis are color-coded in red, patients without a diagnosis of neuro-histiocytosis are color-coded in blue). The fitted line, R-squared and corresponding p value were calculated by simple linear regression by assigning numbers from 1–8 to each brain region from along a rostro caudal axis. Gray line: all patients. Red line: patients with neuro-histiocytosis. Blue line: patients without neuro-histiocytosis. (B) Representative mouse sagittal midline brain sections from 6 months old Csf1rMerCreMer; BrafLSL-V600E mice (pulsed with OH-TAM at E8.5), Cx3cr1CreERt2 ; BrafLSL-V600E (pulsed with OH-TAM at E9.5) and littermate controls stained with anti-IBA1 or anti-GFAP, Scale bar 1000uM. (C) Allelic frequency of the BrafV600E allele in microglia purified from dissected brain regions from 2 months old, and at 6–12 months-old analyzed by droplet digital PCR (ddPCR). Dots and colored lines represent individual mice, boxes represent variance, with line at mean. (D) RNAseq analysis performed in FACS-isolated microglia from cortex and brainstem from 2-month-old Cx3cr1CreERT2 BrafLSL-V600E mice (n=3), and littermates (n=3) pulsed with OH-TAM at E8.5. Top, principal component analysis (PCA). Bottom, pathway analysis of significantly upregulated genes (FDR <0.05, log2FC >= 1.5) in microglia from old Cx3cr1CreERT2 BrafLSL-V600E versus littermate control using g:profiler webtool. Pathways are selected based on FDR <= 0.05 and ordered by significance. (E) Hierarchical clustering of DEG from ‘mitotic cell cycle process’ (GO:1903047, left) from analysis in D.
Figure 4.
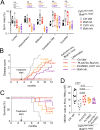
Figure 4.. Natural history of BRAFV600E clone.
(A) Mutational load in NeuN, DN (double negative, NeuN-, PU.1-), PU.1 and Blood/Bone Marrow from control and Histiocytosis patients. Statistics: p-values are calculated with unpaired two-tailed Mann-Whitney U test. (B) Venn diagrams represent the repartition per cell type of single-nucleotide variations (SNVs) identified in NeuN+, PU.1+, DN and matching blood in samples from 8 histiocytosis patients (NeuN, n=62; DN, n=69; PU.1, n=71; Blood/BM, n=12) and 35 control individuals (NeuN, n=107; DN, n=108; PU.1, n=107; Blood/BM, n=22). (C) Variant allelic frequency (VAF, %, HemePACT) for BRAF c.1799T>A (V600E) (red), TET2 and DNMT3A variants (blue) in brain PU.1+nuclei and blood/bone marrow nd: not detected (*mean depth 5600x, see Figure S5). For patient #1 and #2 myeloid (HLA-DR+, Lin-) and lymphoid (Lin+) cells were flow-sorted. (D) Left, mutual exclusivity analysis of mutations found by single-cell genotyping (Tapestri) of PU.1+ cells isolated from Pons and Cerebellum from patient #6. The number represents the probability that two mutations are mutually exclusive in single cells by random chance. The smaller the probability, the more likely they are in different cell populations. Right, plot depicts probable origin of the BRAFV600E and CH clones in patients #6. Numbers show the range of allelic frequency in different brain samples for each mutation. (E) Left, mutual exclusivity analysis of mutations found by single-cell genotyping (Tapestri) of PU.1+ cells isolated from Pons from patient #8 and Cerebellum from patient #3. The number represents the probability that two mutations are mutually exclusive in single cells by random chance. The smaller the probability, the more likely they are in different cell populations. Right, plot depicts probable origin of the BRAFV600E and CH clones in patients #8 and #3. Numbers show the range of allelic frequency in different brain samples for each mutation. (F) Plot depicts probable origin of the BRAFV600E clones in patients #1, #2 and #5 based on sequencing data. Numbers show the range of allelic frequency in different brain samples for each mutation. (G) Plot depicts probable origin of the BRAFV600E clones and CH clones in patients #4 and #7 based on sequencing data. Numbers show the range of allelic frequency in different brain samples for each mutation.
Figure 5.
Figure 5.. Inflammatory signatures and neuron loss in mouse models of histiocytosis.
(A) Top, pathway analysis using g:profiler webtool of common differential expressed genes between 2 month old Cx3cr1CreERt2 BrafLSL-V600E mice microglia in Figure 3 and human whole brain samples in Figure 2. Bottom, hierarchical clustering of common genes in end stage mouse microglia. Expression values are Z score transformed. Samples were clustered using average linkage and cluster similarity was determined using the Euclidean distance. (B) Single-nuclei RNAseq (snRNAseq) analysis of dissected cortex and brainstem from BrafVE/WT Cx3cr1CreER mice pulsed with OH-TAM at E9.5 and analyzed at 6 month of age (end stage, VE) (n=2) and littermate controls (Ctrl, n=2). After QC and data processing nuclei were clustered and annotated using Uniform Manifold Approximation and Projection for Dimension Reduction (UMAP) by cell-type. (C) Bar plot showing the relative frequency of neurons, microglia and stromal cells by brain region and condition. (D) UMAP of all nuclei color-coded by brain region (left) or by condition (right). (E) Top, UMAP of neuronal nuclei. color-coded by brain region (left) or by condition (right). Bottom, schematic of brainstem depicting the localization of neuronal clusters reduced in VE samples and NeuN staining (iDISCO) of the pons tegmental nucleus (TRN) from mutants and littermate control. Plot shows the quantification of NeuN staining by immunofluorescence in BRAFV600E and control mice. Each dot represents the mean of three fields per mouse. Statistics: p-values are calculated with Student t test. (F) Left, Dot plot showing the expression level (color scale) and the percent of cells expressing (dot size) the most significantly upregulated DEG (log2FC >= 0.5 & FDR <= 0.05) between brainstem astrocytes, A3 (VE) vs A1,2 (control). Barplot represents number of cells per cluster. Right, pathway analysis of DEG in astrocytes using enrichR of upregulated (red) and downregulated (blue) genes in cluster A3 (FDR <0.05, log2FC >= or <= 0.5/−0.5) in comparison to clusters 1,2. Plot shows the quantification of the % of pSTAT3 expressing cells by immunofluorescence, among IBA1+, GFAP+, and IBA1+ GFAP+ cells in the brainstem of Cx3cr1CreERT2; Braf LSL-V600E and control mice. (G) Violin plots showing expression scores for previously defined disease-associated astrocytes signatures, across astrocytes clusters. (H) Left, Dot plot showing the expression level (color scale) and the percent of cells expressing (dot size) the most significantly upregulated genes (log2FC >= 0.5 & FDR <= 0.05) between brainstem oligodendrocytes O2,4,5 (VE) vs O 0,1 (control). Right, pathway analysis of DEG in oligodendrocytes using enrichR of upregulated (red) and downregulated (blue) genes in cluster O2,4,5 (FDR <0.05, log2FC >= or <= 0.5/−0.5) in comparison to clusters 0,1.
Figure 6.
Figure 6.. Early microglia depletion with CSF1R inhibitors limits neuronal loss and improves symptoms and survival.
(A) Percentage of IBA1+ area in brain from Csf1rMerCreMer; BrafLSL-V600E mice and littermate controls pulsed with OH-TAM at E8.5 and treated from 3 months of age with food formulated with CSF1R inhibitor (PLX-5622) n=6, Braf-V600E inhibitor (PLX-4720) n=6, both n=6, or control diet n=5. p-values were calculated with one-way ANOVA, using Dunnett’s multiple comparisons test. (B) Disease score progression and (C) survival curves for mice in A. Ticks indicate animal death/experimental endpoint. Statistics: Mantel-Cox test. P values are for comparison with control diet. Hazard ratio (logrank): for (a) [CSF1R inh/Ctrl Diet (HR 0.38; 95% CI, 0.19–0.76)], [Braf inh/Ctrl Diet (HR 0.30; 95% CI, 0.15–0.63)], [Both inh/Ctrl Diet (HR 0.20; 95% CI, 0.09 to 0.45)], for (b) [CSF1R inh/Ctrl Diet (HR 0.28; 95% CI, 0.06 to 1.24)], [Braf inh/Ctrl Diet (HR 0.18; 95% CI, 0.03 to 0.92)], [Both inh/Ctrl Diet (HR 0.16; 95% CI, 0.03 to 0.81. (D) Quantification of NeuN staining by immunofluorescence in the pons tegmental reticular nuclei (TRN) from control and Csf1rMerCreMer; BrafLSL-V600E mice treated with control diet, BRAF inhibitor (PLX4720) CSF1R inhibitor (PLX5622) or the combination. Each dot represents the mean of three fields per mouse. p-values were calculated with ANOVA.

References

    1. Heritier S, Emile JF, Barkaoui MA, et al. BRAF Mutation Correlates With High-Risk Langerhans Cell Histiocytosis and Increased Resistance to First-Line Therapy. J Clin Oncol 2016;34(25):3023–30. DOI: 10.1200/JCO.2015.65.9508. - DOI - PMC - PubMed
    1. Haroche J, Charlotte F, Arnaud L, et al. High prevalence of BRAF V600E mutations in Erdheim-Chester disease but not in other non-Langerhans cell histiocytoses. Blood 2012;120(13):2700–3. DOI: 10.1182/blood-2012-05-430140. - DOI - PubMed
    1. Boyd LC, O’Brien KJ, Ozkaya N, et al. Neurological manifestations of Erdheim-Chester Disease. Ann Clin Transl Neurol 2020;7(4):497–506. DOI: 10.1002/acn3.51014. - DOI - PMC - PubMed
    1. Rigaud C, Barkaoui MA, Thomas C, et al. Langerhans cell histiocytosis: therapeutic strategy and outcome in a 30-year nationwide cohort of 1478 patients under 18 years of age. Br J Haematol 2016;174(6):887–98. DOI: 10.1111/bjh.14140. - DOI - PubMed
    1. Emile JF, Abla O, Fraitag S, et al. Revised classification of histiocytoses and neoplasms of the macrophage-dendritic cell lineages. Blood 2016;127(22):2672–81. DOI: 10.1182/blood-2016-01-690636. - DOI - PMC - PubMed

Publication types

LinkOut - more resources