[Preprint]. 2024 Aug 4:2024.08.02.606381.
doi: 10.1101/2024.08.02.606381.

Insertion and Anchoring of HIV-1 Fusion Peptide into Complex Membrane Mimicking Human T-cell

Affiliations

Insertion and Anchoring of HIV-1 Fusion Peptide into Complex Membrane Mimicking Human T-cell

Mingfei Zhao et al. bioRxiv. .

Update in

Abstract

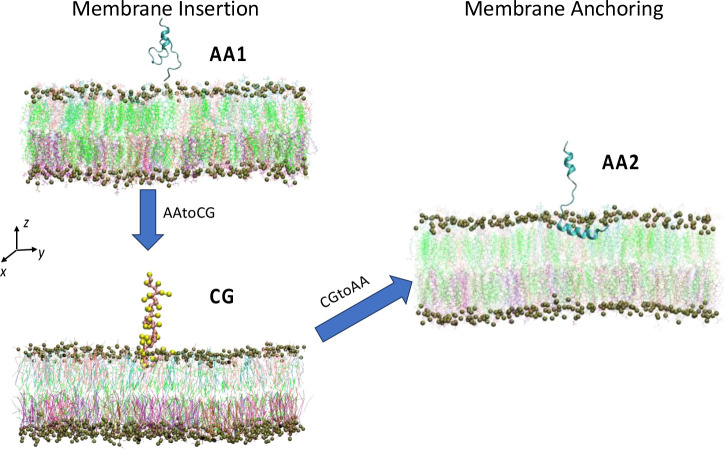
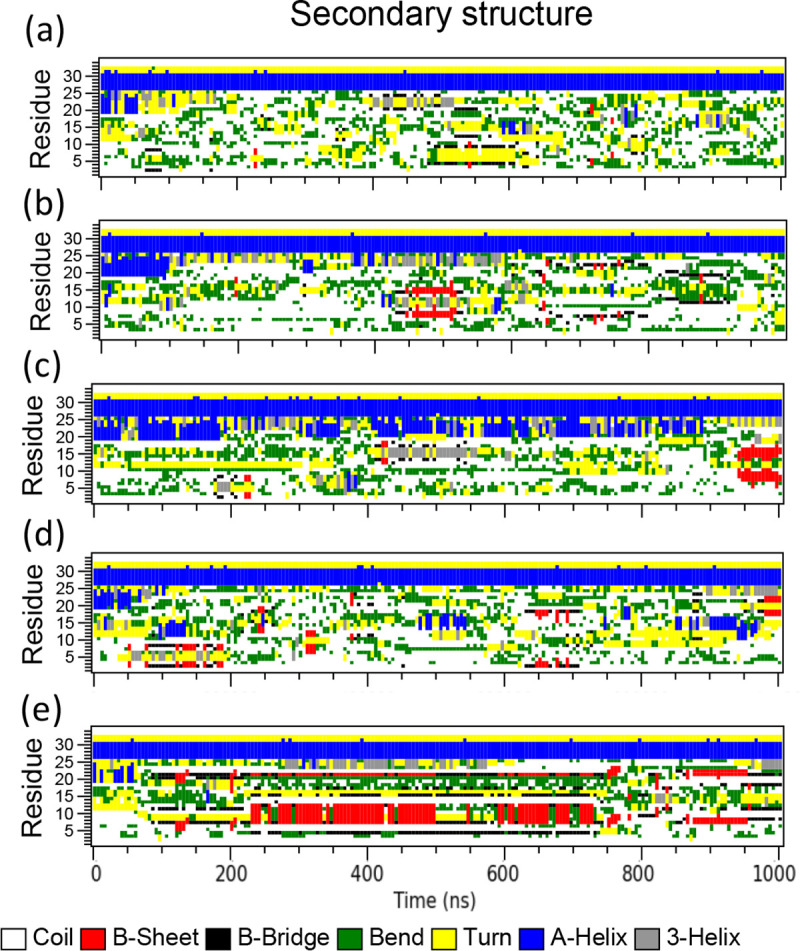
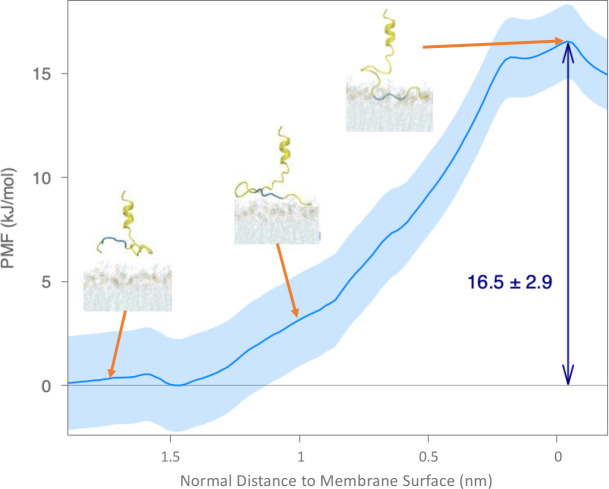
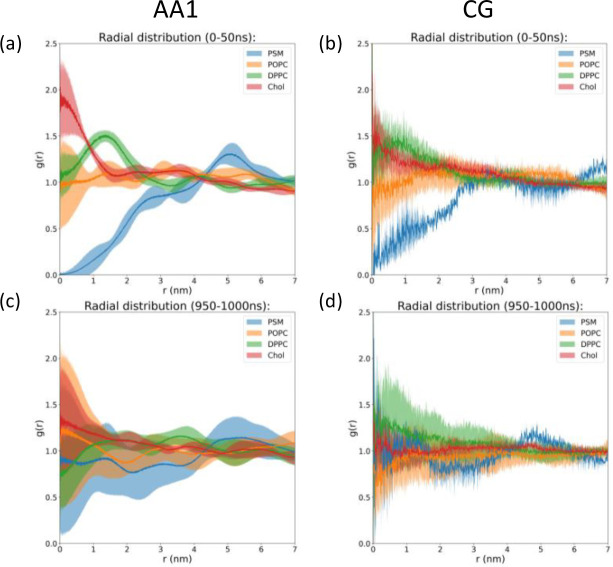
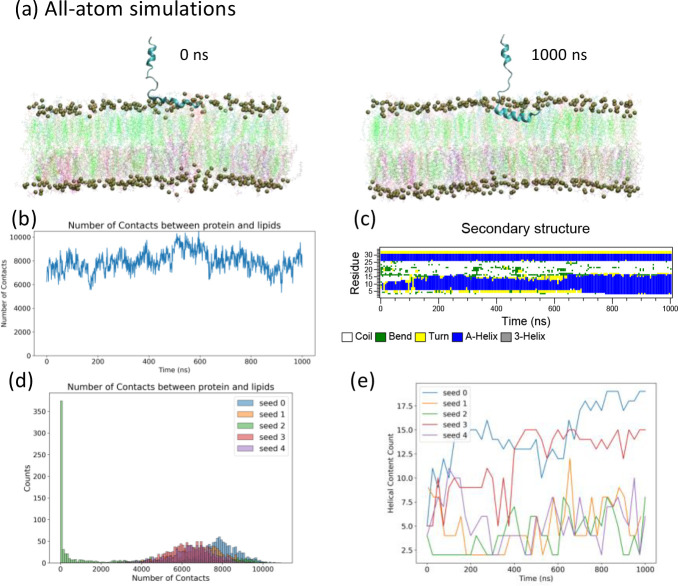
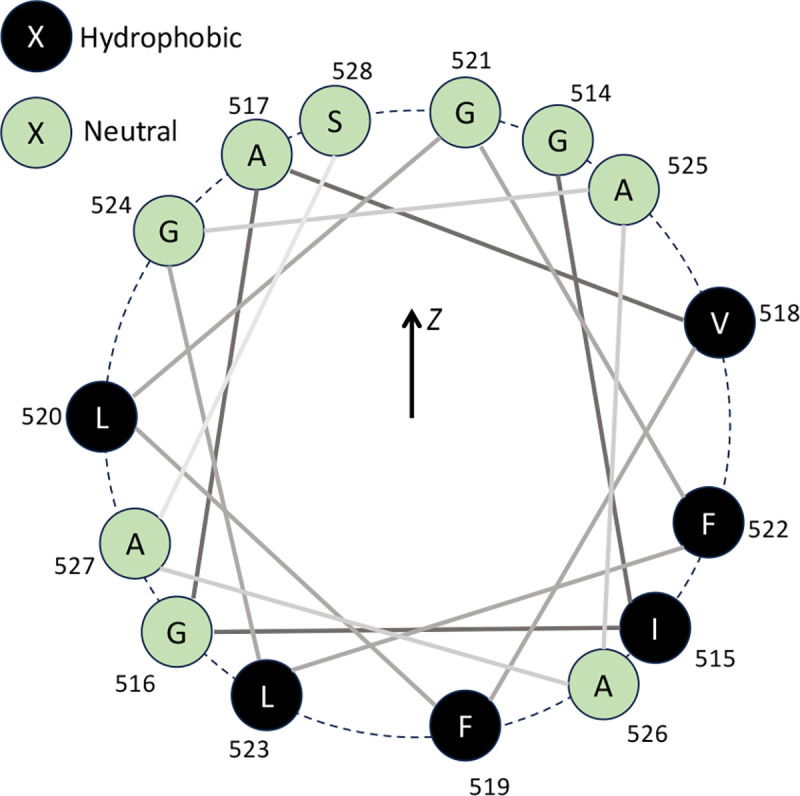
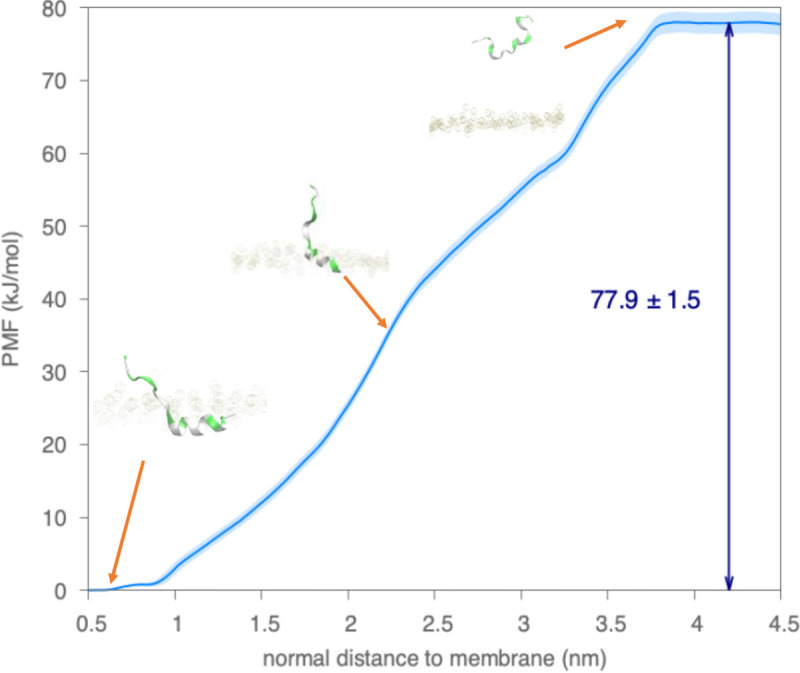
A fundamental understanding of how HIV-1 envelope (Env) protein facilitates fusion is still lacking. The HIV-1 fusion peptide, consisting of 15 to 22 residues, is the N-terminus of the gp41 subunit of the Env protein. Further, this peptide, a promising vaccine candidate, initiates viral entry into target cells by inserting and anchoring into human immune cells. The influence of membrane lipid reorganization and the conformational changes of the fusion peptide during the membrane insertion and anchoring processes, which can significantly affect HIV-1 cell entry, remains largely unexplored due to the limitations of experimental measurements. In this work, we investigate the insertion of the fusion peptide into an immune cell membrane mimic through multiscale molecular dynamics simulations. We mimic the native T-cell by constructing a 9-lipid asymmetric membrane, along with geometrical restraints accounting for insertion in the context of gp41. To account for the slow timescale of lipid mixing while enabling conformational changes, we implement a protocol to go back and forth between atomistic and coarse-grained simulations. Our study provides a molecular understanding of the interactions between the HIV-1 fusion peptide and the T-cell membrane, highlighting the importance of conformational flexibility of fusion peptides and local lipid reorganization in stabilizing the anchoring of gp41 into the targeted host membrane during the early events of HIV-1 cell entry. Importantly, we identify a motif within the fusion peptide critical for fusion that can be further manipulated in future immunological studies.

Keywords: HIV-1; coarse-grained simulations; complex membrane; fusion peptide; molecular dynamics simulation; multiscale modeling; viral cell entry.


Figures

Figure 1
Figure 1
(Left) Structure of HIV-1 trimeric Env protein CH848 (PDB:6um6) and (right) the simulated fusion peptide region from both CH848 (PDB: 6um6) and BG505 (PDB: 5i8h). Both fusion peptides have the same sequences. Other details see Methods.
Figure 2
Figure 2
Multiscale simulation systems of MD modeling between AA and CG systems. This multiscale simulation starts with investigations of membrane insertion process in both AA (AA1) and CG systems with HIV-1 FP directly from PDB: 5i8h. After 1 μs of AA1 simulations, the FP in the AA1 simulation is only able to either insert with very small portions or briefly touch the membrane. The CG simulation runs very fast with the quick insertion of FP into the membrane in all the independent runs. However, FP cannot stay steadily inside the membrane even after 1 μs. Then the CG simulation is backmapped to the AA simulation again (AA2) to investigate the conformational change of the fusion peptide inside the membrane. 5 independent simulations have been conducted for every system, but for each system we only show one snapshot as a representative.
Figure 3
Figure 3
Multiscale modeling of HIV-1 fusion peptides interacting with the complex cell membrane from the same initial configuration, i.e., fusion peptide is completely outside the membrane at ts = 0 ns in the (a) AA1 and (b) CG systems, repectively. The final snapshots are reported at ts = 1000 ns for the (c) AA1 and (d) CG simulations. In those snapshots, the lipids in the membrane are colored based on their types, i.e., cholesterol (green), DPPC (white), POPC (pink), PSM (cyan), POPS (purple), DOPEE (lime), DPPEE (mauve), POPE (ochre), and PAPE (iceblue). Phosphate atoms, and corresponding CG beads, are amplified as dark green balls to represent boundaries of the membrane. Secondary structures of each residue in the fusion peptide are shown in ribbon cartoons at corresponding time steps in the AA1 simulation. Time evolution for numbers of (e) atom-pair contacts in the AA1 simulations and (f) CG bead-pair contacts in the CG simulation within 6 Ȧ cutoff between the fusion peptide and membrane. 5 independent simulations have been conducted for both AA1 and CG system, but only one of those simulations are shown here. Results from remaining simulations are reported in the Supplementary Information figures S3 and S4. Histograms for numbers of (eg atom-pair contacts in the AA1 simulations and (f) CG bead-pair contacts in the CG simulation within 6 Ȧ cutoff between the fusion peptide and membrane for all 5 independent simulations.
Figure 4
Figure 4
Time evolution for secondary structures of the HIV-1 fusion peptide in the AA1 simulations with 5 independent runs. The secondary structures of the fusion peptides are calculated from the GROMACS command “gmx do_dssp”. Figures are generated from xpm files through the GROMACS command “gmx xpm2ps”.
Figure 5
Figure 5
Examination of free energy barriers preventing fusion peptide inserting into the complex membrane in the AA simulations through umbrella sampling methods. Snapshots of fusion peptide and membrane with different insertion depth in membrane are shown with arrows towards approximate points. The PMF profile for the COM of the “AXXXG” motif moving from the solvent into the lipid membrane along the negative z-axis direction. The x-axis represents COM positions of the “AXXXG” motif relative the membrane boundary defined by the average position of the P atoms in the upper leaflet, which is positive in the solvent above the membrane and negative inside the membrane. The PMF curves are computed using umbrella sampling and WHAM, and uncertainties in the light blue shade are estimated by 100 rounds of bootstrap resampling through autocorrelation.
Figure 6
Figure 6
Radial distribution functions of projection from the fixed helix on surface and lipids in the outer leaflet at the (a, b) early stage (0–50 ns) and (c, d) late stage (950–1000 ns) for the (a, c) AA1 and (b, d) CG systems, respectively. Notably, these calculations of radial distribution functions use only x and y components of the distance, i.e., they are 2-dimentional lateral radial distribution functions along the complex membrane. Only Chol (cholesterol), DPPC, POPC, and PSM are calculated here since they are lipids in the upper leaflet. The bin sizes are 0.002 nm for AA1 systems and 0.01 nm for CG systems. The shaded areas represent standard deviations calculated from 5 independent simulations for both AA1 and CG system. Results from individual simulations are reported in the Supplementary Information figures S5 and S6.
Figure 7
Figure 7
(a, b) Time evolution for number of contacts between protein and lipids in the upper leaflet, (c, d) histograms for nonzero numbers of contacts between protein and lipids in the upper leaflet, (e, f) time evolutions for numbers of contacts among the same types of lipids in the (a, c, e) AA1 and (b, d, f) CG system. Only Chol (cholesterol), DPPC, POPC, and PSM are calculated here since they are lipids in the upper leaflet. 5 independent simulations have been conducted for both AA1 and CG system. The shade areas in (c- f) represent standard deviations calculated from 5 independent runs. Results from all the individual simulations are reported in the Supplementary Information figures S7 and S8.
Figure 8
Figure 8
Fusion peptides fold into long helices and lay horizontally in the upper leaflet of cell membrane in the second all-atom simulations backmapped from the coarse-grained simulations. (a) A snapshot of the all-atom simulation system after the fusion peptide inserts into the membrane at the beginning (ts = 0 ns) and the end (ts = 1000 ns) of the simulations, respectively. The lipids in the membrane are colored based on their types same as those in Fig.3. Phosphate atoms are amplified as dark green balls to represent boundaries of the membrane. (b) Time evolution for numbers of atom-pair contacts in the AA2 within 6 Ȧ cutoff between the fusion peptide and membrane. (c) Time evolution of the secondary structures for each residue during the 1 μs simulation course. 5 independent simulations have been conducted for the AA2 system, but only one of those simulations are shown in (a-c). Time evolutions for numbers of contacts between protein and lipids from remaining simulations are reported in the Supplementary Information figures S9. Time evolution of secondary structures calculated from remaining simulations are reported in the Supplementary Information figures S10. (d) Histograms for numbers of contacts between protein and lipids from all 5 independent simulations. Note that fusion peptide in Seed 2 leaves the membrane around 480 ns. (e) Time evolutions for numbers of helical residues from all 5 independent simulations, calculated from secondary structure results reported in (c) and Figure S10.
Figure 9
Figure 9
Helical wheel diagram of HIV-1 fusion peptide with helical residues (residue 514–528) at 1000 ns of Seed 0 in simulations. The residue positions in the wheel also reflect their relative locations along z-axis in the system. The green circles are neutral residues, while the black ones are hydrophobic.
Figure 10
Figure 10
Examination of free energy barriers preventing helical fusion peptide getting out of the complex membrane in the AA simulations through umbrella sampling methods. Snapshots of fusion peptide and membrane along the path are shown with arrows towards approximate points. The PMF profile for the COM of residue 529 to 531 moving into the solvent along the positive z-axis direction. The x-axis represents COM positions of residue 529 to 531 relative the membrane boundary defined by the average position of the P atoms in the upper leaflet, which is positive in the solvent above the membrane and negative inside the membrane. The PMF curves are computed using umbrella sampling and WHAM, and uncertainties in the light blue shade are estimated by 100 rounds of bootstrap resampling through autocorrelation.
Figure 11
Figure 11
Insertion depth and lipid organization after the HIV-1 fusion peptide inserted inside the membrane. (a) Time evolution for numbers of contacts between fusion peptide and different lipids within 6 Ȧ cutoff. Average insertion depth and nearby lipid distribution of each residue of HIV-1 fusion peptide collected from (b) the early stage (0–50 ns) simulation and (c) late stage (950–1000 ns) simulation. The x-axis coordinates represent residues starting from the N-terminus (residue 512). The y-axis coordinates are the relative distances along z-direction between the COM position for each residue and extrapolated P-atom z-position on the residue COM location representing the boundary of upper leaflet. The x-axis represents each amino acid in the fusion peptide. The y-axis is the lateral number density of certain lipids in the upper leaflet within 2.0 nm cutoff radius normalized by the total number of the corresponding lipid type in the upper leaflet. The lipid number densities are the average values calculated from 50 frames. The error bars represent the standard deviation calculated from 50 frames as well. 5 independent simulations have been conducted for the AA2 system, but only one of those simulations are shown here. Results from remaining simulations are reported in the Supplementary Information figures S12 and S13.
Figure 12
Figure 12
Average number density maps of lipids on the upper leaflet at (a-d) the early stage (0–50 ns) and (e-h) the late stage (950 – 1000 ns). The membrane-embedded portions (residue 512 to 529) of the HIV-1 fusion peptide at 25 ns for the early stage and 975 ns for the late stage are shown in cyan ribbons. The color bars have the same scale from 0 to 30 for all the plots. These density maps were computed from the GROMACS command “gmx densmap”. 5 independent simulations have been conducted for the AA2 system, but only one of those simulations (seed 0) are shown here. Results from remaining simulations are reported in the Supplementary Information figures S14.
Figure 13
Figure 13
Initial folding “AXXXG” motif of HIV-1 fusion peptide. (a) The secondary structures of each residue during the first 10 ns after the fusion peptide inserts inside the membrane. As circled by the red rectangle, the folding of the helix starts from the “AXXXG” motif. 5 independent simulations have been conducted for the AA2 system, but only one of those simulations are shown here. Results from remaining simulations are reported in the Supplementary Information figures S11. (b) Sequence conservation of the HIV-1 fusion peptide region (residue 512 to 534) is investigated among 6481 sequences from LANL HIV database. The HIV-1 fusion peptide region is highly conserved comparing to other domains of the Env protein. The sizes of the letters correspond to the probability of a certain amino acid appearing at the certain position. The character colors represent its hydrophobicity. The green ones are neutral residues, including SGHTAP amino acids. The black ones are hydrophobic residues, including RKDENQ amino acids. The rest amino acids are hydrophilic RKDENQ residues, which are not shown here would be shown in blue.

Similar articles

References

    1. Chen B., Molecular Mechanism of HIV-1 Entry. Trends Microbiol, 2019. 27(10): p. 878–891. - PMC - PubMed
    1. Negi G., et al., Membrane attachment and fusion of HIV-1, influenza A, and SARS-CoV-2: resolving the mechanisms with biophysical methods. Biophys Rev, 2022. 14(5): p. 1109–1140. - PMC - PubMed
    1. Gorai B., et al., Concerted Interactions between Multiple gp41 Trimers and the Target Cell Lipidome May Be Required for HIV-1 Entry. J Chem Inf Model, 2021. 61(1): p. 444–454. - PubMed
    1. Heller W.T., A small-angle neutron scattering study of the physical mechanism that drives the action of a viral fusion peptide. Chem Phys Lipids, 2021. 234: p. 105022. - PubMed
    1. Caillat C., et al., Structure of HIV-1 gp41 with its membrane anchors targeted by neutralizing antibodies. Elife, 2021. 10. - PMC - PubMed

Publication types

LinkOut - more resources