

An autoantibody profile identified by human genome-wide protein arrays in rheumatoid arthritis
- PMID: 39132510
- PMCID: PMC11317183
- DOI: 10.1002/mco2.679
An autoantibody profile identified by human genome-wide protein arrays in rheumatoid arthritis
Abstract
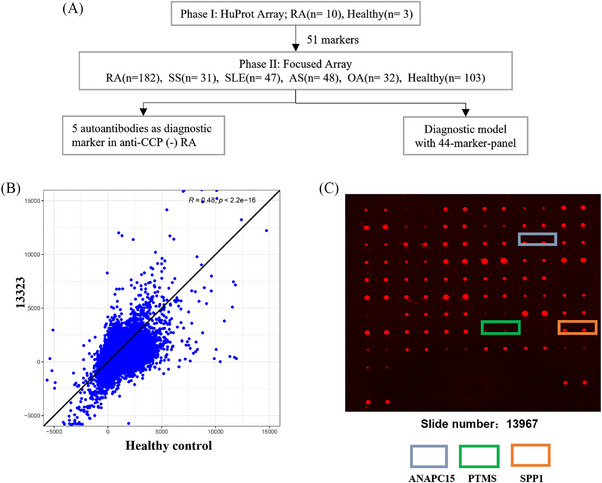
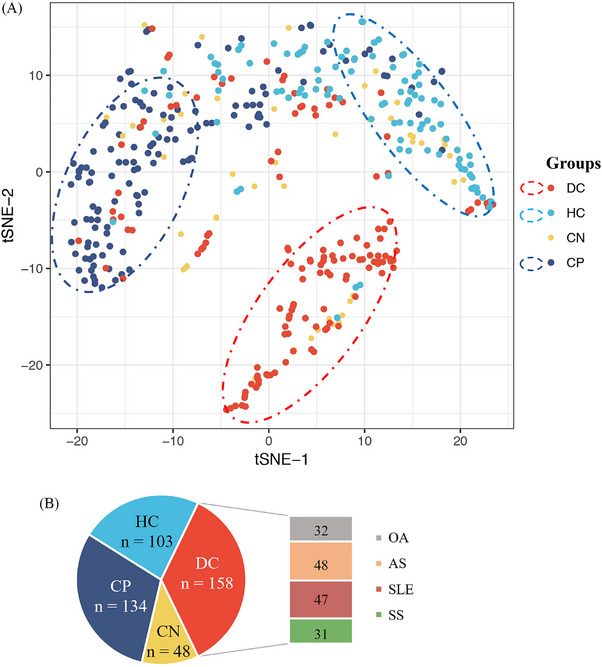
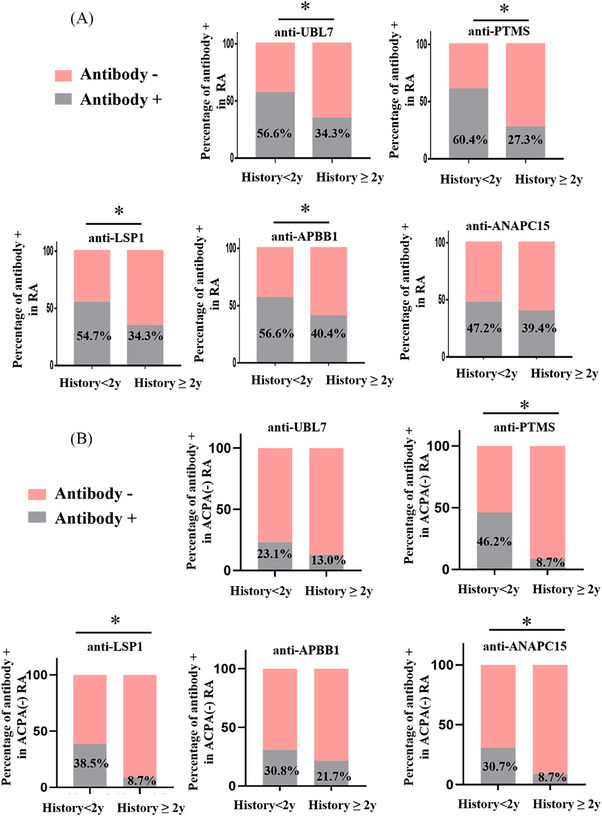
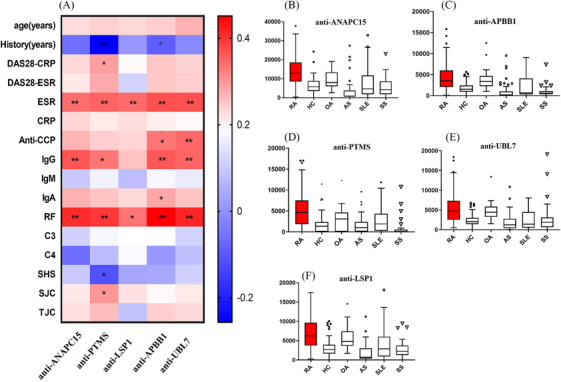
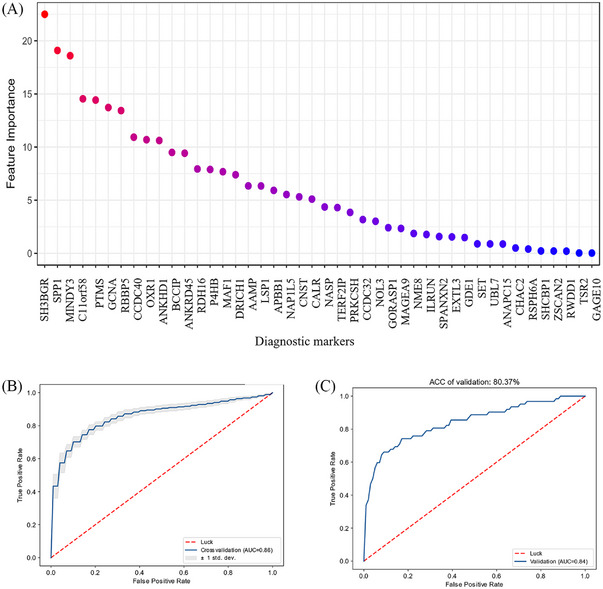
Precise diagnostic biomarkers of anticitrullination protein antibody (ACPA)-negative and early-stage RA are still to be improved. We aimed to screen autoantibodies in ACPA-negative patients and evaluated their diagnostic performance. The human genome-wide protein arrays (HuProt arrays) were used to define specific autoantibodies from the sera of 182 RA patients and 261 disease and healthy controls. Statistical analysis was performed with SPSS 17.0. In Phase I study, 51 out of 19,275 recombinant proteins covering the whole human genome were selected. In Phase II validation study, anti-ANAPC15 (anaphase promoting complex subunit 15) exhibited 41.8% sensitivity and 91.5% specificity among total RA patients. There were five autoantibodies increased in ACPA-negative RA, including anti-ANAPC15, anti-LSP1, anti-APBB1, anti-parathymosin, and anti-UBL7. Anti-parathymosin showed the highest prevalence of 46.2% (p = 0.016) in ACPA-negative early stage (<2 years) RA. To further improve the diagnostic efficacy, a prediction model was constructed with 44 autoantibodies. With increased threshold for RA calling, the specificity of the model is 90.8%, while the sensitivity is 66.1% (87.8% in ACPA-positive RA and 23.8% in ACPA-negative RA) in independent testing patients. Therefore, HuProt arrays identified RA-associated autoantibodies that might become possible diagnostic markers, especially in early stage ACPA-negative RA.
Keywords: HuProt array; anticitrullination protein antibody (ACPA); autoantibody; rheumatoid arthritis.
© 2024 The Author(s). MedComm published by Sichuan International Medical Exchange & Promotion Association (SCIMEA) and John Wiley & Sons Australia, Ltd.
Conflict of interest statement
The authors declare that they have no conflict of interests that could be perceived as prejudicing the impartiality of the research reported.Author Changcheng Yin is an employee in Beijing Protein Innovation Co. Ltd, but has no potential relevant financial or nonfinancial interests to disclose. The other authors have no conflicts of interest to declare.
Figures
Similar articles
-
Novel autoantibodies identified in ACPA-negative rheumatoid arthritis.Ann Rheum Dis. 2021 Jun;80(6):739-747. doi: 10.1136/annrheumdis-2020-218460. Epub 2021 Jan 15. Ann Rheum Dis. 2021. PMID: 33452006
-
Patients with ACPA-positive and ACPA-negative rheumatoid arthritis show different serological autoantibody repertoires and autoantibody associations with disease activity.Sci Rep. 2023 Apr 1;13(1):5360. doi: 10.1038/s41598-023-32428-4. Sci Rep. 2023. PMID: 37005480 Free PMC article.
-
An investigation of the added value of an ACPA multiplex assay in an early rheumatoid arthritis setting.Arthritis Res Ther. 2015 Oct 5;17:276. doi: 10.1186/s13075-015-0786-z. Arthritis Res Ther. 2015. PMID: 26437716 Free PMC article.
-
Autoantibodies in inflammatory arthritis.Autoimmun Rev. 2016 Jul;15(7):673-83. doi: 10.1016/j.autrev.2016.03.003. Epub 2016 Mar 9. Autoimmun Rev. 2016. PMID: 26970491 Review.
-
ACPA-negative rheumatoid arthritis: From immune mechanisms to clinical translation.EBioMedicine. 2022 Sep;83:104233. doi: 10.1016/j.ebiom.2022.104233. Epub 2022 Aug 23. EBioMedicine. 2022. PMID: 36027873 Free PMC article. Review.
References
-
- Harnden K, Pease C, Jackson A. Rheumatoid arthritis. BMJ. 2016;352:i387. - PubMed
-
- Nakken B, Papp G, Bosnes V, et al. Biomarkers for rheumatoid arthritis: from molecular processes to diagnostic applications‐current concepts and future perspectives. Immunol Lett. 2017;189:13‐18. - PubMed
-
- Dotzlaw H, Schulz M, Eggert M, Neeck G. A pattern of protein expression in peripheral blood mononuclear cells distinguishes rheumatoid arthritis patients from healthy individuals. Biochim Biophys Acta. 2004;1696:121‐129. - PubMed
LinkOut - more resources
Full Text Sources
Miscellaneous