. 2024 Dec;46(2):2387429.
doi: 10.1080/0886022X.2024.2387429. Epub 2024 Aug 12.

Alterations in the gut microbiome and metabolism profiles reveal the possible molecular mechanism of renal injury induced by hyperuricemia in a mouse model of renal insufficiency

Affiliations

Alterations in the gut microbiome and metabolism profiles reveal the possible molecular mechanism of renal injury induced by hyperuricemia in a mouse model of renal insufficiency

Ping Liu et al. Ren Fail. 2024 Dec.

Abstract

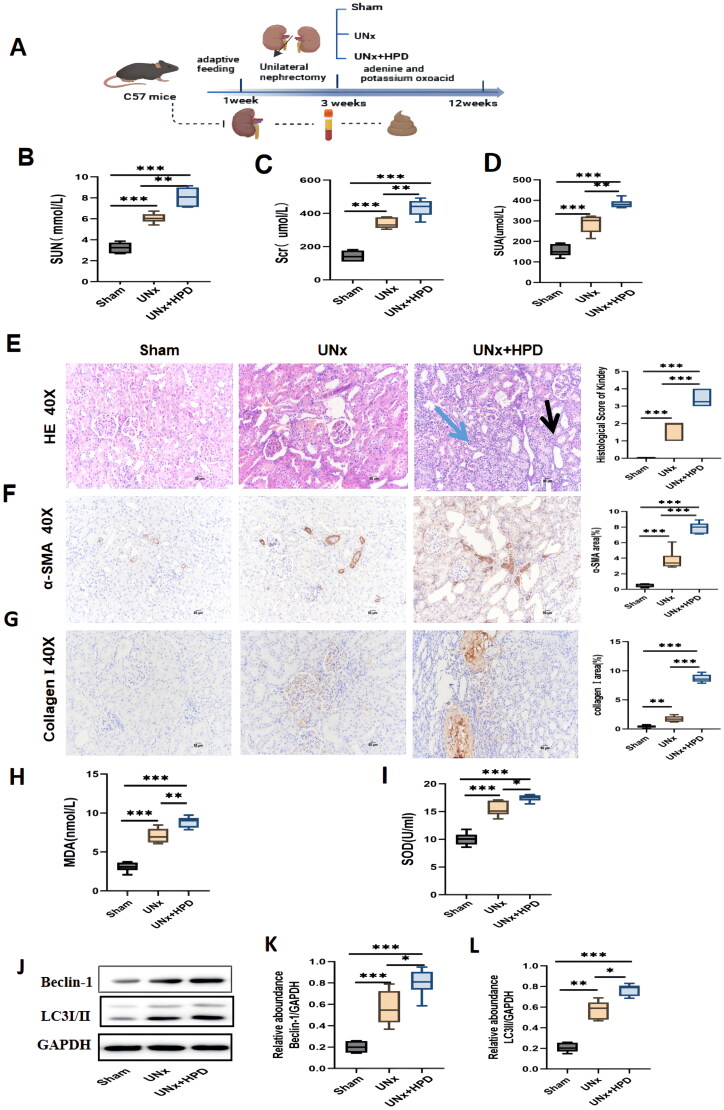
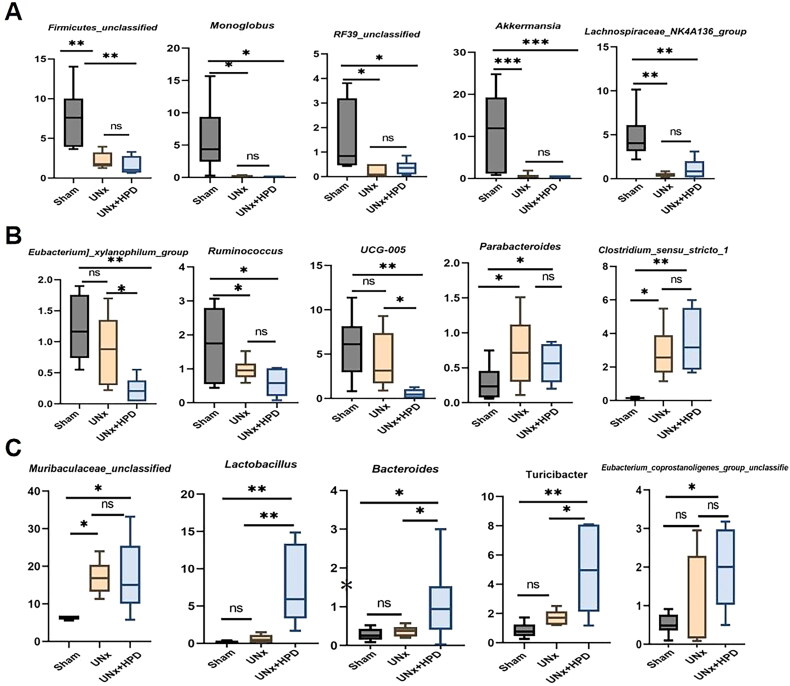
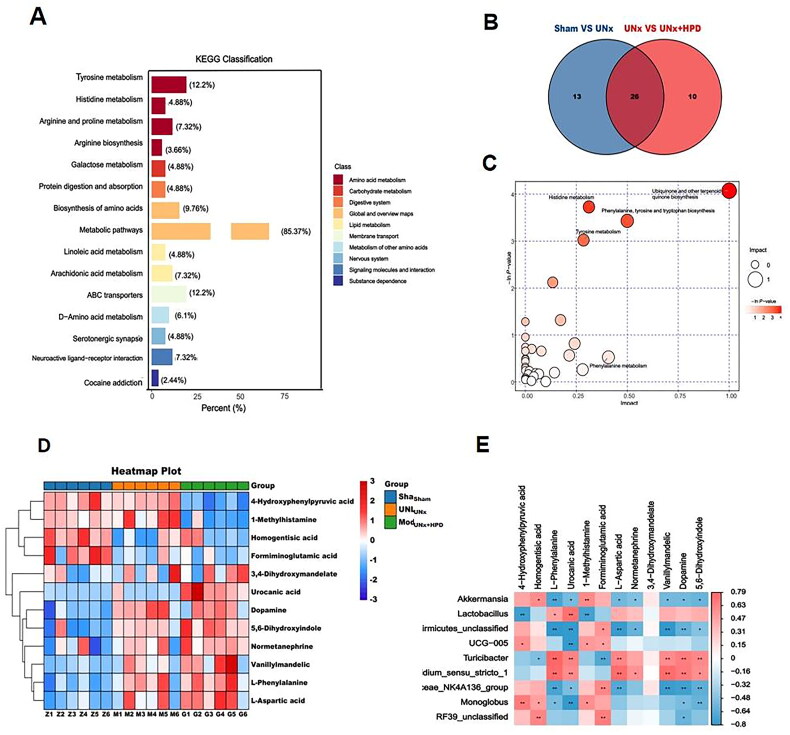
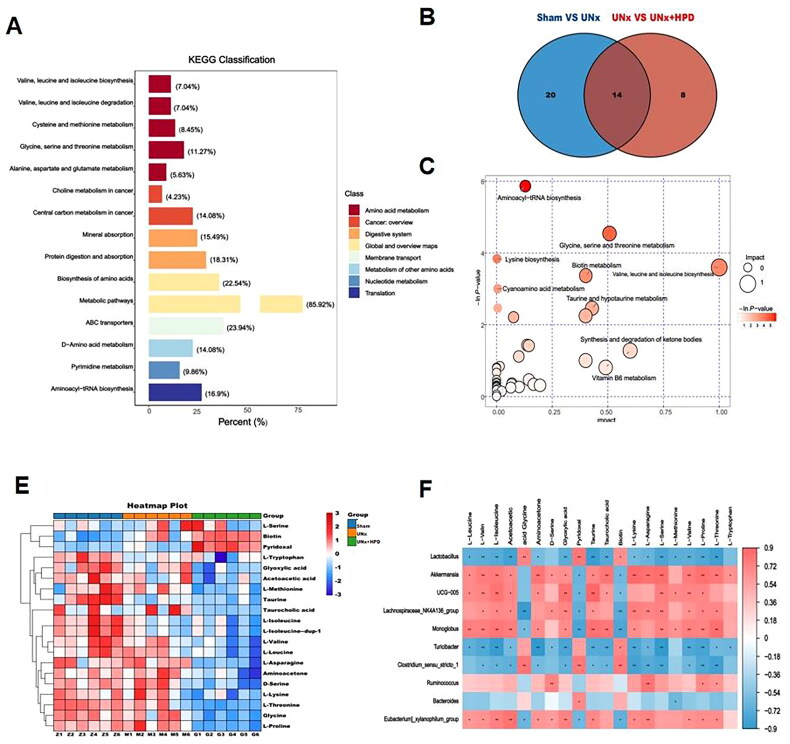
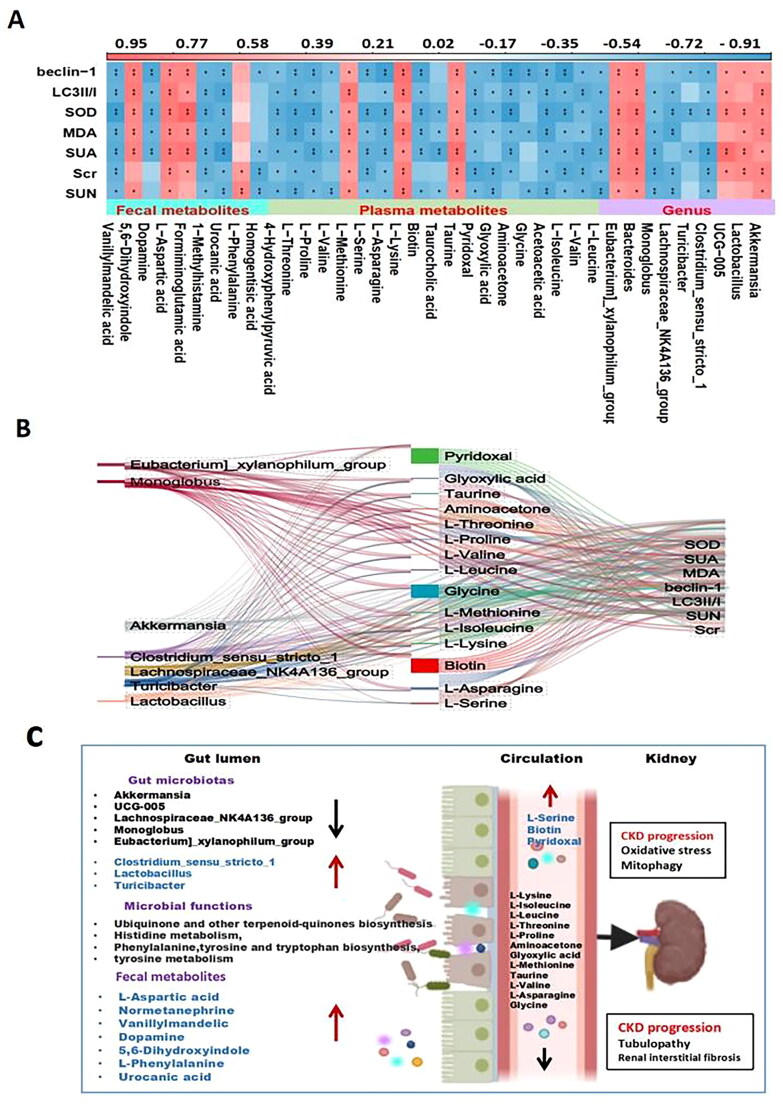
Objectives: To investigate the role of the intestinal flora and metabolites in the development of hyperuricemic renal injury in chronic kidney disease (CKD).Methods: Unilaterally nephrectomized mice were fed with adenine and potassium oxonate for 9 weeks. HE staining combined with plasma biochemical indicators was used to evaluate renal pathological and functional changes. We conducted 16S rRNA sequencing and untargeted metabolomics on feces and plasma samples to reveale changes in intestinal microbiota and metabolites.Result: Our analysis revealed significant differences in 15 bacterial genera, with 7 being upregulated and 8 being downregulated. Furthermore, metabolomic analysis revealed changes in the distribution of amino acid and biotin metabolites in basic metabolic pathways in both feces and serum. Specifically, differentially abundant metabolites in feces were associated primarily with histidine metabolism; the biosynthesis of phenylalanine, tyrosine, and tryptophan; and tyrosine metabolism. In plasma, the differentially abundant metabolites were involved in multiple metabolic pathways, including aminoacyl-tRNA biosynthesis; glycine, serine, and threonine amino acid metabolism; valine, leucine, and isoleucine biosynthesis; tyrosine biosynthesis and metabolism; biotin metabolism; and taurine and hypotaurine metabolism. Furthermore, correlation analysis revealed that Akkermansia, UCG-005, Lachnospiraceae_NK4A136_group, Lactococcus, and Butymonas were associated with various differentially abundant metabolites as well as renal function, oxidative stress, and mitophagy. The changes in the intestinal flora observed in hyperuricemia may lead to imbalances in amino acid and biotin metabolism in both the intestine and host, ultimately affecting oxidative stress and mitophagy in mice and accelerating the progression of CKD.Conclusion: Our findings provide insights into a potential pathogenic mechanism by which hyperuricemia exacerbates renal injury in mice with renal insufficiency. Understanding these pathways may offer new therapeutic strategies for managing hyperuricemic renal injury in CKD patients.

Keywords: Chronic kidney disease; gut microbiota; hyperuricemia; metabolism profiling; renal injury.


Conflict of interest statement

Upon manuscript submission, all the authors completed the author disclosure form. The authors declare that they have no competing interests.

Figures

Figure 1.
Figure 1.
Kidney injury caused by hyperuricemia (HUA) in UNx mice. (A) The flowchart of the animal experiment. (B–D) Alteration of serum creatinine(scr), urea (SUN), and uric acid (SUA) in three groups of mice. The data are expressed as mean ± SEM (n = 6). (E) Representative images (40×) for hematoxylin and eosin(H&E) staining of kidney tissues and score of renal injury; green arrow points to renal interstitial inflammatory changes, the black arrow points to vacuolization and atrophy of the renal tubules. (F) Immunohistochemical staining of α-smooth muscle actin(α-SMA) in kidney tissues and percentage of α-SMA positive area. (G) immunohistochemical staining of collagen I in kidney tissues and percentage of collagen I positive area. (H-I) Concentrations of malondialdehyde(MDA) and superoxide dismutase(SOD) in kidney tissue; (J–L) Western blotting detection of expression of microtubule-associated protein 1 light chain 3 I/II(LC3I/II) and Beclin I in kidney tissue and histogram analysis. ns, not significant; *p < 0.05; **p < 0.01; ***p < 0.001. Analysis was performed by ANOVA followed by Tukey’s multiple comparison test. Sham, sham operations group; UNx, unilateral nephrectomy group; UNx + HPD, unilateral nephrectomy + adenine and potassium oxinate diet.
Figure 2.
Figure 2.
A high-purine diet altered the fecal microbiota of UNx mice. (A,B) Rarefaction curves showing different numbers of operational taxonomic units(OTUs) and Chao 1 index among three comparisons. (C,D) Violin plot showing different numbers of OTUs and Chao 1 index among three comparisons. (E, F) Principal coordinates analysis (PCoA) and non-metric multidimensional scaling(NMDS) showed significant differences in the intestinal flora of the three groups. (G) Stacked bar graph showing relative abundance of gut bacterial at phylum level. (H) Stacked bar graph showing relative abundance of gut bacteria at genus level. *p < 0.05, **p < 0.01. Sham, sham operations group; UNx, unilateral nephrectomy group; UNx + HPD, unilateral nephrectomy + adenine, and potassium oxinate diet.
Figure 3.
Figure 3.
Identification of specific altered bacteria of UNx mice fed by a high-purine diet. (A–C) Changes in the intestinal flora of mice in the three groups (15 of the top 30) have statistical differences (ANOVA test). ns, not significant; *p < 0.05, **p < 0.01, ***p < 0.001. Sham, sham operations group; UNx, unilateral nephrectomy group; UNx + HPD, unilateral nephrectomy + adenine and potassium oxinate diet.
Figure 4.
Figure 4.
Altertion of metabolomic profiling in fence. (A) Kyoto encyclopedia of genes and genomes (KEGG) classification of fecal differential metabolites between Sham group and model group; (B) Venn plot showing the differential fecal metabolites between Sham group and UNx group, UNx group and UNx + HPD group; (C) Pathway analysis of differential metabolites in feces of Sham group and UNx + HPD group; (D) Heatmap analysis of metabolites involved in differential metabolic pathways of three groups; (F) Correlation analysis of differential metabolites and differential bacteria at genus level. Sham, sham operations group; UNx, unilateral nephrectomy group; UNx + HPD, unilateral nephrectomy + adenine and potassium oxinate diet.
Figure 5.
Figure 5.
Change of metabolomic profiling in plasma. (A) KEGG classification of fecal differential metabolites between Sham group and model group; (B) Venn plot showing the differential plasma metabolites between Sham group and UNx group, UNx group and UNx + HPD group; (C) Pathway analysis of differential metabolites in feces of Sham group and UNx + HPD group; (D) Heatmap analysis of metabolites involved in differential metabolic pathways of three groups; (F) Correlation analysis of differential metabolites and differential bacteria at genus level. Sham, sham operations group; UNx, unilateral nephrectomy group; UNx + HPD, unilateral nephrectomy + adenine and potassium oxinate diet.
Figure 6.
Figure 6.
Correlation analysis of intestinal flora, metabolites and biochemical indicators. (A) Correlation analysis of differential flora, fecal metabolites, plasma metabolites and renal function among the sham group and UNx + HPD group; (B) Sanji diagram showing differences the relationship between the flora and plasma metabolites and biochemical indicators; (C) proposed mechanism of perturbed gut microbiome together with fecal and serum metabolites in pathogenesis of HUA induced-CKD progression. Red arrow indicates upregulation; black arrow indicates downregulation.

Similar articles

Cited by

References

    1. Liu H, Zhang X, Wang Y, et al. Prevalence of hyperuricemia among Chinese adults: a national cross-sectional survey using multistage, stratified sampling. J Nephrol. 2014;27(6):653–658. doi: 10.1007/s40620-014-0082-z. - DOI - PubMed
    1. Johnson RJ, Bakris GL, Borghi C, et al. Hyperuricemia, acute and chronic kidney disease, hypertension, and cardiovascular disease: report of a scientific workshop organized by the National Kidney Foundation. Am J Kidney Dis. 2018;71(6):851–865. doi: 10.1053/j.ajkd.2017.12.009. - DOI - PMC - PubMed
    1. Isaka Y, Takabatake Y, Takahashi A, et al. Hyperuricemia-induced inflammasome and kidney diseases. Nephrol Dial Transplant. 2015;31(6):890–896. doi: 10.1093/ndt/gfv024. - DOI - PubMed
    1. Choe J, Park KY, Kim SK.. Oxidative stress by monosodium urate crystals promotes renal cell apoptosis through mitochondrial caspase-dependent pathway in human embryonic kidney 293 cells: mechanism for urate-induced nephropathy. Apoptosis. 2014;20(1):38–49. doi: 10.1007/s10495-014-1057-1. - DOI - PubMed
    1. Che R, Yuan Y, Huang S, et al. Mitochondrial dysfunction in the pathophysiology of renal diseases. Am J Physiol Renal Physiol. 2014;306(4):F367–F378. doi: 10.1152/ajprenal.00571.2013. - DOI - PubMed

Substances

LinkOut - more resources