

The AORTA Gene score for detection and risk stratification of ascending aortic dilation
- PMID: 39132911
- PMCID: PMC11491154
- DOI: 10.1093/eurheartj/ehae474
The AORTA Gene score for detection and risk stratification of ascending aortic dilation
Abstract
Background and aims: This study assessed whether a model incorporating clinical features and a polygenic score for ascending aortic diameter would improve diameter estimation and prediction of adverse thoracic aortic events over clinical features alone.
Methods: Aortic diameter estimation models were built with a 1.1 million-variant polygenic score (AORTA Gene) and without it. Models were validated internally in 4394 UK Biobank participants and externally in 5469 individuals from Mass General Brigham (MGB) Biobank, 1298 from the Framingham Heart Study (FHS), and 610 from All of Us. Model fit for adverse thoracic aortic events was compared in 401 453 UK Biobank and 164 789 All of Us participants.
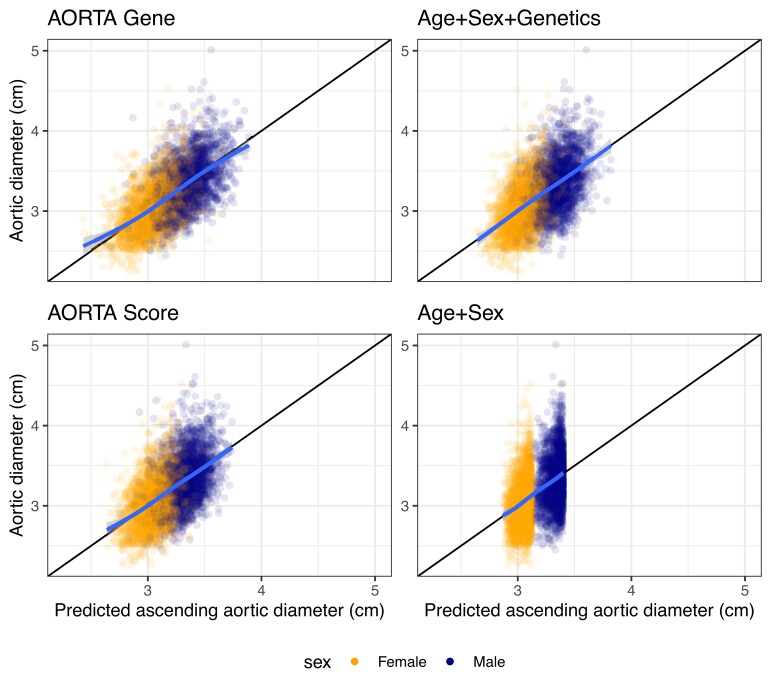
Results: AORTA Gene explained more of the variance in thoracic aortic diameter compared to clinical factors alone: 39.5% (95% confidence interval 37.3%-41.8%) vs. 29.3% (27.0%-31.5%) in UK Biobank, 36.5% (34.4%-38.5%) vs. 32.5% (30.4%-34.5%) in MGB, 41.8% (37.7%-45.9%) vs. 33.0% (28.9%-37.2%) in FHS, and 34.9% (28.8%-41.0%) vs. 28.9% (22.9%-35.0%) in All of Us. AORTA Gene had a greater area under the receiver operating characteristic curve for identifying diameter ≥ 4 cm: 0.836 vs. 0.776 (P < .0001) in UK Biobank, 0.808 vs. 0.767 in MGB (P < .0001), 0.856 vs. 0.818 in FHS (P < .0001), and 0.827 vs. 0.791 (P = .0078) in All of Us. AORTA Gene was more informative for adverse thoracic aortic events in UK Biobank (P = .0042) and All of Us (P = .049).
Conclusions: A comprehensive model incorporating polygenic information and clinical risk factors explained 34.9%-41.8% of the variation in ascending aortic diameter, improving the identification of ascending aortic dilation and adverse thoracic aortic events compared to clinical risk factors.
Keywords: All of Us; Aortic dissection; Ascending aorta; Framingham Heart Study; Polygenic score; UK Biobank.
© The Author(s) 2024. Published by Oxford University Press on behalf of the European Society of Cardiology. All rights reserved. For commercial re-use, please contact reprints@oup.com for reprints and translation rights for reprints. All other permissions can be obtained through our RightsLink service via the Permissions link on the article page on our site—for further information please contact journals.permissions@oup.com.
Figures


Update of
-
AORTA Gene: Polygenic prediction improves detection of thoracic aortic aneurysm.medRxiv [Preprint]. 2023 Aug 25:2023.08.23.23294513. doi: 10.1101/2023.08.23.23294513. medRxiv. 2023. Update in: Eur Heart J. 2024 Oct 21;45(40):4318-4332. doi: 10.1093/eurheartj/ehae474. PMID: 37662232 Free PMC article. Updated. Preprint.
References
-
- Howard DPJ, Banerjee A, Fairhead JF, Perkins J, Silver LE, Rothwell PM, et al. Population-based study of incidence and outcome of acute aortic dissection and premorbid risk factor control: 10-year results from the Oxford Vascular Study. Circulation 2013;127:2031–7. 10.1161/CIRCULATIONAHA.112.000483 - DOI - PMC - PubMed
-
- Isselbacher EM, Preventza O, Hamilton Black J, Augoustides JG, Beck AW, Bolen MA, et al. 2022 ACC/AHA guideline for the diagnosis and management of aortic disease: a report of the American Heart Association/American College of Cardiology Joint Committee on Clinical Practice Guidelines. Circulation 2022;146:e334–482. 10.1161/CIR.0000000000001106 - DOI - PMC - PubMed
MeSH terms
Grants and funding
- OT2 OD026556/OD/NIH HHS/United States
- OT2 OD025315/OD/NIH HHS/United States
- OT2 OD026551/OD/NIH HHS/United States
- OT2 OD026552/OD/NIH HHS/United States
- OT2 OD026549/OD/NIH HHS/United States
- OT2 OD025337/OD/NIH HHS/United States
- OT2 OD026550/OD/NIH HHS/United States
- Fredman Fellowship for Aortic Disease
- OT2 OD026553/OD/NIH HHS/United States
- OT2 OD023205/OD/NIH HHS/United States
- K08HL159346/NH/NIH HHS/United States
- OT2 OD026554/OD/NIH HHS/United States
- U24 OD023163/OD/NIH HHS/United States
- OT2 OD023206/OD/NIH HHS/United States
- 18SFRN34110082/American Heart Association
- K08 HL159346/HL/NHLBI NIH HHS/United States
- U01 AG068221/AG/NIA NIH HHS/United States
- 18SFRN34110082/AHA Strategically Focused Research Networks
- U24 OD023176/OD/NIH HHS/United States
- OT2 OD026548/OD/NIH HHS/United States
- Bayer AG
- Boston University School of Medicine
- John S. LaDue Memorial Fellowship in Cardiovascular Medicine from Harvard Medical School
- Toomey Fund for Aortic Dissection Research
- U2C OD023196/OD/NIH HHS/United States
- 1 OT2 OD026549/Regional Medical Centers
- U24 OD023121/OD/NIH HHS/United States
- Framingham Heart Study of the National Heart Lung and Blood Institute
- Harvard Medical School
- OT2 OD025277/OD/NIH HHS/United States
- 521832260/Walter-Benjamin Fellowship from the Deutsche Forschungsgemeinschaft
- 75N92019D00031/HH/HHS/United States
- MAESTRIA 965286/European Union
- OT2 OD026555/OD/NIH HHS/United States
- National Heart Lung and Blood Institute
- OT2 OD025276/OD/NIH HHS/United States
- 75N92019D00031/HL/NHLBI NIH HHS/United States
- K23 HL169839/HL/NHLBI NIH HHS/United States
- OT2 OD026557/OD/NIH HHS/United States
- 521832260/Deutsche Forschungsgemeinschaft
LinkOut - more resources
Full Text Sources
