. 2024;44(9):391-409.
doi: 10.1080/10985549.2024.2383296. Epub 2024 Aug 12.

FUS-Mediated Inhibition of Myogenesis Elicited by Suppressing TNNT1 Production

Affiliations

FUS-Mediated Inhibition of Myogenesis Elicited by Suppressing TNNT1 Production

Eunbyul Ji et al. Mol Cell Biol. 2024.

Abstract

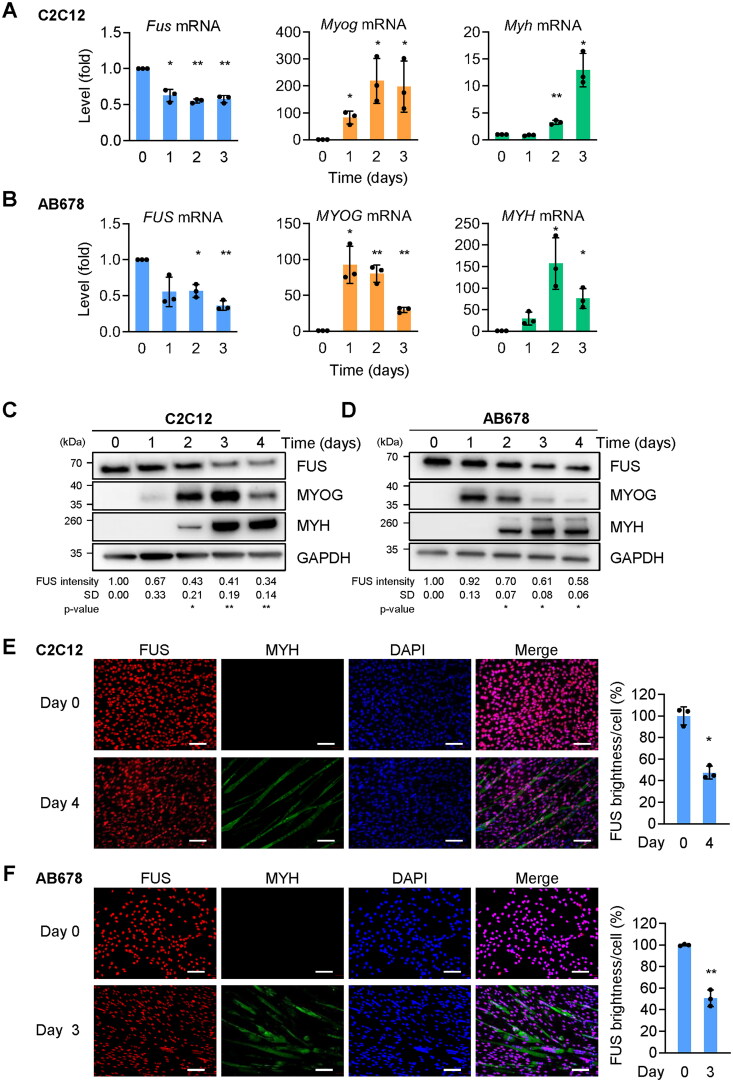
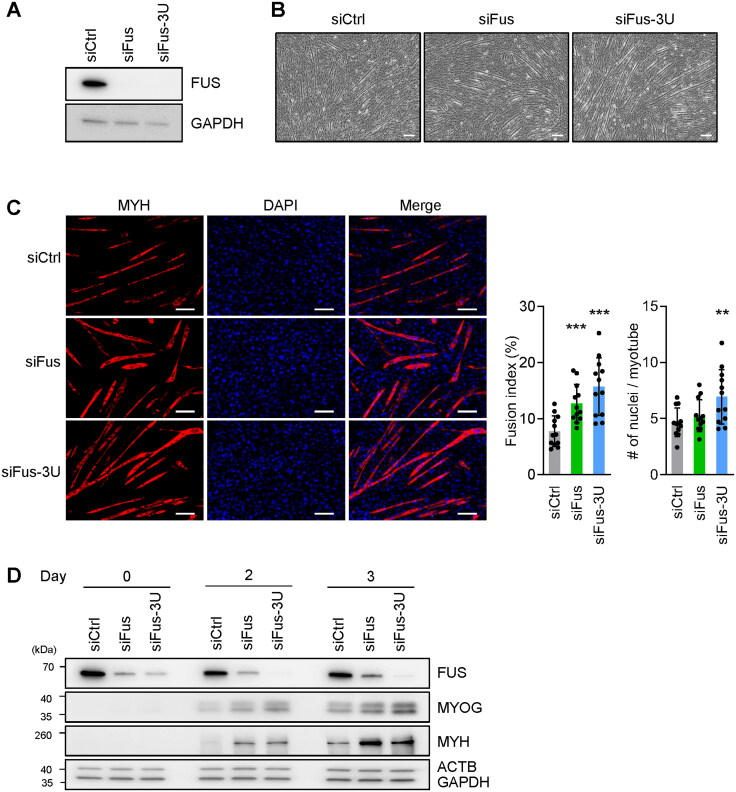
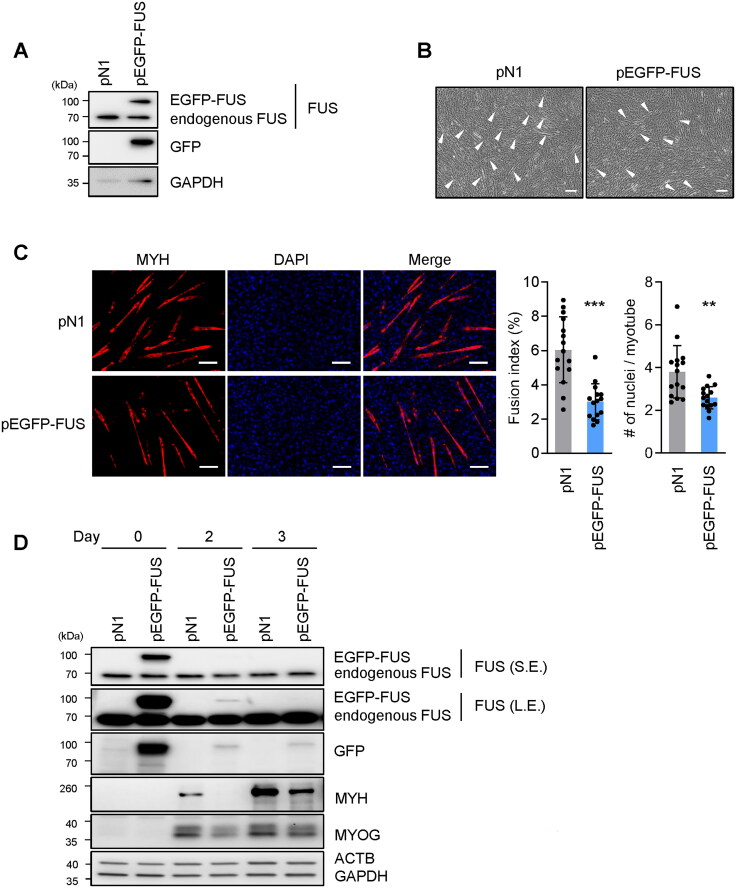
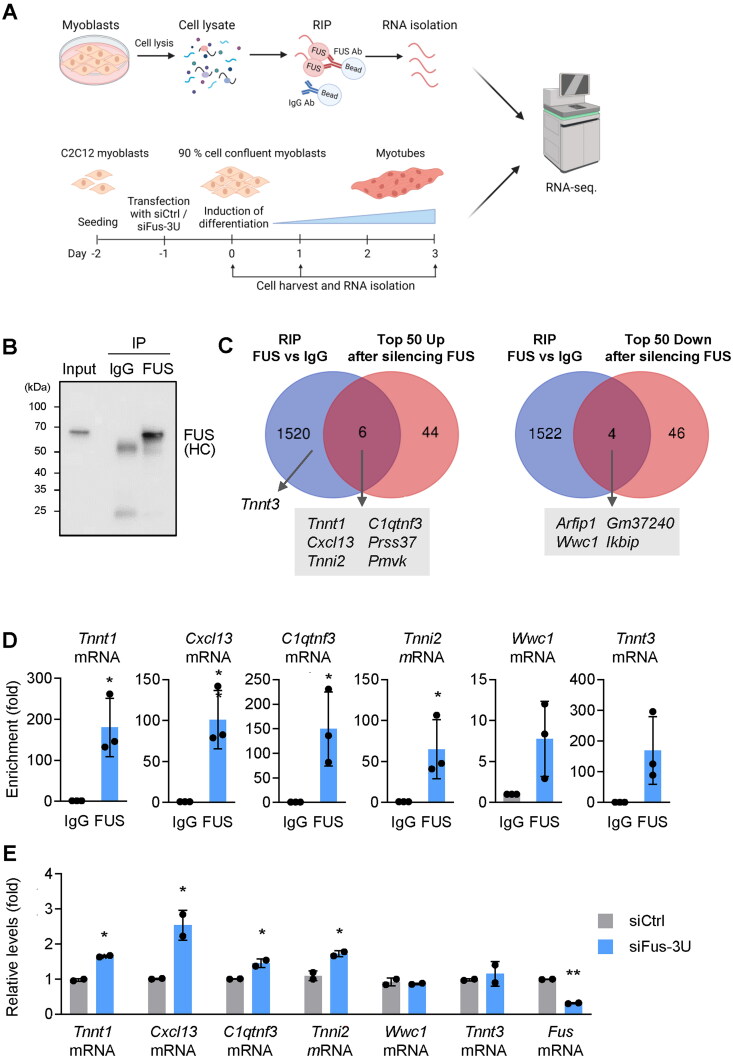
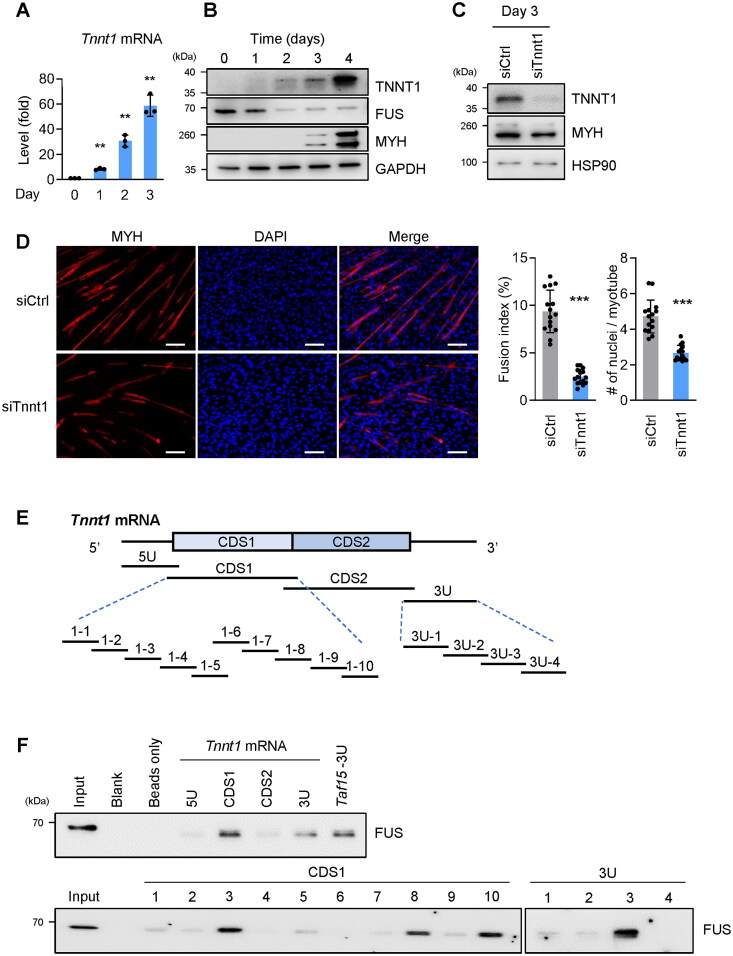
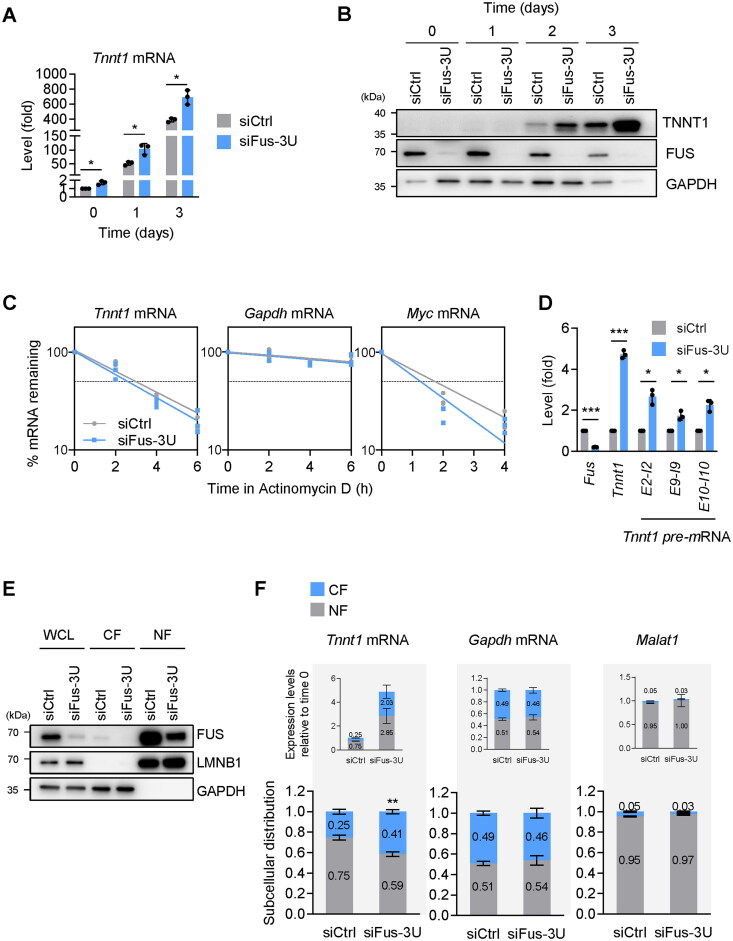
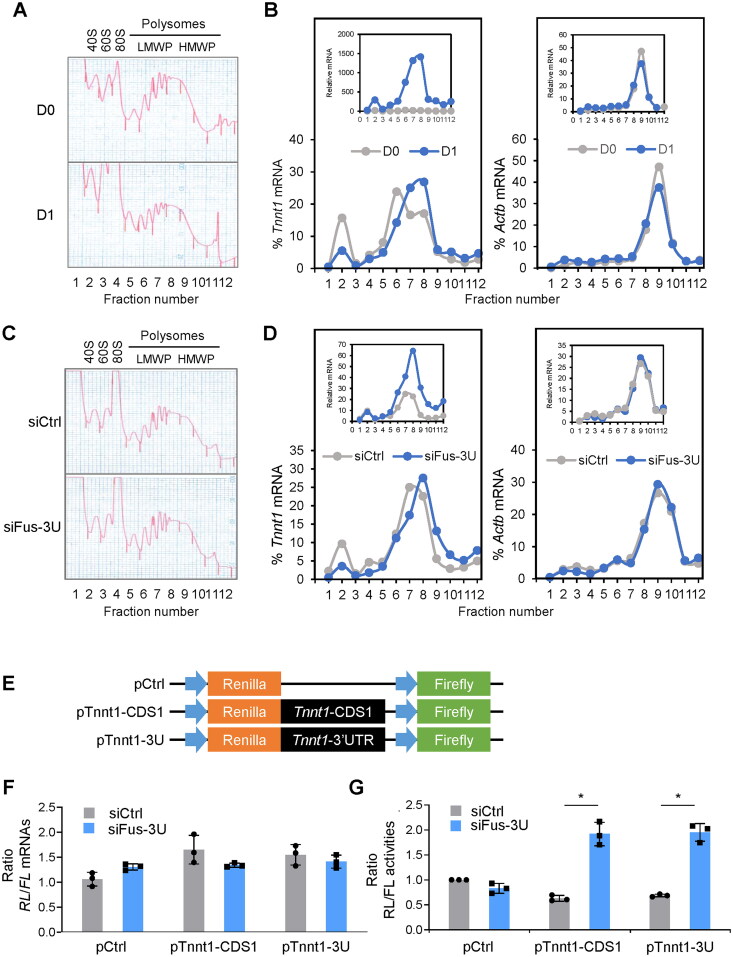
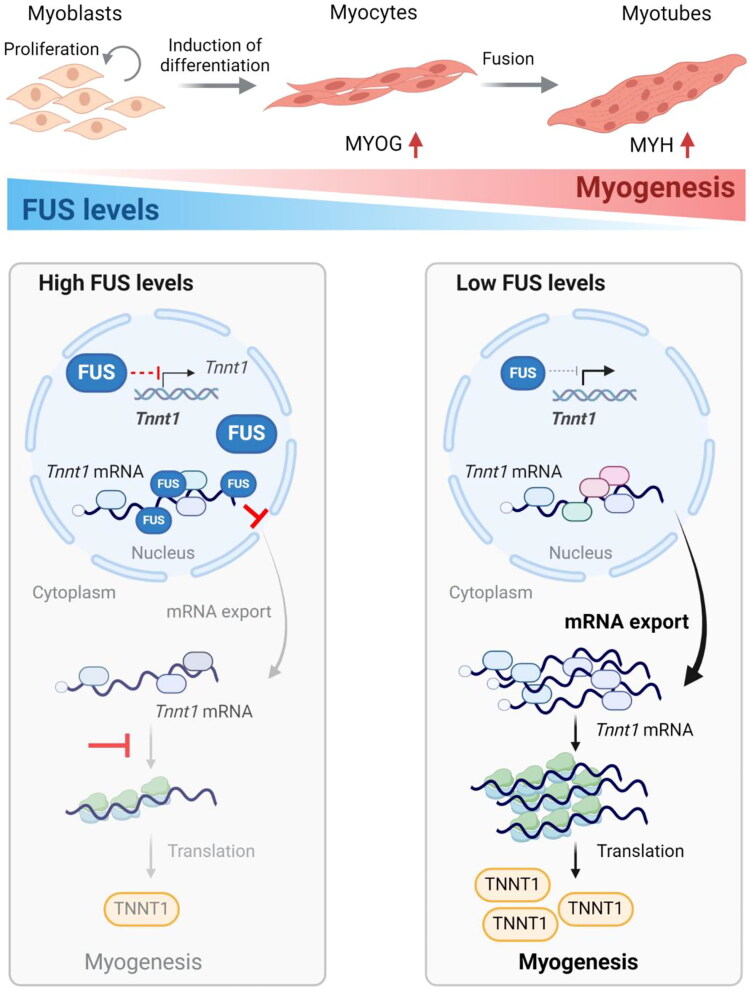
Myogenesis is a highly orchestrated process whereby muscle precursor cells, myoblasts, develop into muscle fibers to form skeletal muscle during embryogenesis and regenerate adult muscle. Here, we studied the RNA-binding protein FUS (fused in sarcoma), which has been implicated in muscular and neuromuscular pathologies but is poorly characterized in myogenesis. Given that FUS levels declined in human and mouse models of skeletal myogenesis, and that silencing FUS enhanced myogenesis, we hypothesized that FUS might be a repressor of myogenic differentiation. Interestingly, overexpression of FUS delayed myogenesis, accompanied by slower production of muscle differentiation markers. To identify the mechanisms through which FUS inhibits myogenesis, we uncovered RNA targets of FUS by ribonucleoprotein immunoprecipitation (RIP) followed by RNA-sequencing (RNA-seq) analysis. Stringent selection of the bound transcripts uncovered Tnnt1 mRNA, encoding troponin T1 (TNNT1), as a major effector of FUS influence on myogenesis. We found that in myoblasts, FUS retained Tnnt1 mRNA in the nucleus, preventing TNNT1 expression; however, reduction of FUS during myogenesis or by silencing FUS released Tnnt1 mRNA for export to the cytoplasm, enabling TNNT1 translation and promoting myogenesis. We propose that FUS inhibits myogenesis by suppressing TNNT1 expression through a mechanism of nuclear Tnnt1 mRNA retention.

Keywords: Myogenesis; TNNT1; ribonucleoprotein complex; translation.


Conflict of interest statement

No potential conflict of interest was reported by the authors.

Figures

Figure 1.
Figure 1.
Reduced FUS levels during myogenic differentiation. (A) Proliferating mouse C2C12 myoblasts were placed in differentiation medium for the times indicated, and the levels of Myog and Myh mRNAs (encoding myogenic proteins MYOG and MYH, respectively), as well as Fus mRNA (encoding FUS), were measured by RT-qPCR analysis. Data were normalized to 18s rRNA levels. (B) Proliferating human AB678 myoblasts were placed in differentiation medium for the times indicated, and the levels of MYOG and MYH mRNAs, encoding myogenic proteins MYOG and MYH, as well as FUS mRNA (encoding FUS) were measured by RT-qPCR analysis. Data were normalized to 18S rRNA levels. (C, D) The levels of the proteins encoded by the mRNAs in (A) and (B) were assessed by Western blot analysis, as shown in (C) and (D), respectively. GAPDH was included as a loading control. The levels of FUS were quantified by densitometric quantification of the FUS signals using ImageJ, and normalized to GAPDH signals. (E, F) Detection of FUS by immunofluorescence microscopy in C2C12 cultures and days 0 and 4 (E) and AB678 cultures at days 0 and 3 (F). MYH signals were included to monitor myotube formation and DAPI was used to stain nuclei. FUS brightness per cell was calculated from the images at day 4 (E) and day 3 (F). Data in (A–F) represent the means ± SD of a minimum of three independent experiments. Statistical significance (*P < 0.05; **P < 0.01) was assessed with Student’s t test. Scale bars, 100 μm.
Figure 2.
Figure 2.
FUS silencing promotes myotube formation. (A–C) Proliferating C2C12 cells were transfected with siRNAs directed at Fus mRNA [either the coding region (siFus), or the 3′UTR (siFus-3U)], and then they were induced to differentiate and were studied 3 days later. Analyses included monitoring the levels of FUS (A), the levels of myotube formation by phase-contrast microscopy (B), and the levels of MYH-positive myotubes by fluorescence microscopy (using DAPI to stain nuclei) (C, left). Fusion indices and number of nuclei per myotube were also quantified (C, right). (D) Cells were processed as explained for (A–C), but the levels of the proteins shown were assessed by Western blot analysis at days 0, 2, and 3 into differentiation. ACTB and GAPDH were included as internal controls. Data in (C) represent the means ± SD and from three separate fields per experiment. Statistical significance (**P < 0.01; ***P < 0.001) was assessed with Student’s t test. Scale bars, 100 μm.
Figure 3.
Figure 3.
FUS overexpression impairs myotube formation. (A–C) Proliferating C2C12 cells were transfected with either a control plasmid expressing only EGFP pEGFP-N1 (pN1) or a plasmid to overexpress FUS fused to EGFP (pEGFP-FUS); 24 h later, C2C12 cells were induced to differentiate and studied on day 3 of myogenesis. Analyses included monitoring the levels of endogenous FUS and ectopically overexpressed FUS (EGFP-FUS) (A), monitoring myotube formation by phase-contrast microscopy (B), and evaluating the levels of MYH-positive myotubes by fluorescence microscopy using DAPI to stain nuclei (C, left). Fusion indices and number of nuclei per myotube were also quantified (C, right). (D) Cells were processed as explained for (A–C), but the levels of the proteins shown were assessed by Western blot analysis at days 0, 2, and 3 of myogenesis. S.E., short exposure; L.E., long exposure. ACTB and GAPDH were included as internal controls. In (B), arrowheads indicate myotubes. Data in (C) represent the means ± SD and from three separate fields per experiment. Statistical significance (**P < 0.01; ***P < 0.001) was assessed with Student’s t test. Scale bars, 100 μm.
Figure 4.
Figure 4.
Screening of new targets of FUS by RNA-seq analysis. (A) Workflow of sample preparation for total RNA-seq analysis; created using BioRender. Lysates were prepared from proliferating C2C12 cells and an anti-FUS antibody was used to perform RIP analysis; after isolating the RNA bound to the anti-FUS beads and the IgG beads, RNA-seq analysis was carried out (top). Proliferating C2C12 cells were transfected with siFus-3U or control siCtrl; 24 h later, myoblasts were induced to differentiate and total RNA was collected on days 0, 1, and 3 for RNA-seq-mediated identification of mRNAs differentially abundant (bottom). RNA-seq data are deposited in GSE267276. (B) Quality control of the RIP analysis in C2C12 cells was confirmed by Western blot analysis to detect FUS in each immunoprecipitated sample; (HC), heavy IgG chain. (C) Venn diagrams of the transcriptomes identified by RIP-seq (top arm, panel A) and by total RNA-seq analysis after FUS silencing (bottom arm, panel A). Those RNAs showing enrichments > 4-fold and padj < 0.05 with anti-FUS antibody (relative to IgG) were considered as FUS-bound RNAs. “Top 50 Up” and “Top 50 Down” refer to RNAs showing significantly different levels at day 0 in siFus-3U relative to siCtrl (padj < 0.05). (D, E) Validation of select mRNAs identified at the intersection of being altered in abundance when FUS was silenced and being associated with FUS. Enrichments (D) were validated by RIP followed by RT-qPCR analysis (normalized to Gapdh mRNA, not a target of FUS). Total mRNA levels (E) were measured in proliferating C2C12 cells (Gapdh mRNA was used for normalization of RT-qPCR results). Data in (D, E) represent the means ± SD from three and two independent replicates, respectively. Statistical significance (*P < 0.05; **p < 0.01; ***P < 0.001) was assessed with Student’s t test. In (B), the image is representative from three independent experiments.
Figure 5.
Figure 5.
Lowering TNNT1 expression levels suppresses myogenesis. (A, B) In C2C12 myoblasts undergoing myogenesis, Tnnt1 mRNA expression levels were quantified by RT-qPCR analysis, normalized to 18s rRNA levels (A), and the levels of TNNT1, along with the levels of FUS, MYH, and loading control GAPDH, were assessed by Western blot analysis (B). (C, D) TNNT1 expression was silenced in C2C12 myoblasts by transfection of siTnnt1 (siCtrl in control transfections); 24 h later, cells were induced to differentiate and 3 days after that the levels of TNNT1 (and controls MYH and HSP90) were measured by Western blot analysis (C) and the formation of myotubes was assessed by detecting MYH (and DAPI-stained nuclei) using fluorescence microscopy, followed by quantification of fusion indices and number of nuclei per myotube (D). (E) Schematic of biotinylated RNAs prepared spanning the mouse Tnnt1 mRNA for biotin pulldown analysis. The biotinylated RNAs synthesized spanned the 5′UTR (5U), the coding region (CDS1, CDS2) and the 3′UTR (3U). From CDS1 and 3U, smaller biotinylated RNAs corresponding to segments of the larger RNAs were prepared for analysis. (F) Biotin pulldown analysis using the biotinylated RNAs shown in (E) and C2C12 cell lysates; after the incubation, the presence of FUS-RNA complexes was detected by using streptavidin beads to bring down the complexes, followed by detection of FUS by Western blot analysis. Data in (A, D) represent the means ± SD of three or more independent experiments. Significance (**P < 0.01, ***P < 0.001) was assessed with Student’s t test in all panels. Scale bars, 100 µm.
Figure 6.
Figure 6.
Silencing FUS promotes TNNT1 expression. (A, B) FUS was silenced in C2C12 myoblasts by transfecting siFus-3U (or siCtrl in control transfections); 24 h later, they were placed in differentiation medium and the levels of Tnnt1 mRNA (and 18S rRNA for normalization) were quantified by RT-qPCR analysis (A), and the levels of TNNT1 protein (and controls FUS and GAPDH) by Western blot analysis, at the times shown after the start of differentiation. (C) In C2C12 cells transfected as explained in (A), the relative stability of Tnnt1 mRNA (as well as stable control Gapdh mRNA and labile control Myc mRNA) in each transfection group was measured by incubating cells with 2.5 μg/mL of actinomycin D to block de novo transcription, collecting total RNA at the time shown, and measuring the levels of mRNAs (normalized to 18s rRNA levels) at each time after adding actinomycin D to evaluate their decay rates. (D) Proliferating C2C12 cells were transfected with siFus-3U (or siCtrl in control transfections); 48 h later, the relative levels of mature Tnnt1 mRNA as well as nascent Tnnt1 pre-mRNAs were measured by RT-qPCR analysis using specific primers. 18s rRNA was used as internal control for normalization of RT-qPCR data. (E) C2C12 cells were processed as described in (D) and whole-cell lysates (WCL), cytoplasmic fraction (CF), and nuclear fraction (NF) were prepared. Western blot analysis was used to ascertain the subcellular localization of FUS in each transfection group and each fraction; the nuclear protein Lamin B1 (LMNB1) and the cytoplasmic protein GAPDH were included as controls. (F) RNA was prepared from the CF and NF in the cells described in (E) and the levels of Tnnt1 mRNA and controls Gapdh mRNA and Malat1 (a nuclear lncRNA) were quantified by RT-qPCR analysis. The data were represented in two ways: as the subcellular distribution of RNAs in NF vs CF in both transfection groups (each equal to 1.0, bottom graphs) and as the expression levels of RNAs in NF and CF in both transfection groups (each relative to siCtrl, top graphs). Data in (A, C, D, F) represent the means ± SD of three or more individual experiments; other data are representative from three independent experiments. Significance (*P < 0.05, **P < 0.01, ***P < 0.001) was assessed with Student’s t test.
Figure 7.
Figure 7.
FUS inhibits Tnnt1 mRNA cytoplasmic export and translation. (A, B) C2C12 cells that were either proliferating (D0) or 24 h into differentiation (D1) were collected, and cytoplasmic lysates were fractionated through linear 10–50% sucrose density gradients; the fractionation traces (A) depicted ribosome subunits (40S, 60S), monosomes (80S), and polysomes of low- and high-molecular-weight (LMWP and HMWP, respectively). RNA was isolated from each fraction and the levels of Tnnt1 mRNA and control Actb mRNA were measured in each fraction and represented in two different ways; in one, the Tnnt1 and Actb mRNAs in each gradient (D0 and D1) were normalized to 100% and the levels in each fraction represented as a percentage of the total (bottom graphs); in the other, the relative abundance of Tnnt1 and Actb mRNAs in the D1 gradient relative to the D0 gradient was reflected (top graphs). (C, D) C2C12 cells in which FUS was silenced (siFus-3U) or not (siCtrl) were fractionated and processed as described in (A, B). Similarly, the levels of Tnnt1 and Actb mRNAs were represented by normalizing the total on each gradient to 100% and representing the distribution of the mRNA in each fraction (bottom graphs) as well as by preserving the relative abundance in the siFus-3U transfection group relative to the siCtrl transfection group (top graphs). (E) Schematic of the dual luciferase reporter constructs tested. The psiCHECK2 plasmid (pCtrl) was used to clone on the 3′ end of the Renilla coding region either the Tnnt1-CDS1 (pTnnt1-CDS1) or the Tnnt1-3U (pTnnt1-3U). (F, G) C2C12 cells were transfected with siFus-3U or siCtrl; 24 h later, the three vectors shown in (E) were transfected, and 24 h after that the levels of RL mRNA and FL mRNA (F) as well as the RL and FL activities (G) were measured in each transfection group. Data in (F, G) represent the means ± SD from three independent experiments. Statistical significance (*P < 0.05) was assessed with Student’s t test. Data in A–D are representative of three independent fractionation experiments.
Figure 8.
Figure 8.
Proposed function of FUS in myogenesis. In proliferating myoblasts, FUS is highly abundant in the nucleus and retains Tnnt1 mRNA, preventing its export to the cytoplasm. Following the induction of myogenesis, FUS levels decline, allowing Tnnt1 mRNA to be exported to the cytoplasm and to be translated as the myogenic program progresses. In sum, FUS negatively regulates myogenesis by retaining Tnnt1 mRNA in the nucleus, preventing premature TNNT1 production. Model was created using BioRender.

Similar articles

References

    1. Distefano G, Goodpaster BH.. Effects of exercise and aging on skeletal muscle. Cold Spring Harb Perspect Med. 2018;8:a029785. doi: 10.1101/cshperspect.a029785. - DOI - PMC - PubMed
    1. Schmidt M, Schüler SC, Hüttner SS, von Eyss B, von Maltzahn J.. Adult stem cells at work: regenerating skeletal muscle. Cell Mol Life Sci. 2019;76:2559–2570. doi: 10.1007/s00018-019-03093-6. - DOI - PMC - PubMed
    1. McKenna CF, Fry CS.. Altered satellite cell dynamics accompany skeletal muscle atrophy during chronic illness, disuse, and aging. Curr Opin Clin Nutr Metab Care. 2017;20:447–452. doi: 10.1097/mco.0000000000000409. - DOI - PMC - PubMed
    1. André LM, Ausems CRM, Wansink DG, Wieringa B.. Abnormalities in skeletal muscle myogenesis, growth, and regeneration in myotonic dystrophy. Front Neurol. 2018;9:368. doi: 10.3389/fneur.2018.00368. - DOI - PMC - PubMed
    1. Luo H, Lv W, Tong Q, Jin J, Xu Z, Zuo B.. Functional non-coding RNA during embryonic myogenesis and postnatal muscle development and disease. Front Cell Dev Biol. 2021;9:628339. doi: 10.3389/fcell.2021.628339. - DOI - PMC - PubMed

Publication types

Associated data