. 2024 Nov 4;223(11):e202308064.
doi: 10.1083/jcb.202308064. Epub 2024 Aug 12.

Histone H4 acetylation differentially modulates proliferation in adult oligodendrocyte progenitors

Affiliations

Histone H4 acetylation differentially modulates proliferation in adult oligodendrocyte progenitors

David K Dansu et al. J Cell Biol. .

Abstract

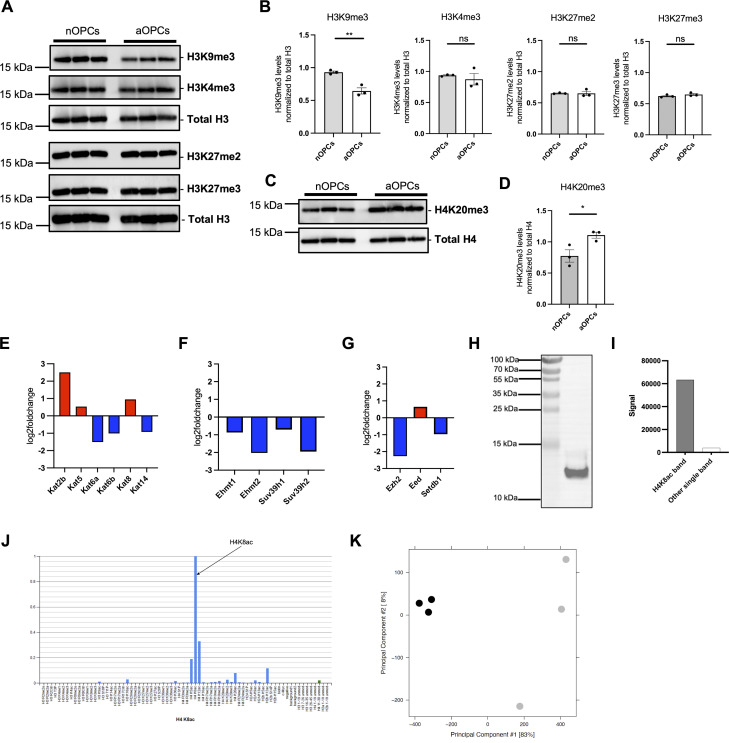
Adult oligodendrocyte progenitors (aOPCs) generate myelinating oligodendrocytes like neonatal progenitors (nOPCs), and they also display unique functional features. Here, using unbiased histone proteomics analysis and ChIP sequencing analysis of PDGFRα+ OPCs sorted from neonatal and adult Pdgfra-H2B-EGFP reporter mice, we identify the activating H4K8ac histone mark as enriched in the aOPCs. We detect increased occupancy of the H4K8ac activating mark at chromatin locations corresponding to genes related to the progenitor state (e.g., Hes5, Gpr17), metabolic processes (e.g., Txnip, Ptdgs), and myelin components (e.g., Cnp, Mog). aOPCs showed higher levels of transcripts related to lipid metabolism and myelin, and lower levels of transcripts related to cell cycle and proliferation compared with nOPCs. In addition, pharmacological inhibition of histone acetylation decreased the expression of the H4K8ac target genes in aOPCs and decreased their proliferation. Overall, this study identifies acetylation of the histone H4K8 as a regulator of the proliferative capacity of aOPCs.


Conflict of interest statement

Disclosures: The authors declare no competing interests exist.

Figures

Figure 1.
Figure 1.
The transcriptome of PDGFRα+ adult oligodendrocyte progenitors is distinct from that of the neonatal progenitors. (A) Flowchart of fluorescence-activated cell sorting of nOPCs (n = 3) and aOPCs (n = 3) from Pdgfra-H2B-EGFP reporter mice followed by RNA-seq analysis. (B) Volcano plot showing the differentially expressed genes between aOPCs and nOPCs. Differentially downregulated genes in aOPCs compared with nOPCs are shown in blue and differentially upregulated genes are shown in red. (C) Dot plot showing the GSEA gene ontology categories associated with the differentially expressed genes in aOPCs compared to nOPCs. (D–F) Heatmaps of selected biological processes with downregulated genes in aOPCs compared with nOPCs in blue and upregulated genes in red. Note that genes within cell cycle and proliferation ontologies are expressed at lower levels in aOPCs (D), while lipid metabolic process (E) and myelin sheath (F) are expressed at higher levels.
Figure 2.
Figure 2.
Adult OPCs are characterized by higher transcript levels of oligodendrocyte stage-specific genes. (A) GSEA plot showing enrichment of genes related to the myelin sheath in aOPCs. (B) Confocal image of neonatal (P5) and adult (P60) mouse brain sections, after in situ hybridization using RNAscope and probes specific for the myelin gene Cnp (red), for the transcription factor Olig2+ (white) and the progenitor marker Pdgfrα+ (green). DAPI (blue) used as a nuclear counterstain. (C) GSEA plot showing enrichment of genes related to lipid metabolism in aOPCs. (D) Confocal image of neonatal (P5) and adult (P60) mouse brain sections after in situ hybridization using RNAscope and probes specific for the oligodendrocyte specific gene Ptgds (red), Olig2+ (white), and Pdgfrα+ (green). DAPI (blue) was used as a nuclear counterstain.
Figure 3.
Figure 3.
Adult oligodendrocyte progenitors are characterized by distinct histone H4 acetylation marks compared to neonatal progenitors. (A) Flowchart of the experimental approach conducted on histone extracts obtained from nOPCs (n = 3) and aOPCs (n = 3) sorted from Pdgfra-H2B-EGFP reporter mice. (B and C) Summary of the results of the unbiased histone proteomic analysis. The schematics show the amino acid sequence in the tail of histone H3 (B) and histone H4 (C), with all the histone PTMs identified by squares (acetylation), circles (methylation), and triangles (phosphorylation). (D) Western blots of histone extracts from three independent preparations of sorted nOPCs and aOPCs, probed with antibodies specific for the indicated acetylated lysine residues on histone H3 (H3K9ac, H3K18ac, and H3K27ac). Total H3 levels were used as a reference for equal loading. (E) Quantification of the immunoreactive bands for H3K9ac, H3K18ac, and H3K27ac relative to total H3. Data represented as mean ± SD for n = 3 independent biological samples (ns = not significant, two-tailed Student’s t test). (F) Western blots of histone extracts from three independent preparations of sorted nOPCs and aOPCs, probed with antibodies specific for the indicated acetylated lysine residues on histone H4 (H4K8ac, H4K12ac, H4K16ac, and H4K5ac). (G) Quantification of H4K8ac, H4K12ac, H4K16ac, and H4K5ac levels relative to the levels of total H4. Data represented as mean ± SEM for n = 3 independent biological samples (*P < 0.05, **P < 0.01 two-tailed Student’s t test). Source data are available for this figure: SourceData F3.
Figure S1.
Figure S1.
Differential histone methylation marks and differential expression of lysine acetyltransferases in aOPCs and validation of antibody specificity and overall quality assessment of ChIP-seq data. (A) Western blots of histone extracts from three independent preparations of sorted nOPCs and aOPCs, probed with antibodies specific for the indicated methylated lysine residues on histone H3 (H3K9me3, H3K4me3, H3K27me2, and H3K27me3) in histone extracts from nOPCs and aOPCs. The total H3 blot in this figure is the same as the total H3 blot in Fig. 3 D. The membrane was stripped and reprobed for different histone H3 marks. (B) Quantification of H3K9me3, H3K4me3, H3K27me2, and H3K27me3 levels after normalization to total H3. Data represented as mean ± SEM normalized to total histone H3 for n = 3 (**P < 0.01, two-tailed-Student’s t test). (C) Western blots of histone extracts from three independent preparations of sorted nOPCs and aOPCs, probed with antibodies specific for the histone H4K20me3 mark. The total H4 blot in this figure is the same as the total H4 blot in Fig. 3 F. The membrane was stripped and reprobed for different histone H4 marks. (D) Quantification of H4K20me3 levels after normalization to total H4. Data represented as mean ± SEM normalized to total histone H4 for n = 3 (*P < 0.05, two-tailed Student’s t test). (EG) Differential expression of lysine acetyltransferases (KATs) (E), H3K9 histone methyltransferases (F), and H3K27 histone methyltransferases (G) in aOPCs compared with nOPCs. (H and I) Western blot analysis showing ∼16-fold enrichment of H4K8ac signal relative to any other band in whole cell extracts of Oli-neu ceIls (ENCODE guideline—primary characterization). (J) Results from the modified peptide array (Active Motif, 13005) were used to validate the specificity of the H4K8ac antibody in the presence of competing peptides (ENCODE guideline—secondary characterization). (K) PCA plot assessing the overall quality of ChIP sequencing performed on nOPCs (gray) and aOPCs (black). Source data are available for this figure: SourceData FS1.
Figure 4.
Figure 4.
Adult OPCs in the adult mouse brain have higher levels of H4K8ac compared with neonatal OPCs in the developing mouse brain. (A) Confocal image of cortical areas in coronal brain sections from neonatal (P5) and adult (P60) Pdgfra-H2B-EGFP mice, stained with H4K8ac specific antibodies (red) and DAPI (blue) as a nuclear counterstain. PDGFRα+ cells identified by EGFP expression (green). Scale bar = 50 μm (insert = 2 μm). (B) Violin plots of the nuclear intensity of H4K8ac immunoreactivity in PDGFRα+ cells in developing (nOPCs) and adult (aOPCs) brains. Data represent the H4K8ac immunoreactivity measured in 200 cells from brain sections of three mice (****P < 0.0001, Mann–Whitney non-parametric test). (C) Confocal image of corpus callosum areas in coronal brain sections from neonatal (P5) and adult (P60) Pdgfra-H2B-EGFP mice, stained with H4K8ac specific antibodies (red) and DAPI (blue) as nuclear counterstain. PDGFRα+ cells identified by EGFP expression (green). Scale bar = 50 μm (insert = 2 μm). (D) Violin plots of nuclear intensity of H4K8ac immunoreactivity in PDGFRα+ cells in developing (nOPCs) and adult (aOPCs) brains. Data represent the H4K8ac immunoreactivity measured in 225 cells from n = 3 mice (**P < 0.01, Mann–Whitney non-parametric test).
Figure 5.
Figure 5.
Adult oligodendrocyte progenitors are characterized by increased H4K8ac chromatin occupancy. (A) Flowchart showing the analysis of the H4K8ac ChIP sequencing data from three individual preparations of sorted nOPCs and aOPCs. (B) Genomic heatmaps showing the distribution of H4K8ac peaks in nOPCs and aOPCs at 3 kilobases (kb) around the transcription start site (TSS). (C) Volcano plot showing the differentially called H4K8ac peaks in aOPCs vs nOPCs (significance cut-off at FDR < 0.01). The red circles identify greater genomic occupancy of the H4K8ac mark in aOPCs, while the blue circles represent the few peaks that were present in nOPCs. (D) Pie chart showing the genomic distribution of the H4K8ac differential peaks in the genome of aOPCs, with greater occupancy at promoters, introns, and intergenic regions. (E) Functional annotation of genes with greater H4K8ac genomic occupancy at the promoter, intron, and distal intergenic regions of aOPCs.
Figure 6.
Figure 6.
Adult OPCs are characterized by H4K8ac occupancy at genomic regions containing lipid metabolic process, transcription factor regulation, and myelin protein. (A) Venn diagram showing the overlap between genes characterized by greater H4K8ac occupancy, as detected by ChIP-seq (FDR < 0.01, log2FC[aOPC/nOPC] ≥ 1.5), and genes upregulated in aOPCs, as detected by RNA-seq (FDR < 0.01, log2FC [aOPC/nOPC] ≥ 1). (B) Pie chart showing the biological processes regulated by genes with greater H4K8ac occupancy and higher expression levels in aOPCs (corresponding to the area of overlap in A). (C–E) Representative Integrative Genomics Viewer (IGV) tracks showing H4K8ac enrichment of aOPC genomic regions containing the genes related to lipid metabolic process (C), transcription factor regulation (D), and myelin protein (E) compared with nOPC genomic regions. Data from nOPCs (blue, n = 3) and aOPCs (red, n = 3) chromatin samples are shown. For each panel, the RefSeq gene track (black) is shown.
Figure 7.
Figure 7.
O4+ oligodendrocyte progenitors isolated from neonatal and adult brains are also characterized by higher H4K8ac levels and a distinct transcriptome. (A) Workflow of magnetic-bead-activated immunosorting of O4+ cells from the brain of neonatal (P5) and adult (P60) mice. (B) Western blots of histone extracts from nO4+OPCs and aO4+OPCs. The H4K8ac levels after normalization to total H4 is shown (right). Data represented as mean ± SD normalized to total histone H4 for n = 3 independent cultures (*P < 0.05, two-tailed Student’s t test). (C) Flowchart of the RNA-seq analysis of samples from nO4+OPC and aO4+OPC. (D) Dot plot showing the GSEA gene ontology categories associated with the differentially expressed genes in aO4+OPCs compared to nO4+OPCs. (E) GSEA showing enrichment of genes related to negative regulation of cell cycle in aO4+OPCs. (F) Representative confocal image of cultured nO4+OPCs and aO4+OPCs after 5 h of EdU incorporation for assessment of cell proliferation. DAPI+ and EdU+ cells are shown in blue and green respectively. Scale bar = 50 μm. (G) Quantification of the percentage of EdU+ cells in nO4+OPCs and aO4+OPCs. Data are represented as mean ± SEM normalized to nO4+OPC samples for n = 3 (***P < 0.001, two-tailed Student’s t test). Source data are available for this figure: SourceData F7.
Figure 8.
Figure 8.
Pharmacological inhibition of histone acetylation results in decreased transcripts of cell cycle regulators in aO4+OPCs but not in nO4+OPCs. (A) Representative confocal images of aO4+OPCs treated with KATi (5 μM Garcinol and 0.2 μM NU-9056) or with DMSO (as control) for 48 h and stained with DAPI (blue) and H4K8ac (green). Scale bar = 50 μm. (B) Violin plots showing the nuclear intensity of H4K8ac in KATi treated aO4+OPCs and DMSO controls. Data represent H4K8ac nuclear immunoreactivity measured in a total of 150 cells from three biological replicates (****P < 0.0001, Mann–Whitney non-parametric test). (C) Experimental workflow of RNA-seq analysis on samples from nO4+OPCs (n = 5) and aO4+OPCs (n = 4) treated with KATi and DMSO used as control. (D) Dot plots showing differentially upregulated (red) and downregulated (blue) genes in aO4+OPCs compared to nO4+OPCs after KATi treatment. (E–G) Quantitative real-time PCR (RT-qPCR) validation of selected transcripts that were downregulated in aO4+OPCs but not in nO4+OPCs upon KATi treatment. These transcripts are associated with progenitor markers (Gpr17, Hes5) (E), metabolic process (Txnip) (F) and negative regulation of proliferation (Cdkn1a) (G). (E–G) One-tailed paired sample t test with Bonferroni correction (*P < 0.05; **P < 0.01).
Figure 9.
Figure 9.
Pharmacological inhibition of histone acetylation decreases cell proliferation in aO4+OPCs but not in nO4+OPCs. (A) Representative confocal images of cultured nO4+OPCs and aO4+OPCs in proliferation medium (20 ng/ml PDGF-AA and 20 ng/ml b-FGF) and EdU incorporation for 5 h, stained for EdU (green), OLIG2 (red) and DAPI after 48-h treatment with DMSO or KATi. Scale bar = 50 μm. (B) Quantification of the percentage of EdU+/OLIG2+ cells in nO4+OPCs (DMSO = 3,218 cells, KATi = 2,785 cells) and aO4+OPCs (DMSO = 2,638 cells, KATi = 2,256 cells). Data represented as mean ± SD for three independent preparations of nO4+OPCs and four independent preparations of aO4+OPCs (one-tailed paired sample t test with Bonferroni correction). (C) Cell viability of nO4+OPCs and aO4+OPCs evaluated by MTT assay after treatment with DMSO or KATi. Data represented as mean ± SD from three biological replicates from three independent cultures (One-way ANOVA). (D) Representative confocal images of nO4+OPCs and aO4+OPCs treated with either KATi or DMSO for 48 h and then switched to differentiation medium for 72 h prior to staining with O1 (red) and OLIG2 (green) antibodies. Scale bar = 50 μm. (E) Quantification of the membranous O1+/OLIG2+ cell ratios in nO4+OPCs and aO4+OPCs. Data represented as mean ± SD for three independent experiments in nO4+OPCs and five independent experiments in aO4+OPCs treated with DMSO control and KATi (one-tailed paired sample t test with Bonferroni correction).
Figure S2.
Figure S2.
Pharmacological inhibition of H4K20 trimethylation does not alter the functional properties of both nO4+OPCs and aO4+OPCs. (A) Representative confocal images of aO4+OPCs after treatment with either DMSO or SUV420i (5 μM, A-196) for 48 h and stained with DAPI (blue) and H4K20me3 (red). Scale bar = 20 μm. (B) Violin plots showing nuclear intensity of H4K20me3 in SUV420i treated aO4+OPCs and DMSO controls. Data represent H4K20me3 nuclear immunoreactivity measured in a total of 150 cells from three biological replicates (****P < 0.0001, Mann–Whitney non-parametric test). (C) Experimental workflow of RNA-seq analysis on samples from nO4+OPCs and aO4+OPCs treated with SUV420i and DMSO as control. (D) Quantification of the percentage of EdU+/OLIG2+ cells in nO4+OPCs and aO4+OPCs after 5 h of EdU incorporation. Data are represented as mean ± SD three independent preparations of nO4+OPCs and four independent preparations of aO4+OPCs. (E) Quantification of the membranous O1+/OLIG2+ cell ratios in nO4+OPCs and aO4+OPCs treated for 48 h with the SUV40i or DMSO and then maintained for 72 h in differentiation medium prior to staining with the indicated antibodies. Data represent the mean ± SD for three independent experiments in nO4+OPCs and four for aO4+OPCs treated with DMSO control and SUV420i (two-tailed paired sample t test). (F) Cell viability of nO4+OPCs and aO4+OPCs evaluated by MTT assay after treatment with DMSO or SUV420i. Data are represented as mean ± SD for three separate wells (one-way ANOVA).

References

    1. Agalioti, T., Chen G., and Thanos D.. 2002. Deciphering the transcriptional histone acetylation code for a human gene. Cell. 111:381–392. 10.1016/S0092-8674(02)01077-2 - DOI - PubMed
    1. Amemiya, H.M., Kundaje A., and Boyle A.P.. 2019. The ENCODE blacklist: Identification of problematic regions of the genome. Sci. Rep. 9:9354. 10.1038/s41598-019-45839-z - DOI - PMC - PubMed
    1. Bacmeister, C.M., Barr H.J., McClain C.R., Thornton M.A., Nettles D., Welle C.G., and Hughes E.G.. 2020. Motor learning promotes remyelination via new and surviving oligodendrocytes. Nat. Neurosci. 23:819–831. 10.1038/s41593-020-0637-3 - DOI - PMC - PubMed
    1. Balasubramanyam, K., Altaf M., Varier R.A., Swaminathan V., Ravindran A., Sadhale P.P., and Kundu T.K.. 2004. Polyisoprenylated benzophenone, garcinol, a natural histone acetyltransferase inhibitor, represses chromatin transcription and alters global gene expression. J. Biol. Chem. 279:33716–33726. 10.1074/jbc.M402839200 - DOI - PubMed
    1. Bergles, D.E., Roberts J.D.B., Somogyi P., and Jahr C.E.. 2000. Glutamatergic synapses on oligodendrocyte precursor cells in the hippocampus. Nature. 405:187–191. 10.1038/35012083 - DOI - PubMed