Comparative Study
. 2025 Jan 24;192(2):269-282.
doi: 10.1093/bjd/ljae313.

Single-cell RNA sequencing comparison of CD4+, CD8+ and T-cell receptor γδ+ cutaneous T-cell lymphomas reveals subset-specific molecular phenotypes

Affiliations
Comparative Study

Single-cell RNA sequencing comparison of CD4+, CD8+ and T-cell receptor γδ+ cutaneous T-cell lymphomas reveals subset-specific molecular phenotypes

Sumanth Chennareddy et al. Br J Dermatol. .

Erratum in

Abstract

Background: Malignant clones of primary cutaneous T-cell lymphomas (CTCL) can show a CD4+, CD8+ or T-cell receptor (TCR)-γδ+ phenotype, but their individual impact on tumour biology and skin lesion formation remains ill defined.

Objectives: To perform a comprehensive molecular characterization of CD4+ vs. CD8+ and TCR-γδ+ CTCL lesions.

Methods: We performed single-cell RNA sequencing (scRNAseq) of 18 CTCL skin biopsies to compare classic CD4+ advanced-stage mycosis fungoides (MF) with TCR-γ/δ+ MF and primary cutaneous CD8+ aggressive epidermotropic cytotoxic T-cell lymphoma (Berti lymphoma).

Results: Malignant clones of TCR-γ/δ+ MF and Bertilymphoma showed similar clustering patterns distinct from CD4+ MF, along with increased expression of cytotoxic markers such as NKG7, CTSW, GZMA and GZMM. Only advanced-stage CD4+ MF clones expressed central memory T-cell markers (SELL, CCR7, LEF1), alongside B1/B2 blood involvement, whereas TCR-γδ+ MF and Berti lymphoma harboured a more tissue-resident phenotype (CD69, CXCR4, NR4A1) without detectable cells in the blood. CD4+ MF and TCR-γδ+ MF skin lesions harboured strong type 2 immune activation across myeloid cells, while Berti lymphoma was more skewed toward type 1 immune responses. Both CD4+ MF and TCR-γδ+ MF lesions showed upregulation of keratinocyte hyperactivation markers such as S100A genes and KRT16. This increase was entirely absent in Berti lymphoma, possibly reflecting an aberrant keratinocyte response to invading tumour cells, which could contribute to the formation of the typical ulceronecrotic lesions within this entity.

Conclusions: Our scRNAseq profiling study reveals specific molecular patterns associated with distinct CTCL subtypes.

Plain language summary

Cutaneous T-cell lymphomas are a group of skin cancers characterized by an abnormal proliferation of a type of white blood cell called ‘T lymphocytes’. They consist of a diverse group of diseases, many of which are still poorly understood. Cancerous T lymphocytes in cutaneous lymphomas express the same T-cell receptor (TCR) sequence, hence the term ‘clones’ is often used to describe these malignant cells. Usually, these clonal T lymphocytes express an alpha/beta TCR in conjunction with protein called CD4. In rare cases, they may express an alpha/beta TCR along with a different protein called CD8, or instead display a gamma/delta TCR. To better understand these diseases, we compared three major subsets of cutaneous lymphomas (CD4+, CD8+, and TCR-gamma/delta) on a molecular level. We found specific signatures associated with each of the diseases, which may help with future strategies to better treat people with cutaneous T-cell lymphomas.


Conflict of interest statement

Conflicts of interest: W.W. has received personal fees from LEO Pharma, Pfizer, Sanofi Genzyme, Eli Lilly, Novartis, Boehringer Ingelheim, AbbVie and Janssen. J.G. has received personal fees from AbbVie, Eli Lilly, Pfizer, Boehringer Ingelheim and Novartis. C.J. has received personal fees from LEO Pharma, UCB Pharma, Pfizer, Recordati Rare Diseases, Eli Lilly, Novartis, Takeda, Kyowa Kirin, Boehringer Ingelheim, Bristol Myers Squibb, AbbVie, Janssen and Almirall. C.J. is an investigator for Eli Lilly, Novartis, Innate Pharma, AbbVie, Incyte, Boehringer Ingelheim and Almirall. P.M.B. has received personal fees from Almirall, Sanofi, Janssen, LEO Pharma, AbbVie, Pfizer, Boehringer Ingelheim, GSK, Regeneron, Eli Lilly, Celgene, Novartis, UCB, Merck, Galderma and BMS. P.M.B. is an investigator for Pfizer and Abbvie. P.M.B has also received research support from Pfizer (grant paid to his institution). The other authors declare no conflicts of interest.

Figures
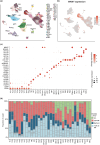
Figure 1
Figure 1
Single-cell RNA sequencing map. (a) Uniform manifold approximation and projection (UMAP) plot of unsupervised clustering of 145 817 cells integrated from CD4+ advanced-stage mycosis fungoides (MF; n = 7), T-cell receptor (TCR)-γ/δ+ MF (n = 7), Berti lymphoma (n = 4) and healthy control (HC) samples (n = 4) according to overlapping transcriptomic features, resulting in 34 distinct cell clusters. (b) Feature plot of the integrated single-cell dataset showing the proliferation marker MKI67. (c) Dot plot depicting canonical cell markers for each cluster. Dot size represents the percentage of cells expressing the marker within the respective cluster. Colour intensity represents average expression levels within clusters. (d) Bar plot representing proportions of cells per sample that contribute to each cluster in HCs (light green), and CD4+ MF (red), Berti lymphoma (Berti lym.; dark blue) and TCR-γ/δ+ MF (light blue) lymphoma subsets. The suffix ‘pro’ denotes proliferating subsets. BC, B cells; BEC, blood endothelial cells; FB, fibroblasts; KC, keratinocytes; LC, Langerhans cells; LEC, lymphatic endothelial cells; MEL, melanocytes; MP, macrophages; NK, natural killer cells; pDC, plasmacytoid dendritic cells; SG, sweat gland cells, SMC, smooth muscle cells; TC, T cells; Tpro, proliferating T cells; Treg, regulatory T cells.
Figure 2
Figure 2
Lymphocyte subpopulations paired with the T-cell receptor (TCR) clonality landscape. (a) Uniform manifold approximation and projection (UMAP) plot of the lymphoid cluster, consisting of T cells and natural killer (NK) cells, with feature plots of CD4, CD8A, FOXP3 and MKI67 gene expression. Expression levels for each cell are colour-coded by the intensity of red colouring and overlaid onto UMAP plots. (b) Dot plot showing canonical T and NK cell markers. Dot size represents the percentage of cells expressing the marker within the respective cluster. Colour intensity represents average expression levels within clusters. (c) Absolute cell counts per lymphoid cluster, depicting healthy control (HC; n = 4), CD4+ mycosis fungoides (MF; n = 7), TCR-γ/δ+ MF (n = 7) and Berti lymphoma (Berti lym.; n = 4) subsets; each dot represents a single sample. Statistical significance was calculated using a Kruskal–Wallis test for multiple comparisons with the Dunn’s post hoc test; median (interquartile range). (d) UMAP plots representing the top expanded TCR+ T-cell clone from each sample according to identical CDR3 sequences coloured in red (HC), light red (CD4+ MF), dark blue (Berti lymphoma) and light blue (TCR-γ/δ+ MF); polyclonal TCRs are depicted in green and cells without detectable TCR in grey. (e) Bar plot showing absolute cell counts per cluster and sample. (f) Dot plot showing selected subset-specific genes characteristically expressed by malignant clones of CD4+ MF, Berti lymphoma or TCR-γ/δ+ MF groups. DEG, differentially expressed gene; NK, natural killer cells; TC, T cells; Tpro, proliferating T cells; Treg, regulatory T cells.
Figure 3
Figure 3
Pseudotime trajectory analysis of malignant clones from CD4+ mycosis fungoides (MF), Berti lymphoma and T-cell receptor (TCR)-γ/δ+ MF. (a) Top expanded clones from each sample were ordered on a pseudotime plot using Monocle 2, resulting in a bifurcated trajectory; cells are coloured by pseudotime. (b) Trajectory plot with overlaid MKI67 expression; highest and lowest levels are shown in red and grey, respectively. (c) Trajectory plot coloured according to the lymphoma subset. (d) Trajectory plots split for each individual sample, coloured according to the lymphoma subset. (e) Trajectory plot coloured according to cell state calculated by Monocle 2. (f) Bar plot showing the relative distribution of top clones among cell states for each sample. (g) Dot plot of state-specific differences in normalized gene expression among the top clones of CD4+ MF, Berti lymphoma and TCR-γ/δ+ MF malignant clones. Dot size represents the percentage of cells expressing the marker within the respective cell state and colour denotes gene expression levels. DEG, differentially expressed gene.
Figure 4
Figure 4
Myeloid cell characteristics across conditions. (a) Uniform manifold approximation and projection (UMAP) plot of the myeloid cell cluster, comprised of dendritic cells (DCs), macrophages (MPs), plasmacytoid DCs (pDCs) and proliferating cells (suffix ‘pro’). (b) Dot plot showing selected canonical markers for each myeloid cluster. (c) Absolute cell counts per myeloid cluster, depicting healthy control (HC; n = 4), CD4+ MF (n = 7), Berti lymphoma (Berti lym.; n = 4) and T-cell receptor (TCR)-γ/δ+ MF (n = 7) subsets; each dot represents a single sample. Statistical significance was calculated with a Kruskal–Wallis test for multiple comparisons with Dunn’s post hoc test; median (interquartile range). (d) Feature plots depicting selected type 2-associated markers. Gene expression levels for each cell are colour-coded (red) and overlaid onto UMAP plots. (e, f) Violin plots showing normalized expression of selected genes in DC3 and MP populations, respectively.
Figure 5
Figure 5
Keratinocyte characteristics across conditions. (a) Uniform manifold approximation and projection (UMAP) plot comprising keratinocytes (KC), sweat gland cells (SG) and proliferating cells (suffix ‘pro’). (b) Dot plot representing canonical markers of each cluster. (c) Absolute cell counts per cluster, with each bar representing a different condition: healthy control (HC; n = 4); CD4+ mycosis fungoides (MF; n = 7); Berti lymphoma (Berti lym.; n = 4); and T-cell receptor (TCR)-γ/δ+ MF (n = 7). Each dot represents a single sample. Statistical significance was calculated using the Kruskal–Wallis test for multiple comparisons with Dunn’s post hoc test; median (interquartile range). (d) Dot plot showing selected subset-specific genes differentiating keratinocytes between HC, CD4+ MF, Berti lymphoma or TCR-γ/δ+ MF. (e) Gene set enrichment analysis dot plot showing top enriched terms from the Gene Ontology Biological Process (GO:BP) database when analysing all upregulated differentially expressed genes (DEGs) from comparing keratinocytes from the CD4+ MF, Berti lymphoma or TCR-γ/δ+ MF subsets with HC keratinocytes. Dot size represents the number of DEGs associated with each enriched term and GeneRatio represents the ratio between the number of DEGs associated with each significantly enriched pathway and the total number of genes included in that pathway. (f) ‘cnetplot’ of the top upregulated DEGs associated with each enriched pathway. Genes are coloured according to average log fold change.

Comment in

Similar articles

Cited by

References

    1. Hristov AC, Tejasvi T, Wilcox RA. Cutaneous T-cell lymphomas: 2023 update on diagnosis, risk-stratification, and management. Am J Hematol 2023; 98:193–209. - PMC - PubMed
    1. Glinos G, Wei G, Nosewicz J et al. Characteristics and outcomes for hospitalized patients with cutaneous T-cell lymphoma. JAMA Dermatol 2023; 159:192–7. - PMC - PubMed
    1. Latzka J, Assaf C, Bagot M et al. EORTC consensus recommendations for the treatment of mycosis fungoides/Sezary syndrome – update 2023. Eur J Cancer 2023; 195:113343. - PubMed
    1. Walia R, Yeung CCS. An update on molecular biology of cutaneous T cell lymphoma. Front Oncol 2019; 9:1558. - PMC - PubMed
    1. Pulitzer M, Geller S, Kumar E et al. T-cell receptor-delta expression and gammadelta+ T-cell infiltrates in primary cutaneous gammadelta T-cell lymphoma and other cutaneous T-cell lymphoproliferative disorders. Histopathology 2018; 73:653–62. - PMC - PubMed

Publication types

MeSH terms

Substances