. 2024 Jun 18;9(14):e179010.
doi: 10.1172/jci.insight.179010.

Expansion of the HSV-2-specific T cell repertoire in skin after immunotherapeutic HSV-2 vaccine

Affiliations

Expansion of the HSV-2-specific T cell repertoire in skin after immunotherapeutic HSV-2 vaccine

Emily S Ford et al. JCI Insight. .

Abstract

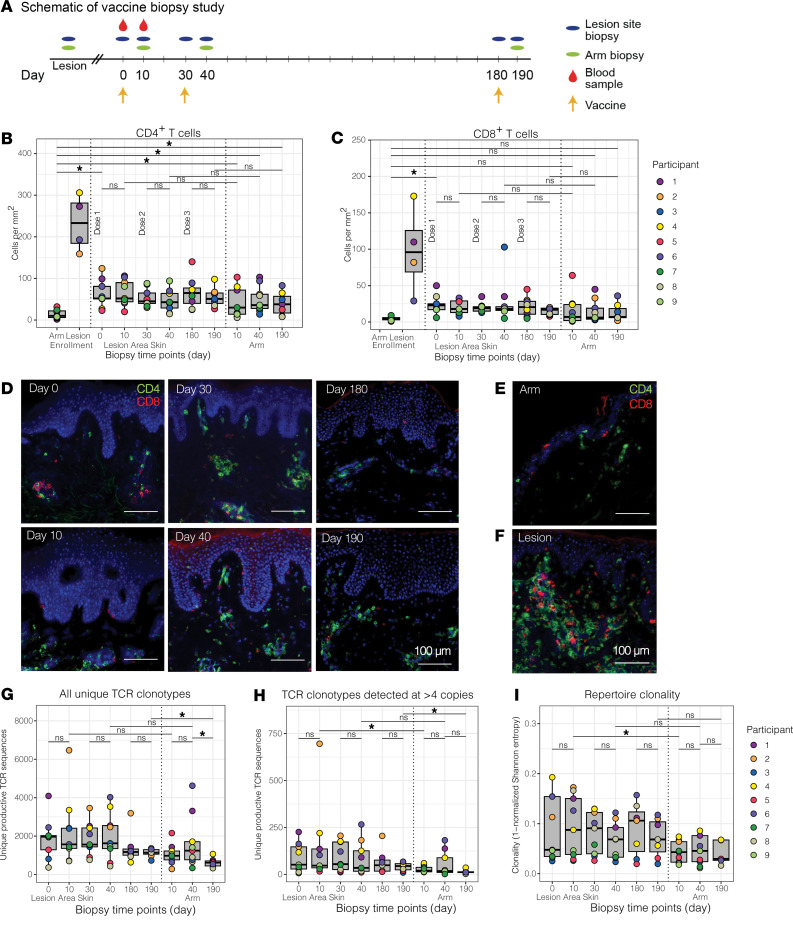
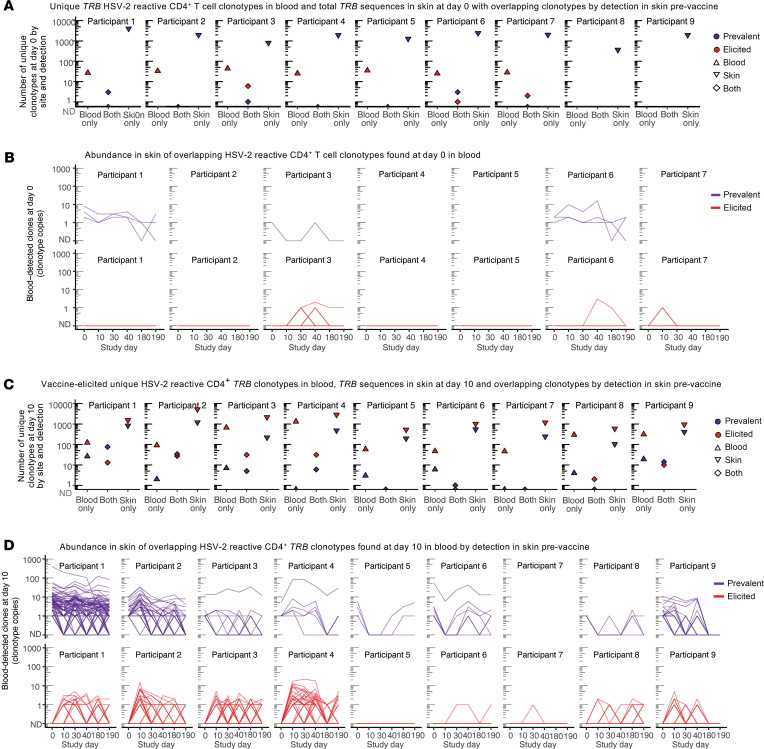
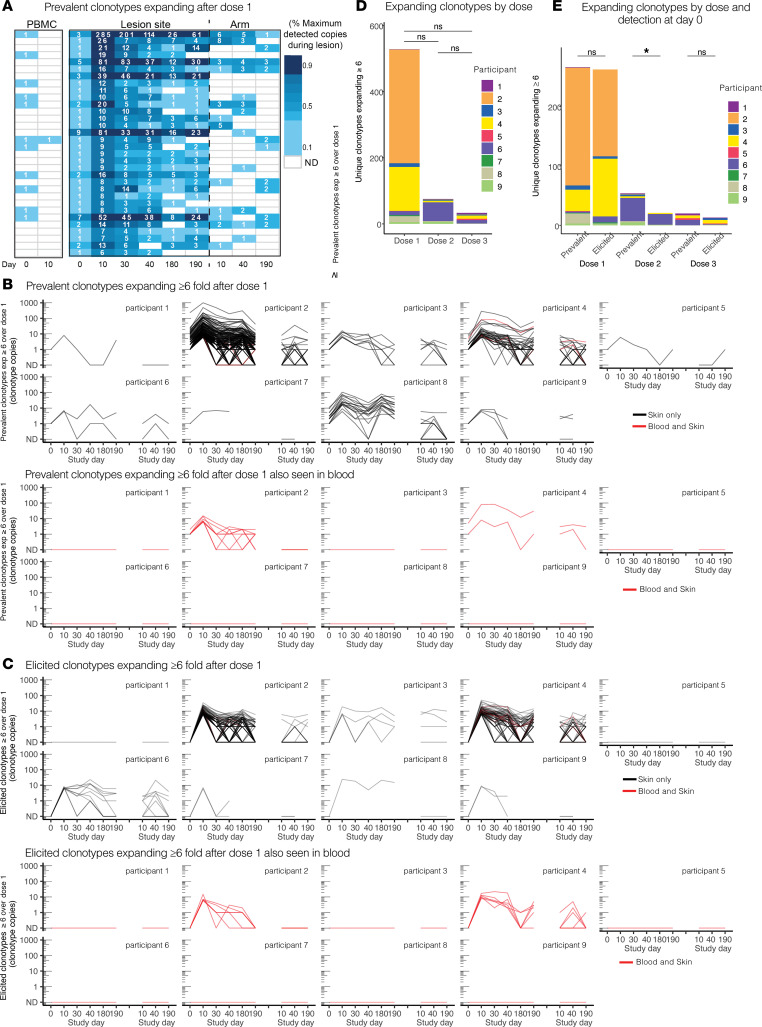
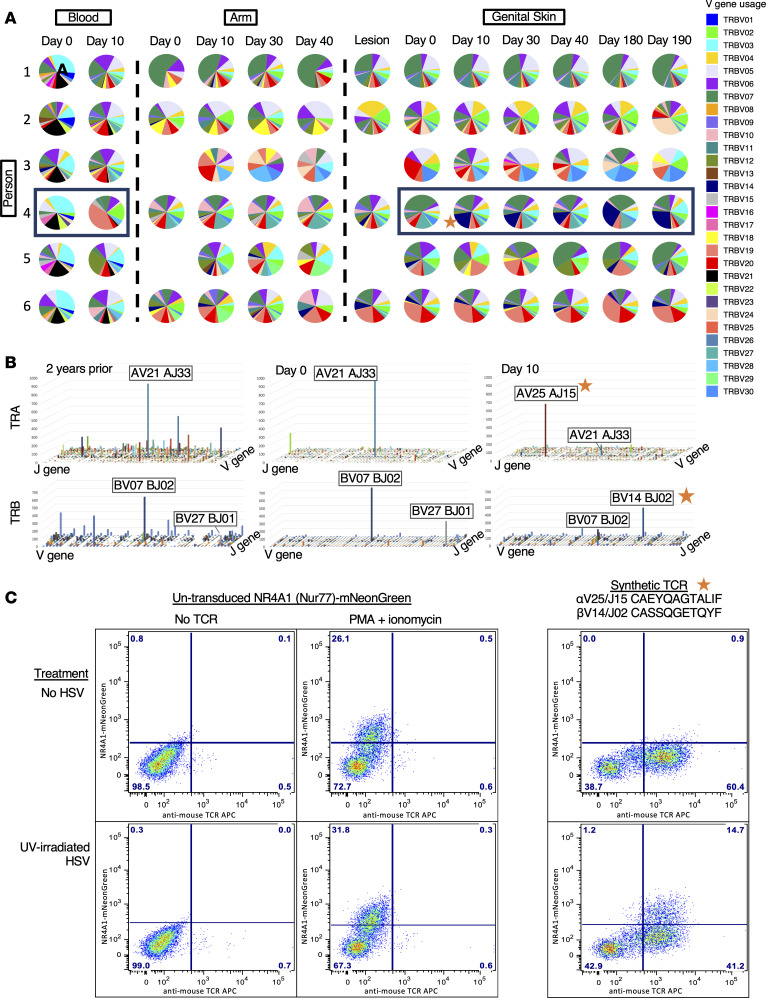
The skin at the site of HSV-2 reactivation is enriched for HSV-2-specific T cells. To evaluate whether an immunotherapeutic vaccine could elicit skin-based memory T cells, we studied skin biopsies and HSV-2-reactive CD4+ T cells from PBMCs by T cell receptor (TCR) β chain (TRB) sequencing before and after vaccination with a replication-incompetent whole-virus HSV-2 vaccine candidate (HSV529). The representation of HSV-2-reactive CD4+ TRB sequences from PBMCs in the skin TRB repertoire increased after the first vaccine dose. We found sustained expansion after vaccination of unique, skin-based T cell clonotypes that were not detected in HSV-2-reactive CD4+ T cells isolated from PBMCs. In one participant, a switch in immunodominance occurred with the emergence of a TCR αβ pair after vaccination that was not detected in blood. This TCRαβ was shown to be HSV-2 reactive by expression of a synthetic TCR in a Jurkat-based NR4A1 reporter system. The skin in areas of HSV-2 reactivation possessed an oligoclonal TRB repertoire that was distinct from the circulation. Defining the influence of therapeutic vaccination on the HSV-2-specific TRB repertoire requires tissue-based evaluation.

Keywords: Adaptive immunity; Cellular immune response; T cell receptor; Vaccines; Virology.


Conflict of interest statement

Conflict of interest: JT and SG are current employees of Sanofi. ASM is a consultant for Cero and AiCuris. CJ has received institutional research funding to the University of Washington from Sanofi, Moderna, and GSK and is a consultant to GSK, Pfizer, and Assembly Biosciences. DMK has received research funding from Sanofi, Immune Design Corporation, and Admedus Immunotherapy concerning herpes vaccines and has served as a consultant to Biomedical Research Models on herpes vaccines. KJL has received salary support from Sanofi and Admedus Immunotherapy. DMK, KJL, and LC are coinventors on patents owned by the University of Washington involving herpes vaccines (9579376, 9044447).

Figures

Figure 1
Figure 1. Number, fold change, and clonality of TCR clonotypes in HSV lesion site and arm biopsies before and after vaccination.
(A) Schematic of vaccine study timeline and procedures. (B) CD4+ and (C) CD8+ T cell densities of biopsies from control skin at the time of enrollment and from the site of a symptomatic lesion (N = 4) are shown in comparison to HSV lesion site and control skin biopsies over the course of a 3-dose vaccine trial in 9 vaccine recipients. Each dot represents the mean of 3 counted sections in a single participant. Median and interquartile range are shown in gray. (D) Representative micrographs (original magnification, ×10) of CD4+ (green) and CD8+ (red) T cell density by immunofluorescence (IF) in HSV lesion site biopsies at specified time points before and after vaccination. CD4+ and CD8+ T cell IF from (E) control skin and (F) lesion site during a symptomatic HSV-2 outbreak. All images are from P4. Scale bars: 100 mm. (G) Total and (H) number of TCRβ clonotypes detected at >4 copies are shown from the HSV lesion site and arm biopsies. (I) Clonality calculated from Shannon entropy of the TCR repertoire from each sample. Each dot represents a single participant. Median and interquartile range are shown in gray. *P < 0.05 by Wilcoxon’s signed-rank test.
Figure 2
Figure 2. Overlap of HSV-2–reactive CD4+ T cells from PBMCs in skin biopsies by clonal tracking before and after initiation of vaccination series.
(A) Unique TRB sequences detected only in blood at day 0 (“blood,” clonotypes from blood at day 0 also detected at any time in skin (“both”), and unique clonotypes in skin at day 0 (“skin”) and (B) the longitudinal detection of each of the overlapping (both) clonotypes in lesion-area skin over time, by whether they were observed before or after vaccination. Each line represents a unique clonotype. “ND” is not detected at that time point. (C) Unique TRB sequences detected in blood and skin at day 10 by detection in one or both sites and (D) the longitudinal detection of each of the overlapping clonotypes in lesion-area skin over time. Each line represents a unique clonotype. Shading of both histograms and longitudinal graphing represents whether clonotypes were observed before (purple) or only after (red) vaccination.
Figure 3
Figure 3. Prevalent and elicited clonotypes in HSV-2–enriched CD4+ T cells from PBMCs, healed lesion site, and arm biopsy expanding or detected at high copy number.
(A) Prevalent clonotypes detected in P4, by fold increase over dose 1. Each row represents a single clonotype (by nucleic acid sequence). Codetection of clonotypes in HSV-2–enriched CD4+ T cells from PBMCs, active lesion, quiescent lesion-area skin, and arm skin are compared at each of the time points. The number of copies detected in PBMCs from P4 at day 10 reflects ex vivo expansion prior to sequencing and is denoted in individual cells (see Methods). Blank boxes indicate lack of detection. (B) Prevalent and (C) elicited clonotypes either expanding ≥6-fold after dose 1 or present after dose 1 (day 10) at ≥6-fold above a single copy and their longevity in lesion-area tissue over the course of the vaccine trial (left), with the corresponding abundance in the arm control (right). ND, not detected. Highly prevalent clonotypes that expanded after the first vaccine dose are seen to persist in tissue throughout the vaccine trial. Color indicates whether the nucleotide sequences were detected in blood (black indicates a tissue-only sequence, red was also seen in blood). Prevalent expanded clonotypes are of greater abundance than elicited clonotypes. Most in-tissue expansion was not from clonotypes observed in blood. (D) Stacked bar graphs showing number of clonotypes expanding by ≥6-fold after each dose in the lesion-area skin by person. (E) Number of clonotypes expanding by ≥6-fold after each dose in the lesion-area skin by detection prior to initiation of vaccine series (prevalent) versus clonotypes only seen after initiation of vaccination (elicited). *P < 0.05 by Wilcoxon’s signed-rank test.
Figure 4
Figure 4. Evaluation of TRA/TRB V and J gene usage.
(A) V gene usage in participants 1–6 across all sites, including blood, arm, and genital skin, over time. Pie charts demonstrate the proportion of the total repertoire represented by each gene. Skin site clonotypes were limited to those that were present at greater than 4 copies; all HSV-reactive CD4+ T cells from blood are shown. (B) Combination V and J gene usage in P4 showing the shift in immunodominance from 2 years prior to vaccination through 10 days after the first vaccine dose. The z axis represents numbers of copies in each combination. The x and y axes represent V and J genes listed sequentially. The V and J genes are labeled for the most abundant combinations. (C) HSV-2 specificity of a synthetic TCR composed of the most abundant TRA and TRB sequences from the day 10 sample in P4, using a Jurkat Nur77-mNeonGreen reporter cell system (right). Negative control (no TCR, left) and positive control (PMA + ionomycin, middle) for TCR stimulation and negative treatment (no HSV, top) or experimental treatment (UV-irradiated HSV, bottom) to assess TCR specificity. The star denotes the newly immunodominant TCR stimulated by vaccine in P4 (A and B) and shown to be HSV specific (C).
Figure 5
Figure 5. Representative data from fine specificity determination of blood CD4+ T cell clones overlapping with TCRβ CDR3 sequences detected in HSV lesion site biopsies.
(A) Clonotype tracking with assigned specificity of 13 of the 16 clones queried in P4 by abundance and fold change in skin over dose 1 (day 0–10). (B) Example of fine-specificity mapping of a single clone confirmed to be specific to UL11. Both specimens were obtained from day 10 after HSV529 vaccination. At left is T cell proliferation in response to matrix pools of HSV-2 antigens with positive and negative controls. Pools containing US11 (pool 1 and pool 19) are positive. At right is confirmatory assay with recombinant UL11 and controls. Blue and orange bars represent 2 replicate assays.

Update of

Similar articles

Cited by

References

    1. Looker KJ, et al. Global estimates of prevalent and incident herpes simplex virus type 2 infections in 2012. PLoS One. 2015;10(1):e114989. doi: 10.1371/journal.pone.0114989. - DOI - PMC - PubMed
    1. Looker KJ, et al. Effect of HSV-2 infection on subsequent HIV acquisition: an updated systematic review and meta-analysis. Lancet Infect Dis. 2017;17(12):1303–1316. doi: 10.1016/S1473-3099(17)30405-X. - DOI - PMC - PubMed
    1. Looker KJ, et al. First estimates of the global and regional incidence of neonatal herpes infection. Lancet Glob Health. 2017;5(3):e300–e309. doi: 10.1016/S2214-109X(16)30362-X. - DOI - PMC - PubMed
    1. Posavad CM, et al. Severe genital herpes infections in HIV-infected individuals with impaired herpes simplex virus-specific CD8+ cytotoxic T lymphocyte responses. Proc Natl Acad Sci U S A. 1997;94(19):10289–10294. doi: 10.1073/pnas.94.19.10289. - DOI - PMC - PubMed
    1. Bernstein DI, et al. Therapeutic vaccine for genital herpes simplex virus-2 infection: findings from a randomized trial. J Infect Dis. 2017;215(6):856–864. doi: 10.1093/infdis/jix004. - DOI - PMC - PubMed

Substances