. 2024 Jun 13;9(14):e178767.
doi: 10.1172/jci.insight.178767.

Enhancing radiotherapy response via intratumoral injection of a TLR9 agonist in autochthonous murine sarcomas

Affiliations

Enhancing radiotherapy response via intratumoral injection of a TLR9 agonist in autochthonous murine sarcomas

Chang Su et al. JCI Insight. .

Abstract

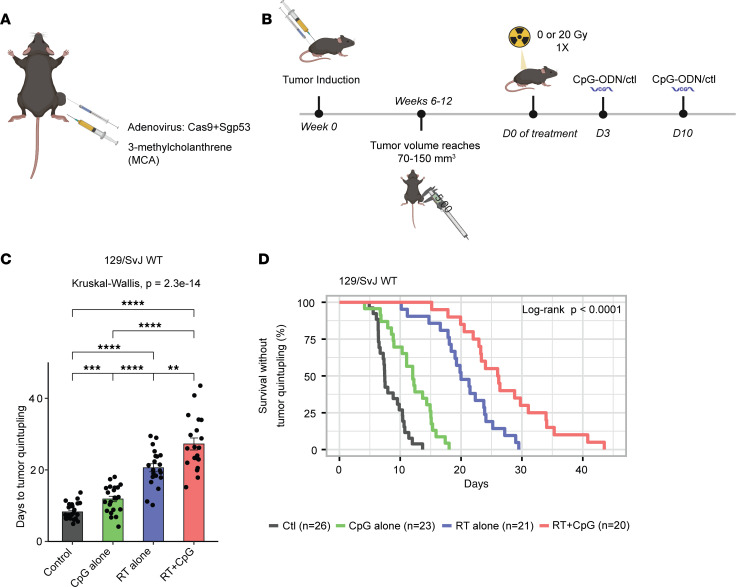
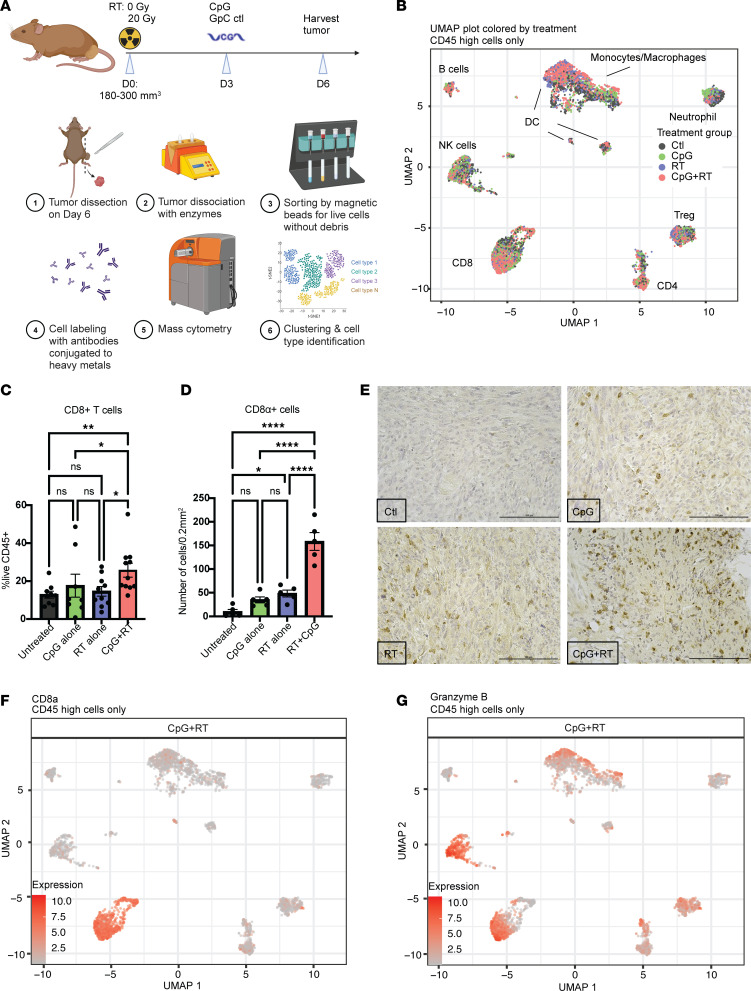
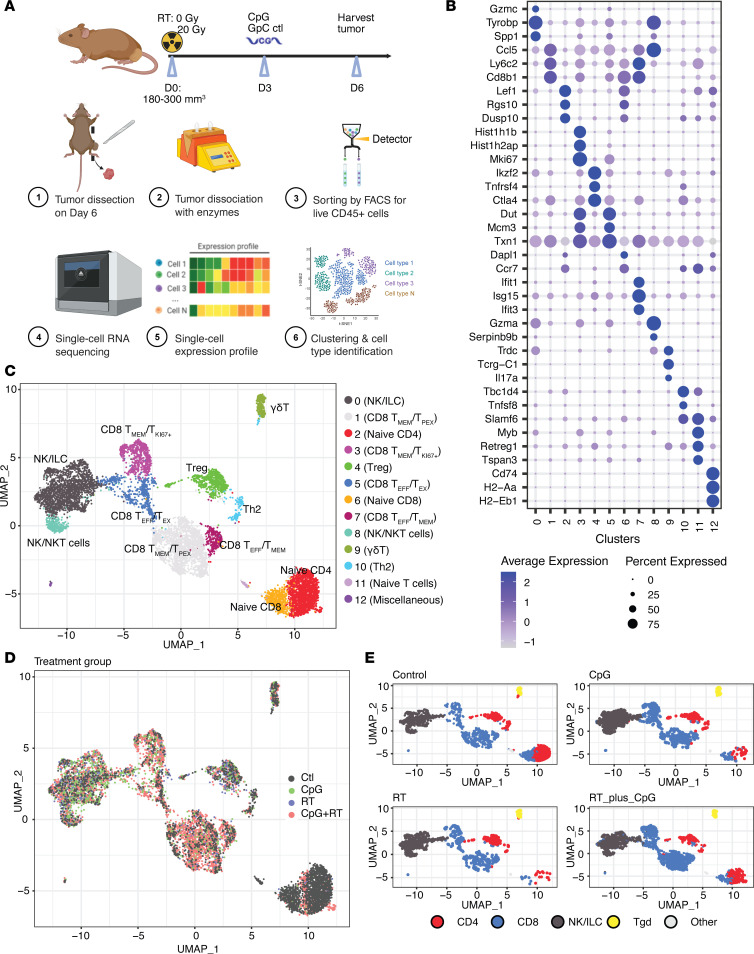
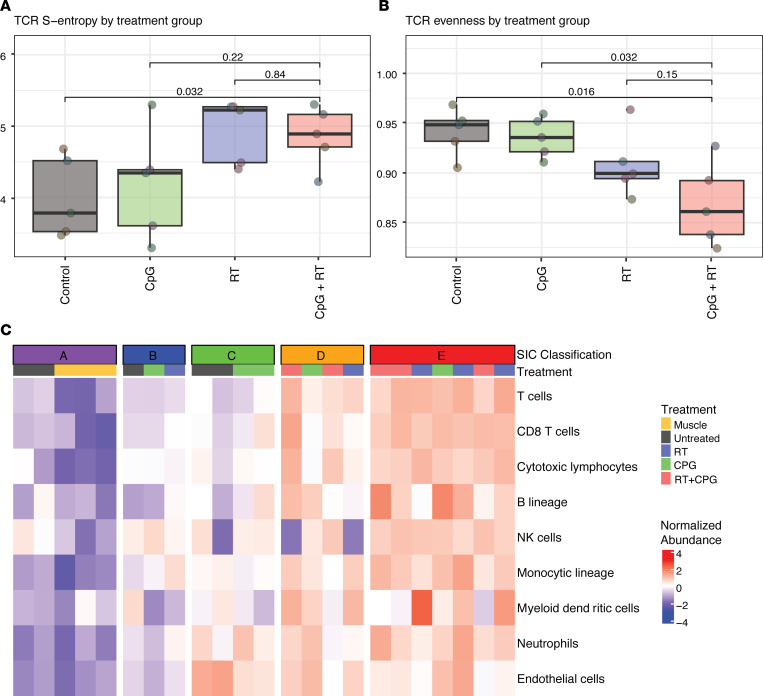
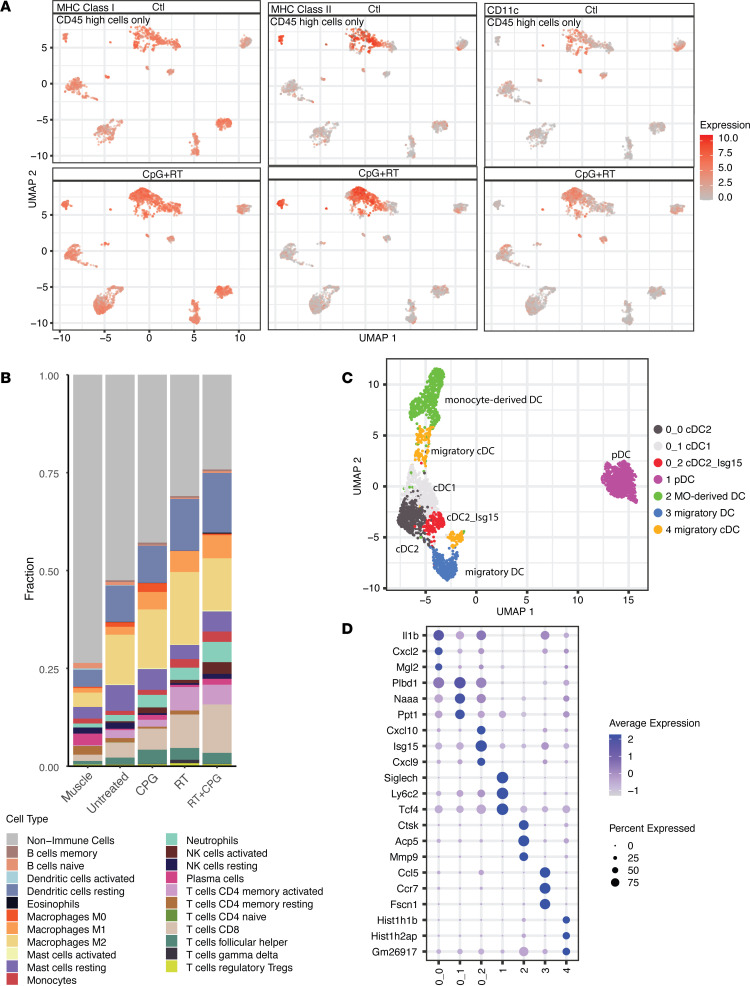
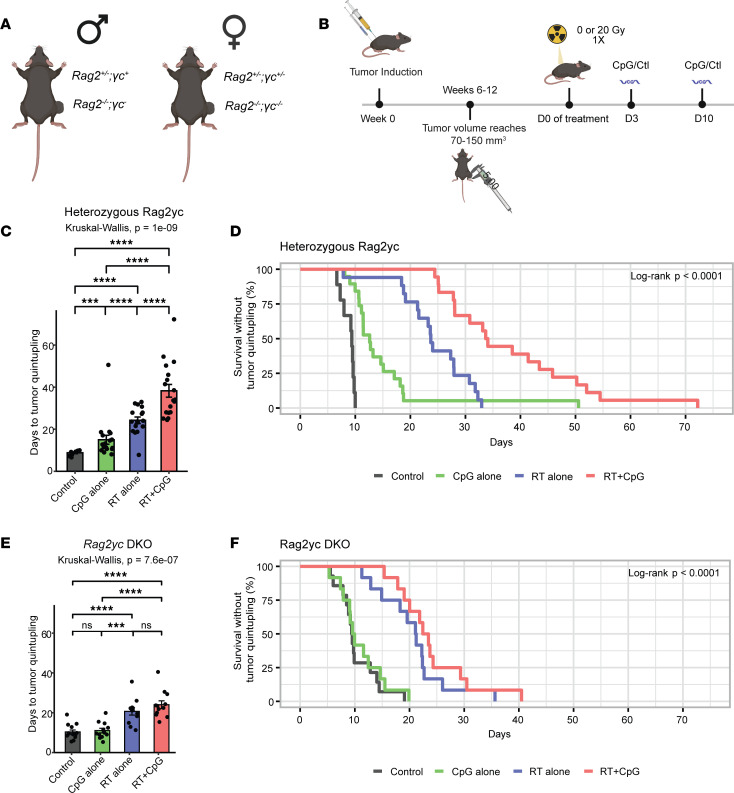
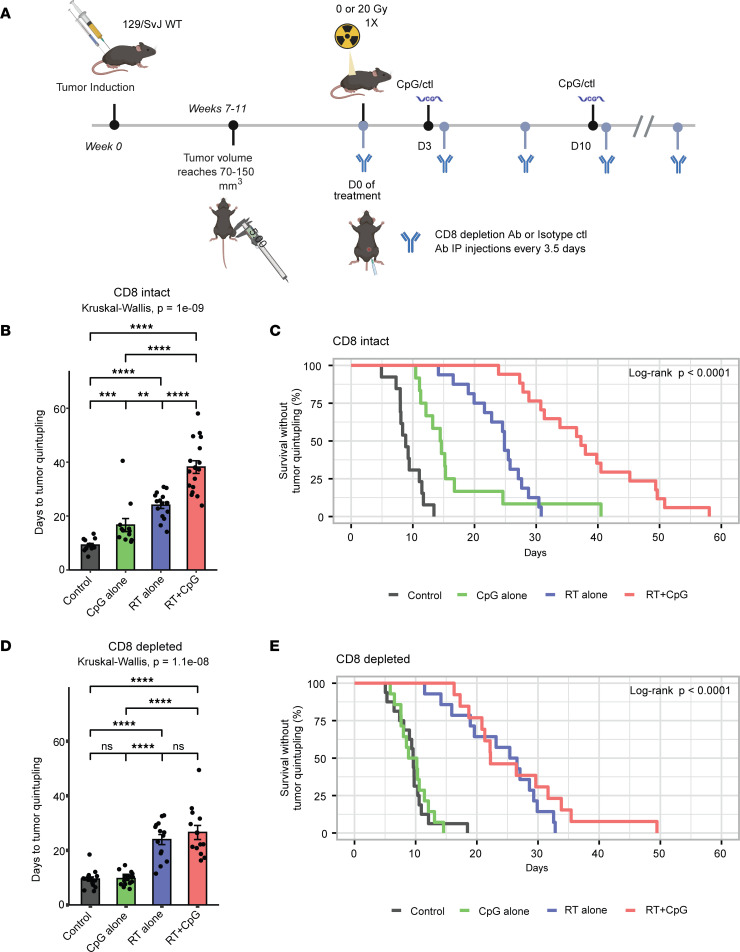
Radiation therapy (RT) is frequently used to treat cancers, including soft-tissue sarcomas. Prior studies established that the toll-like receptor 9 (TLR9) agonist cytosine-phosphate-guanine oligodeoxynucleotide (CpG) enhances the response to RT in transplanted tumors, but the mechanisms of this enhancement remain unclear. Here, we used CRISPR/Cas9 and the chemical carcinogen 3-methylcholanthrene (MCA) to generate autochthonous soft-tissue sarcomas with high tumor mutation burden. Treatment with a single fraction of 20 Gy RT and 2 doses of CpG significantly enhanced tumor response, which was abrogated by genetic or immunodepletion of CD8+ T cells. To characterize the immune response to CpG+RT, we performed bulk RNA-Seq, single-cell RNA-Seq, and mass cytometry. Sarcomas treated with 20 Gy and CpG demonstrated increased CD8 T cells expressing markers associated with activation and proliferation, such as Granzyme B, Ki-67, and IFN-γ. CpG+RT also upregulated antigen presentation pathways on myeloid cells. Furthermore, in sarcomas treated with CpG+RT, TCR clonality analysis suggests an increase in clonal T cell dominance. Collectively, these findings demonstrate that CpG+RT significantly delays tumor growth in a CD8 T cell-dependent manner. These results provide a strong rationale for clinical trials evaluating CpG or other TLR9 agonists with RT in patients with soft-tissue sarcoma.

Keywords: Cancer immunotherapy; Immunology; Oncology; Radiation therapy; T cells.


Figures

Figure 1
Figure 1. Increased tumor growth delay after treatment with CpG ODN and radiation therapy in autochthonous p53/MCA sarcomas.
(A) Primary sarcoma initiation by intramuscular injection of Adeno-Cas9-sgp53 and MCA. (B)Autochthonous sarcomas develop at the injection site about 7–11 weeks after injection. Mice were treated with CpG ODN or control GpC dinucleotides and 0 or 20 Gy when tumors reached > 70 mm3. (C) Mice with p53/MCA sarcomas received control GpC dinucleotides with 0 Gy (black, n = 26), CpG ODN alone (green, n = 23), control GpC dinucleotides with 20 Gy (blue, n = 21), or CpG ODN with 20 Gy (red, n = 20). Time to tumor quintupling (days) after the indicated treatment. (D) Mice with p53/MCA sarcomas received control GpC dinucleotides with 0 Gy (black, n = 26), CpG ODN alone (green, n = 23), control GpC dinucleotides with 20 Gy (blue, n = 21), or CpG ODN with 20 Gy (red, n = 20). Kaplan-Meier analysis with tumor quintupling as the endpoint. Kruskal-Wallis test was used for comparison across the groups, while the Wilcoxon test was selected for the pair-wise comparisons. **P ≤ 0.01, ****P ≤ 0.0001.
Figure 2
Figure 2. CyTOF and IHC staining demonstrates enhanced intratumoral infiltration of activated CD8 T cells after combination treatment.
(A) Treatment schedule and tumor processing schematic. (B) UMAP plot of CyTOF data clustering for all CD45hi cells from all tumors and treatment groups. (C) Frequency of CD8+ cells/live CD45+ cells by CyTOF. Data show mean ± SEM, analyzed by 3-way ANOVA. (D) Average number of CD8+ cells/0.2 mm2 in IHC slides.(E)Representative IHC staining with CD8 Ab. Scale bar: 100 μm. (F) CD8 expression in CyTOF CD45 high UMAP plot. (G) Granzyme B expression in CyTOF CD45hi UMAP plot. *P ≤ 0.05, **P ≤ 0.01, ****P ≤ 0.0001.
Figure 3
Figure 3. scRNA-Seq shows increased CD8 T cell infiltration into the tumor after CpG+RT.
(A) Treatment schedule and tumor processing schematic. (B) Bubble plot of top 3 differentially expressed genes in each of the T cell subclusters. The shades of color are correlated with levels of expression. The sizes of circles are correlated with percentage of cells in that cluster that express the gene of interest. (C) UMAP plot of T cell and NK cell scRNA-Seq subclustering. (D) UMAP plot of T cell and NK cell subclustering colored by treatment groups.(E) UMAP plot of lymphocytes subclustering colored by CD4 (red), CD8 (blue), NK/ILC (black), and γδT (yellow) cells. Mice with p53/MCA sarcomas received control GpC dinucleotides with 0 Gy (n = 5), CpG ODN alone (n = 5), control GpC dinucleotides with 20 Gy (n = 5), or CpG ODN with 20 Gy (n = 5).
Figure 4
Figure 4. Treatment with CpG+RT promotes tumor-antigen–specific clonal expansion of T cells and tumor immune microenvironment remodeling.
(A) p53/MCA sarcoma develops at the injection site about 7–11 weeks after induction. Mice were treated with CpG ODN or GpC dinulcotides control and 0 or 20 Gy when tumors reached > 180 mm3. Sarcomas received control GpC dinucleotides with 0 Gy (n = 5), CpG ODN alone (n = 5), control GpC dinucleotides with 20 Gy (n = 5), or CpG ODN with 20 Gy (n = 5). Shannon entropy calculated from the abundance of TCR sequences captured by TCR sequencing and stratified by treatment group. Increasing entropy indicates reduced uniformity of TCR sequences. P values were calculated using 2-sided Wilcoxon tests. (B) TCR evenness is Shannon entropy normalized by species richness. (C) Immune-based classification of murine primary sarcomas. Sample sizes: muscle control (n = 3), tumor control (n = 5), CpG (n = 5), RT (n = 5), CpG+RT (n = 5).
Figure 5
Figure 5. Treatment with CpG+RT promotes intratumoral myeloid cell remodeling.
(A) UMAP plot of CyTOF clustering for CD45hi cells from control (GpC dinucleotides) and CpG+RT treatment groups. MHC-I, MHC-II, and CD11c expression are highlighted in red. (B) Immune cell composition of all treatment groups from Bulk RNA-Seq. (C) UMAP plot of DC subclustering. (D) Bubble plot of top 3 differentially expressed genes in each of the DC subclusters. The shades of color are correlated with levels of expression. The sizes of circles are correlated with percentage of cells in that cluster that express the gene of interest. Sample sizes: tumor control (n = 5), CpG (n = 5), RT (n = 5), CpG+RT (n = 5).
Figure 6
Figure 6. Lymphocytes mediate the antitumor effects of the combination treatment CpG+RT.
(A) Primary sarcoma initiation by intramuscular injection of Adeno-Cas9-sgp53 and MCA. (B) Autochthonous sarcoma develops at the injection site about 7–11 weeks after induction. Mice were treated with CpG ODN or control GpC dinucleotides and 0 or 20 Gy when tumors reached > 70 mm3. (C) Heterozygous mice (Rag2+/–;yc+ or Rag2+/–;yc+/–) with p53/MCA sarcomas received control GpC dinucleotides with 0 Gy (black, n = 9), CpG ODN alone (green, n = 17), control GpC dinucleotides with 20 Gy (blue, n = 17), or CpG ODN with 20 Gy (red, n = 18). Figure shows time to tumor quintupling (days). (D) Heterozygous mice (Rag2+/–;yc+ or Rag2+/–;yc+/–) with p53/MCA sarcomas received control GpC dinucleotides with 0 Gy (black, n = 9), CpG ODN alone (green, n = 17), control GpC dinucleotides with 20 Gy (blue, n = 17), or CpG ODN with 20 Gy (red, n = 18). Figure shows time to tumor quintupling (days). (E) Homozygous mice (Rag2–/–;yc or Rag2–/–;yc–/–) with p53/MCA sarcomas received GpC dinucleotides control with 0 Gy (black, n = 14), CpG ODN alone (green, n = 12), GpC dinucleotides control with 20 Gy (blue, n = 12), or CpG ODN with 20 Gy (red, n = 12). Figure shows time to tumor quintupling (days). (F) Homozygous mice (Rag2–/–;yc or Rag2–/–;yc–/–) with p53/MCA sarcomas received GpC dinucleotides control with 0 Gy (black, n = 14), CpG ODN alone (green, n = 12), GpC dinucleotides control with 20 Gy (blue, n = 12), or CpG ODN with 20 Gy (red, n = 12). Figure shows time to tumor quintupling (days). Kruskal-Wallis test was used for the group comparison, while the Wilcoxon test was selected for the pair-wise comparisons. ***P ≤ 0.001, ****P ≤ 0.0001.
Figure 7
Figure 7. CD8 T cells are required for the treatment effects of CpG+RT.
(A) Primary sarcoma initiation by intramuscular injection of Adeno-Cas9-sgp53 and MCA. Autochthonous sarcoma develops at the injection site about 7–11 weeks after induction. Mice were treated with CpG ODN or control GpC dinucleotides and 0 or 20 Gy when tumors reached > 70 mm3. Mice received i.p. CD8 isotype control or CD8 depletion Ab on the same day tumors received RT. CD8 isotype control or CD8 depletion Ab are repeated every 3.5 days until tumor size reached humane endpoint. (B) 129/SvJ mice with p53/MCA sarcomas, injected with CD8 isotype control Ab, received GpC dinucleotides control with 0 Gy (black, n = 13), CpG ODN alone (green, n = 12), GpC dinucleotides control with 20 Gy (blue, n = 15), or CpG ODN with 20 Gy (red, n = 14). (C) 129/SvJ mice with p53/MCA sarcomas, injected with CD8 isotype control Ab, received GpC dinucleotides control with 0 Gy (black, n = 13), CpG ODN alone (green, n = 12), GpC dinucleotides control with 20 Gy (blue, n = 15), or CpG ODN with 20 Gy (red, n = 14). (D) 129/SvJ mice with p53/MCA sarcomas, injected with CD8 depleting Ab, received GpC dinucleotides control with 0 Gy (black, n = 16), CpG ODN alone (green, n = 14), GpC dinucleotides control with 20 Gy (blue, n = 13), or CpG ODN with 20 Gy (red, n = 11). (E) 129/SvJ mice with p53/MCA sarcomas, injected with CD8 depletion Ab, received GpC dinucleotides control with 0 Gy (black, n = 16), CpG ODN alone (green, n = 14), GpC dinucleotides control with 20 Gy (blue, n = 13), or CpG ODN with 20 Gy (red, n = 11). Figure shows time to tumor quintupling (days). Kruskal-Wallis test was used for the group comparison, while the Wilcoxon test was selected for the pair-wise comparisons. **P ≤ 0.01, ***P ≤ 0.001, ****P ≤ 0.0001.

Update of

Similar articles

References

    1. Ayodele O, Razak ARA. Immunotherapy in soft-tissue sarcoma. Curr Oncol. 2020;27(suppl 1):17–23. doi: 10.3747/co.27.5407. - DOI - PMC - PubMed
    1. Karavasilis V, et al. Significant clinical benefit of first-line palliative chemotherapy in advanced soft-tissue sarcoma: retrospective analysis and identification of prognostic factors in 488 patients. Cancer. 2008;112(7):1585–1591. doi: 10.1002/cncr.23332. - DOI - PubMed
    1. Ribas A, Wolchok JD. Cancer immunotherapy using checkpoint blockade. Science. 2018;359(6382):1350–1355. doi: 10.1126/science.aar4060. - DOI - PMC - PubMed
    1. Tawbi HA, et al. Pembrolizumab in advanced soft-tissue sarcoma and bone sarcoma (SARC028): a multicentre, two-cohort, single-arm, open-label, phase 2 trial. Lancet Oncol. 2017;18(11):1493–1501. doi: 10.1016/S1470-2045(17)30624-1. - DOI - PMC - PubMed
    1. Demetri GD, et al. Soft tissue sarcoma clinical practice guidelines in oncology. J Natl Compr Canc Netw. 2005;3(2):158–194. - PMC - PubMed

MeSH terms