. 2024 Jul 22;9(14):e169647.
doi: 10.1172/jci.insight.169647.

Preclinical spheroid models identify BMX as a therapeutic target for metastatic MYCN nonamplified neuroblastoma

Affiliations

Preclinical spheroid models identify BMX as a therapeutic target for metastatic MYCN nonamplified neuroblastoma

Santhoshkumar Sundaramoorthy et al. JCI Insight. .

Abstract

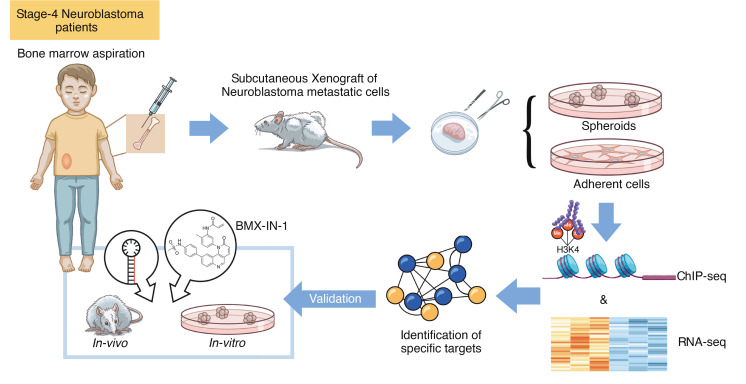
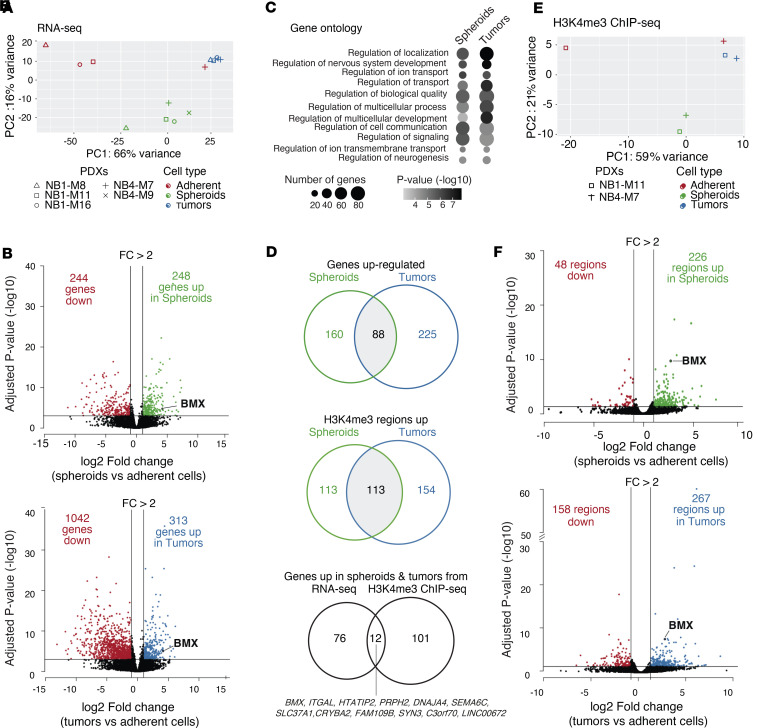
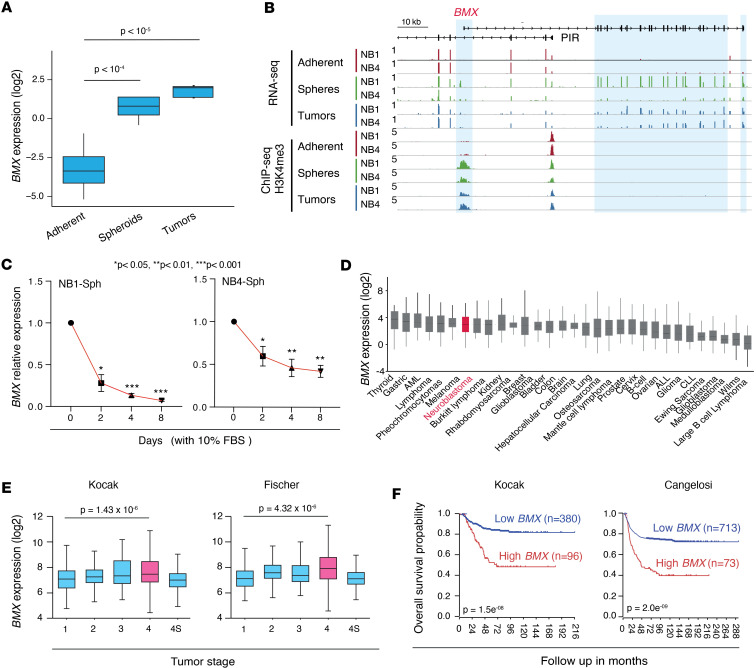
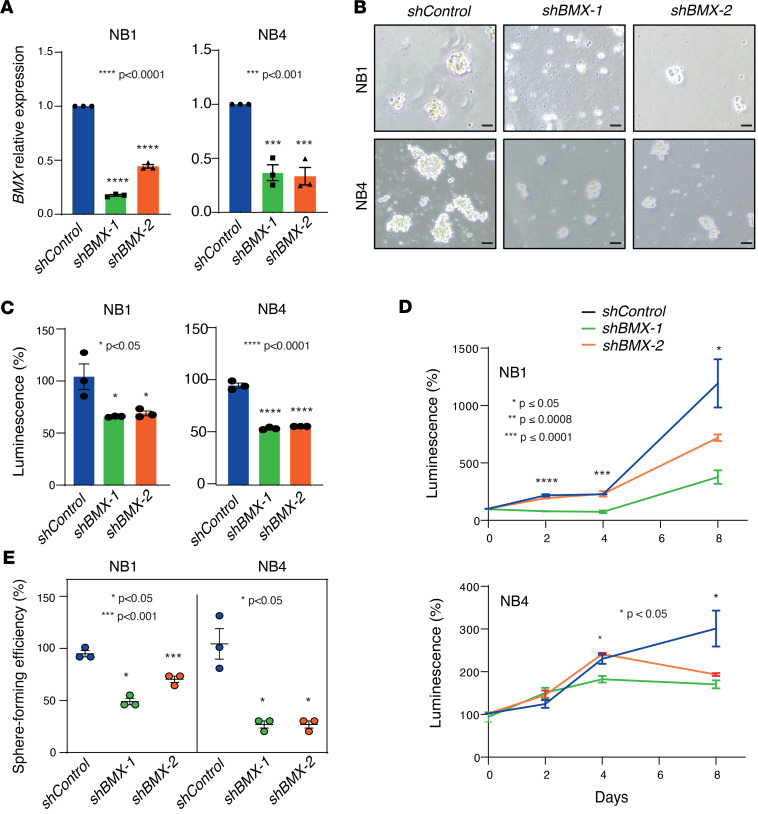
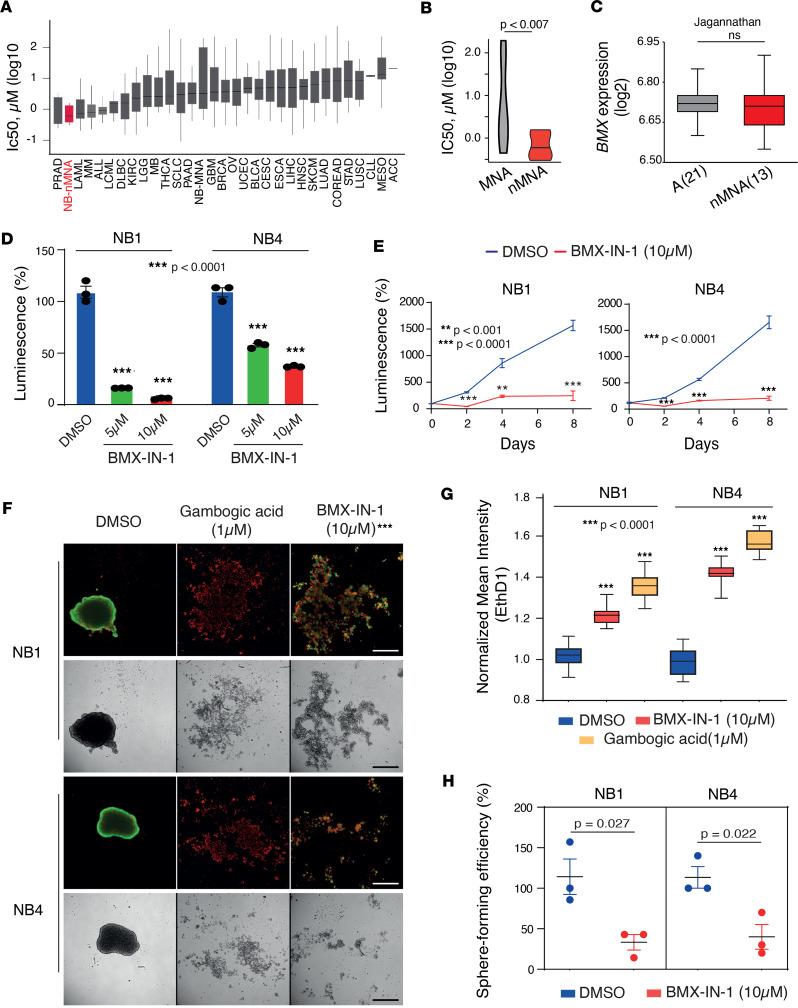
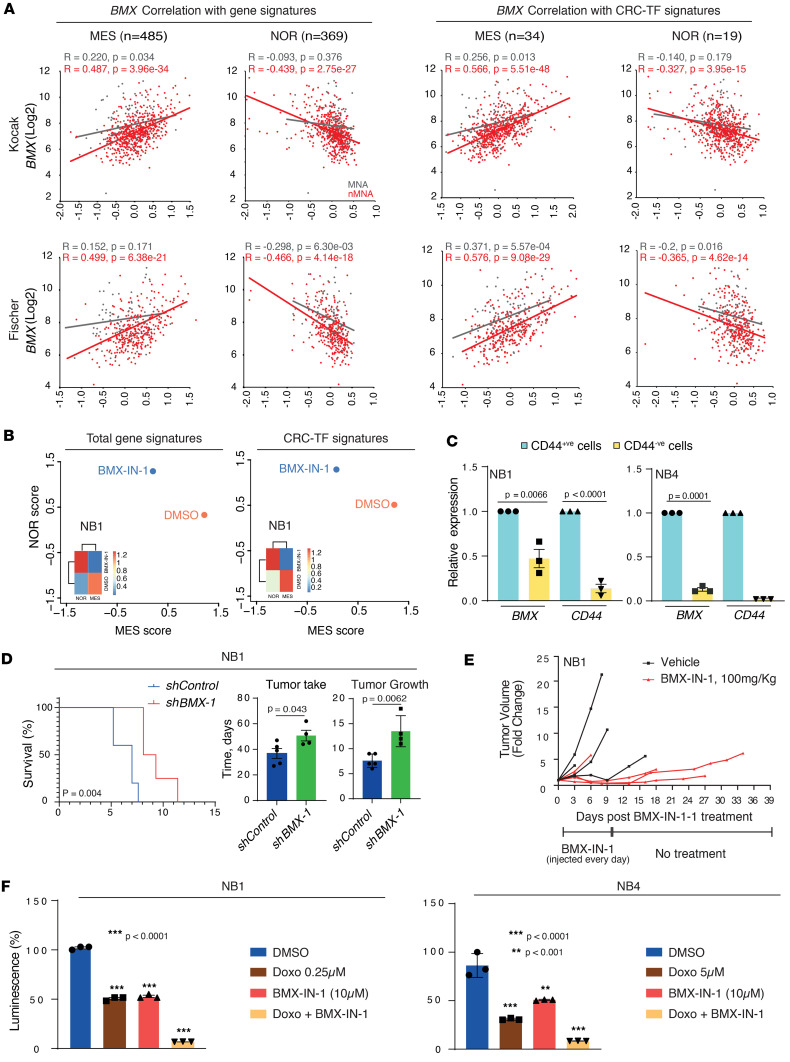
The development of targeted therapies offers new hope for patients affected by incurable cancer. However, multiple challenges persist, notably in controlling tumor cell plasticity in patients with refractory and metastatic illness. Neuroblastoma (NB) is an aggressive pediatric malignancy originating from defective differentiation of neural crest-derived progenitors with oncogenic activity due to genetic and epigenetic alterations and remains a clinical challenge for high-risk patients. To identify critical genes driving NB aggressiveness, we performed combined chromatin and transcriptome analyses on matched patient-derived xenografts (PDXs), spheroids, and differentiated adherent cultures derived from metastatic MYCN nonamplified tumors. Bone marrow kinase on chromosome X (BMX) was identified among the most differentially regulated genes in PDXs and spheroids versus adherent models. BMX expression correlated with high tumor stage and poor patient survival and was crucial to the maintenance of the self-renewal and tumorigenic potential of NB spheroids. Moreover, BMX expression positively correlated with the mesenchymal NB cell phenotype, previously associated with increased chemoresistance. Finally, BMX inhibitors readily reversed this cellular state, increased the sensitivity of NB spheroids toward chemotherapy, and partially reduced tumor growth in a preclinical NB model. Altogether, our study identifies BMX as a promising innovative therapeutic target for patients with high-risk MYCN nonamplified NB.

Keywords: Cancer; Epigenetics; Oncogenes; Therapeutics.


Figures

Figure 1
Figure 1. Schematic diagram depicting the establishment and profiling of preclinical NB models.
Metastatic NB cells were collected from bone marrow aspirates of patients with stage 4 HR-NB and were maintained in vivo by serial s.c. transplantations into Swiss nude mice. Tumor xenografts were resected when reaching the authorized volume, and single-cell suspension were prepared to generate matched spheroid and adherent cell culture models. Both cellular models and their xenografts of origin were profiled by RNA-Seq and ChIP-Seq, and genes found to be preferentially induced in xenografts and spheroids were selected for further functional validation in vitro and in vivo.
Figure 2
Figure 2. Matched transcriptional and chromatin H3K4me3 profiling of primary nMNA NB models identifies BMX as a marker of tumor xenografts and spheroids.
(A) Principal component analysis (PCA) of RNA-Seq data showing clustering of the samples according to cell types (adherent, spheroids or tumors). (B) Volcano plots showing differentially expressed genes in spheroids vs. adherent samples (top) or tumor vs. adherent samples (bottom). Genes considered as significantly upregulated or downregulated (DEseq2 fold change > 2 and adjusted P < 0.001) are highlighted in green (top) or blue (bottom) and red, respectively. (C) Bubble plot representing the enrichment of gene ontology biological processes in genes significantly enriched in spheroids vs. adherent samples (left) or tumors vs. adherent samples (right) and their associated hypergeometric P value. (D) Venn diagrams showing the overlap (gray) of genes upregulated in spheroids vs. adherent samples (left; green) or tumors vs. adherent samples (right; blue). (E) Principal component analysis (PCA) of the H3K4me3 ChIP-Seq data showing clustering of the samples according to cell type (adherent, spheroids, or tumors). (F) Volcano plots showing differentially enriched H3K4me3 regions in spheroids vs. adherent samples (top) or tumors vs. adherent samples (bottom). TSS regions significantly upregulated or downregulated (DEseq2 fold change > 2 and adjusted P < 0.05) are highlighted in green (top) or blue (bottom) and red, respectively. (G) Venn diagram showing the overlap (gray) of H3K4me3 regions enriched in spheroids vs. adherent samples (left; green) or tumors vs. adherent samples (right; blue). (H) Venn diagram showing the overlap of genes upregulated in both spheroids and tumors (88 from overlap in D) and genes of which the TSS is closest to the H3K4me3 regions enriched in both spheroids and tumors (113 from overlap in G).
Figure 3
Figure 3. High BMX expression levels correlate with advanced stage and poor prognosis in nMNA neuroblastoma patients.
(A) Box plot showing BMX expression from the RNA-Seq data in NB adherent cells, spheroids, and tumors. Adjusted P values from the DEseq2 analysis. (B) Genome browser tracks of RNA-Seq and H3K4me3 ChIP-Seq signals for NB1-M11 and NB4-M7 models at the BMX genomic locus. Blue zones mark the TSS (left) and exons (right) of the BMX gene. (C) qPCR assessment of BMX transcripts after differentiation of NB1 (left) and NB4 (right) spheroids by serum (10% FBS) at indicated times. Relative expression as mean ± SEM values of 3 technical replicates are shown. Statistical analysis was done by unpaired t test. (D) BMX mRNA expression levels across 31 tumor types obtained from the R2 genomics platform. (E) BMX mRNA expression levels in primary NB samples included in the Kocak and Fischer NB cohorts from the R2 genomics platform. Patient samples were grouped based on International Neuroblastoma Staging System (INSS) stages 1 to 4s, and Welch P value is shown. (F) Kaplan-Meier survival curves of patients with NB included in the Kocak and Cangelosi data sets from the R2 genomics platform stratified by BMX expression levels. Statistical analyses were performed using the log-rank test. Data shown in DF are from publicly available patient cohorts (R2: visualization platform). *P < 0.05, **P < 0.01, ***P < 0.001.
Figure 4
Figure 4. BMX expression is critical for NB spheroid clonogenicity and self-renewal.
(A) qPCR showing relative BMX mRNA expression levels in NB1 (left) and NB4 (right) spheroids infected with lentivirus-carrying BMX-targeting shRNAs sequences (shBMX#1 and shBMX#2) compared with control spheroids transduced with a GFP-targeting shRNA (shControl). (B) Micrographs illustrating the changes in NB1 and NB4 spheroids morphology at day 4 after transduction with either shControl, shBMX#1, or shBMX#2 lentiviruses. Representative images are shown. Scale bars: 100 μm. Magnification, 10×. (C) Graph showing the viability of the same NB1 and NB4 spheroid models as in B, measured using the CellTiter-Glo Luminescent Cell Viability Assay kit. (D) Time-dependent analysis of spheroids viability measured as in C. (E) Graph depicting the changes in sphere forming ability of NB1 and NB4 FACS-sorted single cells transduced with either shControl, shBMX#1, or shBMX#2 lentiviruses. (A and CE) Individual values and mean ± SEM values of 3 technical replicates are shown. (A, C, and E) Statistical analyses are performed using the 1-way ANOVA followed by post hoc pairwise comparisons to compute adjusted P values. (D) One-way ANOVA was used. *P ≤ 0.05, ***P < 0.001, ****P < 0.0001.
Figure 5
Figure 5. nMNA NB cell lines and primary spheroids are highly sensitive to BMX pharmacological inhibition.
(A) Box plots depicting the sensitivity toward the BMX inhibitor QL-XII-47 for cancer cell lines across 31 different tumor types. Data were obtained from the Genomics of Drug Sensitivity in Cancer (GDSC) screening program and are presented as IC50 (μM). (B) Violin plots illustrating the differential sensitivity of NB cell lines toward the BMX inhibitor QL-XII-47 based on their MYCN amplification status. Data were obtained and presented as in A. (C) Box plots showing BMX mRNA expression levels for a panel of NB cell lines segregated based on their MYCN amplification status. The expression values of BMX were extracted from the Jagannathan data set available at R2 genomics platform. (D) Bar plots showing the viability of NB1 and NB4 spheroids treated with vehicle (DMSO) or BMX-IN-1 at 5 μM and 10 μM for 4 days. (E) Time-dependent analysis of spheroid viability as in D. (F) Representative images of NB1 (upper rows) and NB4 (lower rows) spheroids treated with DMSO as control, Gambogic acid (1 μM), and BMX-IN-1 (10 μM) for 7 days. Live cells were stained in green using Calcein AM, and dead cells in red using Ethidium homodimer-1. Objective, 4×/0.2. The entire well area was captured with 4 fields of view, and the representative images shown are cropped on the location of spheres in the wells. Scale bar: 1,000 μm. (G) Box plots showing the quantification of the assay shown in F, using normalized mean intensity of mean Ethidium homodimer-1 staining of spheroids treated with BMX-IN-1 (10 μM), DMSO, and Gambogic acid (1 μM). (H) Graph depicting the changes in sphere forming ability of NB1 and NB4 single cells sorted by FACS treated with 10 μM of BMX-IN-1 or vehicle (DMSO). (DF, and H) Mean ± SEM values of 3 technical replicates are shown. Statistical analyses are performed using the unpaired t test (E, F, and H) and 1-way ANOVA followed by post hoc pairwise comparisons (D and G) to compute adjusted P values. **P < 0.001, ***P < 0.0001.
Figure 6
Figure 6. BMX depletion and pharmacological inhibition revert the MES phenotype and decrease the tumorigenic potential of NB spheroids.(A)
Scattered plots showing the correlation between BMX expression and the total MES (n = 485) or NOR (n = 369) gene signature (left panels) or the CRC-TFs of the MES (n = 34) or NOR (n = 19) cellular states (right panels) in primary tumors from the Kocak and Fischer cohorts (R2 genomics platform). (B) Scattered plot and heatmap showing the changes in cell phenotype upon 3 days of BMX-IN-1 (10 μM) treatment for NB1 spheroids versus DMSO. Scores calculated using the total (left panel) or the restricted CRC-TFs (right panel) MES and NOR gene signatures used in A. (C) Bar graphs illustrating BMX and CD44 mRNA expression levels in CD44+ and CD44 NB1 (left) and NB4 (right) populations sorted by FACS. Relative mean expression ± SEM values of 3 technical replicates are shown (unpaired t test). (D) Kaplan-Meier curves showing improved survival for mice injected with BMX-depleted NB1 spheroids (shBMX#1; n = 4), relative to BMX-proficient NB1 spheroids (shControl; n = 5) (left panel, Log-rank test). Bar graphs depicting the time required for tumor establishment (middle panel, number of days to reach approximately 500 mm3) and tumor growth (right panel, number of days required to reach the maximal volume from approximately 500 mm3) (unpaired t test). (E) Graph showing the changes in tumor volume for each individual mouse with NB1-derived xenografts treated daily i.p. with either BMX-IN-1 (100 mg/kg, n = 4, red lines) or an identical volume of vehicle (n = 4, black lines) for 10 days (D0 to D9), and then allowed to grow without treatment until reaching the maximal volume authorized. (F) Bar graph showing changes in spheroids viability upon treatment with Doxorubicin alone, BMX-IN-1 alone, or both agents in combination for 1 day or 3 days for the NB1 or NB4 model, respectively. Mean ± SEM values of 3 technical experiments are shown. One-way ANOVA followed by post hoc pairwise comparisons was performed to compute adjusted P values. **P < 0.001, ***P < 0.0001.

Similar articles

References

    1. Roy N, Hebrok M. Regulation of cellular identity in cancer. Dev Cell. 2015;35(6):674–684. doi: 10.1016/j.devcel.2015.12.001. - DOI - PMC - PubMed
    1. Michor F, Polyak K. The origins and implications of intratumor heterogeneity. Cancer Prev Res (Phila) 2010;3(11):1361–1364. doi: 10.1158/1940-6207.CAPR-10-0234. - DOI - PMC - PubMed
    1. Qureshi-Baig K, et al. Tumor-initiating cells: a criTICal review of isolation approaches and new challenges in targeting strategies. Mol Cancer. 2017;16(1):40. doi: 10.1186/s12943-017-0602-2. - DOI - PMC - PubMed
    1. Meacham CE, Morrison SJ. Tumour heterogeneity and cancer cell plasticity. Nature. 2013;501(7467):328–337. doi: 10.1038/nature12624. - DOI - PMC - PubMed
    1. Grobner SN, et al. The landscape of genomic alterations across childhood cancers. Nature. 2018;555(7696):321–327. doi: 10.1038/nature25480. - DOI - PubMed

MeSH terms