. 2024 Aug 12;19(8):e0308676.
doi: 10.1371/journal.pone.0308676. eCollection 2024.

A pilot study on bio-banding in male youth ice hockey: Players' perceptions and coaches' selection preferences

Affiliations

A pilot study on bio-banding in male youth ice hockey: Players' perceptions and coaches' selection preferences

Oliver Lindholm et al. PLoS One. .

Abstract

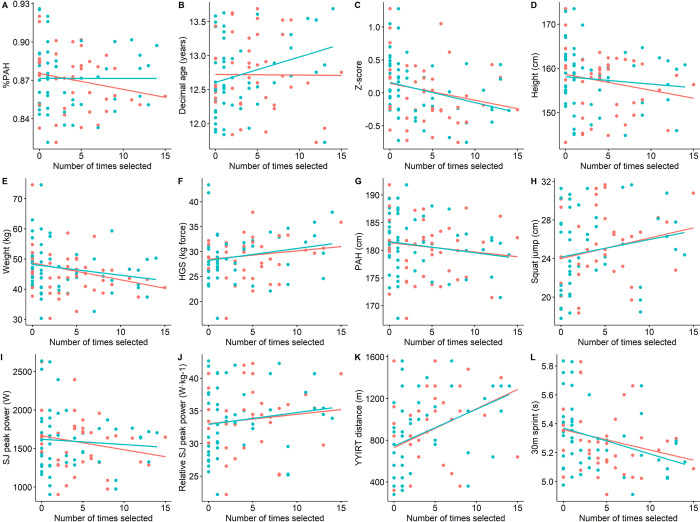
Classifying athletes based on estimates of biological maturation (i.e., bio-banding) as a supplement to traditional age grouping has been shown to be a potential tool for enriching player development in team sports; however, bio-banding has not yet been evaluated in ice hockey. The primary aim was to investigate player experiences and coaches' selection preferences in bio-banding versus age-banding in a group of 12-13-year-old (early growth spurt) male elite players (n = 69). We also examined the relationship between somatic maturity, expressed as a % predicted adult height (%PAH), and fitness performance. Bio-banding was assessed using a questionnaire and 29 coaches selected their top players in each game based on age or bio-bands. %PAH correlated with grip strength (r = .57, p>0.001) and jumping power (r = .63, p<0.001), but not with vertical jump height, sprint time or endurance. Players who played against more mature players in bio-bands than in age groups experienced higher demands, while players who played against less mature players were able to utilize their skills to a greater extent. Coaches generally favored later-than-average maturing players who performed better on performance tests and chronologically older players in bio-banding. We conclude that bio-banding in youth ice hockey has some promising effects and warrants further evaluation.


Conflict of interest statement

TRL has received financial compensation from the Swedish Ice Hockey Association for consultancy work. JL is employed by the Swedish Ice Hockey Association. EN has received reimbursement of travel expenses from the Swedish Ice Hockey Association. The specific roles of these authors are articulated in the ‘author contributions’ section. The Swedish Ice Hockey Association did not have any additional role in the study design, data collection and analysis, decision to publish, or preparation of the manuscript. This does not alter our adherence to PLOS ONE policies on sharing data and materials (see data availability statement).

Figures

Fig 1
Fig 1. Maturity status in age bands.
Symbol color: orange = BBL, blue = BBH. Zones for maturity status are indicated in different colors: yellow = pre-PHV, red = circa-PHV, green = post-PHV. The horizontal black line is the mean for respective age band and vertical black line is 95% CI. Dotted horizontal line is the grand mean of all players. %PAH = percentage of predicted adult height. U13 = Under 13 years, U14 = Under 14 years. ****: p ≤ 0.0001.
Fig 2
Fig 2. Pearsons’ correlation between physical performance tests and maturity status and chronological age.
%PAH: percentage of predicted adult height. HGS: Hand grips strength (kilogram force), SJ: Squat jump, YYIRT: YoYo Intermittent Recovery Test level 1.
Fig 3
Fig 3. Anthropometrics and physical performance in games.
BBL and BBH are bio-banded games (BBL = 82.2%–87.4% PAH, BBH = 87.5%–93.4% PAH), U13 and U14 are age-banded games (U13 = 11.7–12.7 years old, U14 = 12.8–13.7 years old). Black symbols mark the mean value. Black vertical lines: ranges within games. SJ = Squat Jump, HGS = Hand grip strength, YYIRT = Yoyo intermittent recovery test level 1. 30-meter sprints were performed on ice. *: p ≤ 0.05, **: p ≤ 0.01, ***: p ≤ 0.001, ****: p ≤ 0.0001.
Fig 4
Fig 4. Summary of player perception in bio-bands compared to age-bands.
Data are presented as Density plots from Likert-scale responses. Statements are shown above the respective density plot. Less mature opponents: players assigned to U14 and BBL, More mature opponents: players assigned to U13 and BBH, Mostly equally mature opponents: players assigned to U13 and BBL or U14 and BBH. Vertical line: mean for each group.
Fig 5
Fig 5. Coaches’ player selection in BB and AB.
%PAH: percentage of predicted adult height, PAH: predicted adult height, SJ: squat jump, YYIRT: YoYo Intermittent Recovery Test level 1. Each point is one coach’s mean value of selected players. Horizontal red line: grand mean for coaches. The vertical red line indicates the 95% confidence interval of the grand mean. Black dotted horizontal line: average of all players. P-value of two-sample t-test comparing BB and AB is shown. §: p ≤ 0.05 in one sample t-test for grand mean per format vs. the average player. *: P ≤ 0.05 in two sample t-test between formats. ****: P ≤ 0.0001 in two sample t-test between formats.
Fig 6
Fig 6. Relationship between number of selections and various metrics of maturity, anthropometrics, and fitness performance.
%PAH: percentage of predicted adult height, PAH: predicted adult height, SJ: squat jump, YYIRT: YoYo Intermittent Recovery Test level 1. AB: age-bands, BB: bio-bands. See also related correlation data in S1 File.

Similar articles

Cited by

References

    1. Towlson C, Cobley S, Parkin G, Lovell R. When does the influence of maturation on anthropometric and physical fitness characteristics increase and subside? Scand J Med Sci Sports. 2018;28(8):1946–55. doi: 10.1111/sms.13198 - DOI - PubMed
    1. Malina RM, Eisenmann JC, Cumming SP, Ribeiro B, Aroso J. Maturity-associated variation in the growth and functional capacities of youth football (soccer) players 13–15 years. Eur J Appl Physiol. 2004;91(5–6):555–62. doi: 10.1007/s00421-003-0995-z - DOI - PubMed
    1. Buchheit M, Mendez-Villanueva A. Effects of age, maturity and body dimensions on match running performance in highly trained under-15 soccer players. J Sports Sci. 2014;32(13):1271–8. doi: 10.1080/02640414.2014.884721 - DOI - PubMed
    1. Malina RM. Skeletal age and age verification in youth sport. Sports Med. 2011;41(11):925–47. doi: 10.2165/11590300-000000000-00000 - DOI - PubMed
    1. Hill M, Scott S, Malina RM, McGee D, Cumming SP. Relative age and maturation selection biases in academy football. J Sports Sci. 2020;38(11–12):1359–67. doi: 10.1080/02640414.2019.1649524 - DOI - PubMed

LinkOut - more resources