Observational Study
. 2024 Sep 10;103(5):e209749.
doi: 10.1212/WNL.0000000000209749. Epub 2024 Aug 12.

Longitudinal Changes of Clinical, Imaging, and Fluid Biomarkers in Preataxic and Early Ataxic Spinocerebellar Ataxia Type 2 and 7 Carriers

Affiliations
Observational Study

Longitudinal Changes of Clinical, Imaging, and Fluid Biomarkers in Preataxic and Early Ataxic Spinocerebellar Ataxia Type 2 and 7 Carriers

Giulia Coarelli et al. Neurology. .

Abstract

Background and objectives: Brain MRI abnormalities and increases in neurofilament light chain (NfL) have mostly been observed in cross-sectional studies before ataxia onset in polyglutamine spinocerebellar ataxias. Our study aimed to identify longitudinal changes in biological, clinical, and/or imaging biomarkers in spinocerebellar ataxia (SCA) 2 and SCA7 carriers over 1 year.

Methods: We studied SCA2 and SCA7 carriers and controls (expansion-negative relatives) at the Paris Brain Institute. Inclusion criteria included Scale for the Assessment and Rating of Ataxia (SARA) scores between 0 and 15. Assessments at baseline, 6 months, and 12 months comprised neurologic, quality of life, orofacial motor, neuropsychological, and ophthalmologic examinations, along with gait and oculomotor recordings, brain MRI, CSF, and blood sampling. The primary outcome was the longitudinal change in these assessments over 1 year.

Results: We included 15 SCA2 carriers, 15 SCA7 carriers, and 10 controls between May 2020 and April 2021. At baseline, the ages were similar (41 [37, 46] for SCA2, 38 [28.5, 39.8] for SCA7, and 39.5 [31, 54.5] for controls, p = 0.78), as well the sex (p = 0.61); SARA scores were low but different (4 [1.25, 6.5] in SCA2, 2 [0, 11.5] in SCA7, and 0 in controls, p < 0.01). Pons and medulla volumes were smaller in SCAs (p < 0.05) and cerebellum volume only in SCA2 (p = 0.01). Plasma NfL levels were higher in SCA participants (SCA2: 14.2 pg/mL [11.52, 15.89], SCA7: 15.53 [13.27, 23.23]) than in controls (4.88 [3.56, 6.17], p < 0.001). After 1-year follow-up, in SCA2, there was significant pons (-144 ± 60 mm3) and cerebellum (-1,508 ± 580 mm3) volume loss and a worsening of gait assessment; in SCA7, SARA score significantly increased (+1.3 ± 0.4) and outer retinal nuclear layer thickness decreased (-15.4 ± 1.6 μm); for both SCA groups, the orofacial motor assessment significantly worsened. For preataxic and early ataxic carriers, the strongest longitudinal deterioration on outcome measures was orofacial motility in SCA2 and retinal thickness in SCA7.

Discussion: Despite the limitation of the small sample size, we detected annual changes in preataxic and early ataxic SCA individuals across brain MRI imaging, clinical scores, gait parameters, and retinal thickness. These parameters could serve as potential end points for future therapeutic trials in the preataxic phase.

Trial registration information: ClinicalTrials.gov NCT04288128.


Conflict of interest statement

The authors report no relevant disclosures. Go to Neurology.org/N for full disclosures.

Figures

Figure 1
Figure 1. Correlation Between Time to Onset and the Variables of Interest Different Between SCA and Controls
Plasma NfL levels started to increase compared with controls more than 10 years before the estimated disease onset for both SCAs, followed by the pons and then cerebellum volume loss. The black solid line is the mean value for controls with the 95% CI in the dashed line. Spearman correlations were computed. Saccade velocity related to saccades of 5–10°, and pons and cerebellum volumes are reported in cm3. EI = expansion index (for CAG repeat); MBLF = Oral-Lingual-Facial Motility; NFL = plasma neurofilament light chain; ONL = outer nuclear layer; SCA = spinocerebellar ataxia.
Figure 2
Figure 2. Correlation Between SARA and the Variables of Interest Different Between SCA and Controls
For SCA7, all parameters (except for the cerebellum volume) significantly worsened with SARA score increase. For SCA2, this correlation was significant for pons and cerebellum volumes, lateral step deviation, and expansion index. The black solid line is the mean value for controls with the 95% CI in the dashed line. Spearman correlations were computed. Saccade velocity related to saccades of 5–10°, and pons and cerebellum volumes are reported in cm3. EI = expansion index (for CAG repeat); MBLF = Oral-Lingual-Facial Motility; NFL = plasma neurofilament light chain; ONL = outer nuclear layer; SCA = spinocerebellar ataxia.
Figure 3
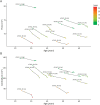
Figure 3. Longitudinal Progression of Pons and Cerebellum Atrophy up to 10-Year Follow-Up
In this figure, we report the progression of pons (A) and cerebellum (B) volumes in CERMOI individuals (7 SCA2 and 4 SCA7 carriers) who participated in 2 previous longitudinal studies (BIOSCA, NCT01470729 and ATRIL, NCT03347344). The volume loss is quite linear during the follow-up period. The ataxia severity scored by the SARA scale is illustrated by the color code on the right. For each participant, the gene and the CAG repeat size are reported.

References

    1. Tezenas du Montcel S, Petit E, Olubajo T, et al. . Baseline clinical and blood biomarkers in patients with preataxic and early-stage disease spinocerebellar ataxia 1 and 3. Neurology. 2023;100(17):e1836-e1848. doi:10.1212/WNL.0000000000207088 - DOI - PMC - PubMed
    1. Coarelli G, Coutelier M, Durr A. Autosomal dominant cerebellar ataxias: new genes and progress towards treatments. Lancet Neurol. 2023;22(8):735-749. doi:10.1016/S1474-4422(23)00068-6 - DOI - PubMed
    1. Friedrich J, Kordasiewicz HB, O'Callaghan B, et al. . Antisense oligonucleotide-mediated ataxin-1 reduction prolongs survival in SCA1 mice and reveals disease-associated transcriptome profiles. JCI Insight. 2018;3(21):e123193. doi:10.1172/jci.insight.123193 - DOI - PMC - PubMed
    1. Scoles DR, Meera P, Schneider MD, et al. . Antisense oligonucleotide therapy for spinocerebellar ataxia type 2. Nature. 2017;544(7650):362-366. doi:10.1038/nature22044 - DOI - PMC - PubMed
    1. Niu C, Prakash TP, Kim A, et al. . Antisense oligonucleotides targeting mutant Ataxin-7 restore visual function in a mouse model of spinocerebellar ataxia type 7. Sci Transl Med. 2018;10(465):eaap8677. doi:10.1126/scitranslmed.aap8677 - DOI - PMC - PubMed

Publication types

Associated data