Clinical Trial
. 2024 Aug 12;12(8):e007854.
doi: 10.1136/jitc-2023-007854.

Epithelium/imcDC2 axis facilitates the resistance of neoadjuvant anti-PD-1 in human NSCLC

Affiliations
Clinical Trial

Epithelium/imcDC2 axis facilitates the resistance of neoadjuvant anti-PD-1 in human NSCLC

Yongyuan Chen et al. J Immunother Cancer. .

Abstract

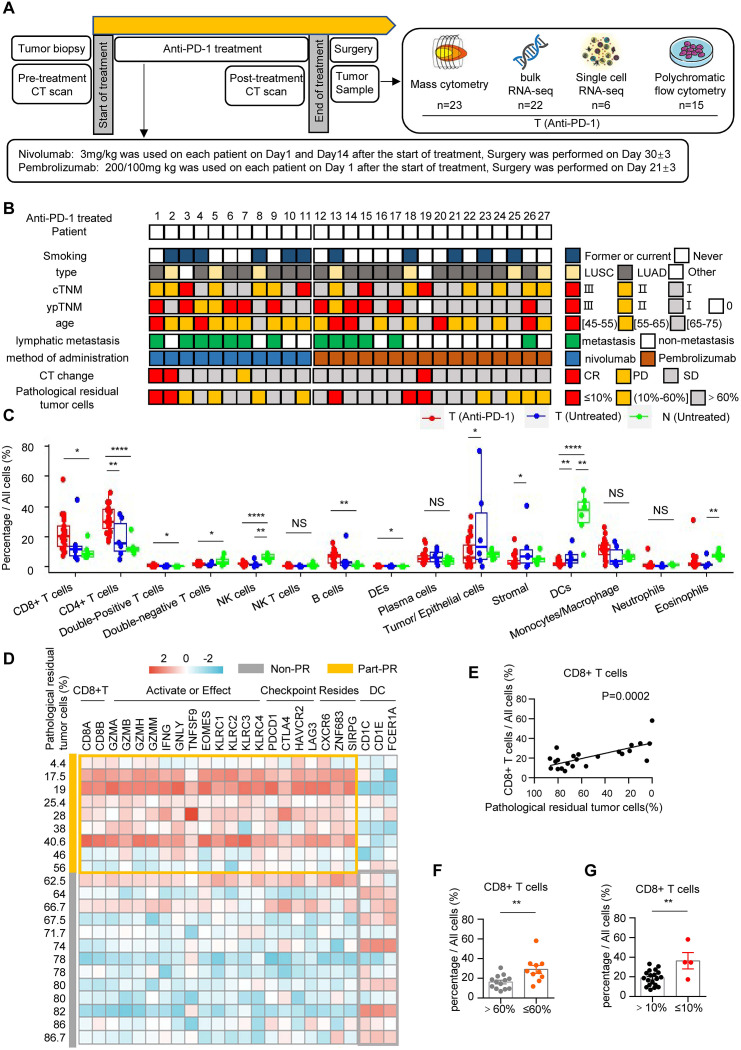
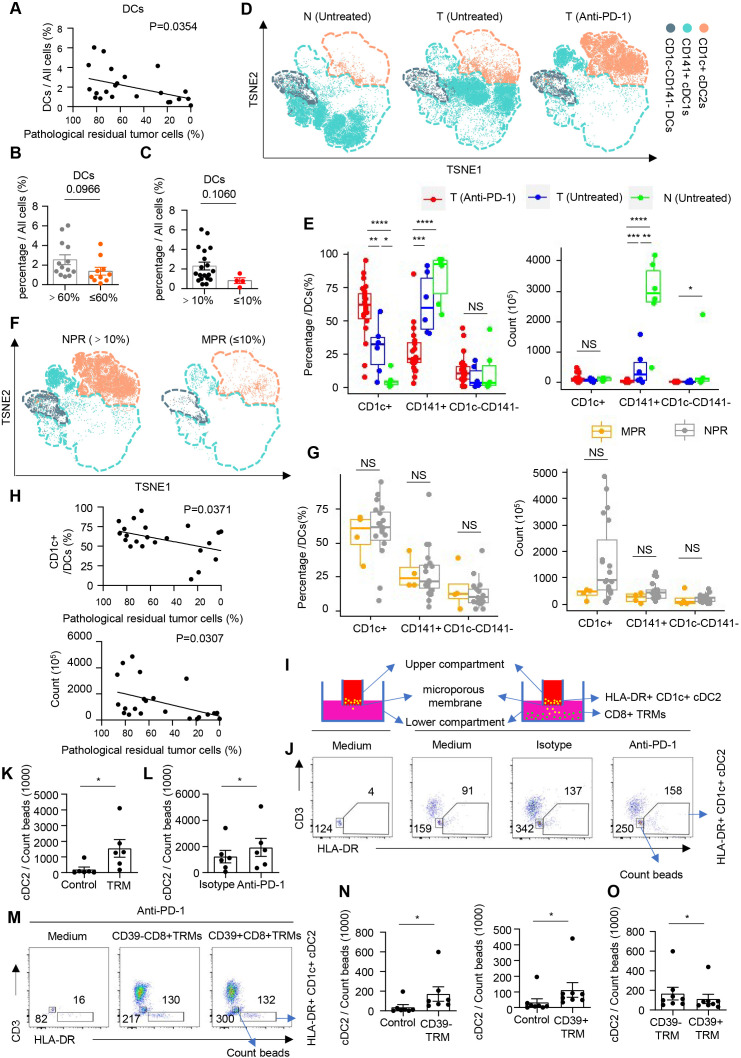
Background: Therapeutic resistance is a main obstacle to achieve long-term benefits from immune checkpoint inhibitors. The underlying mechanism of neoadjuvant anti-PD-1 resistance remains unclear.

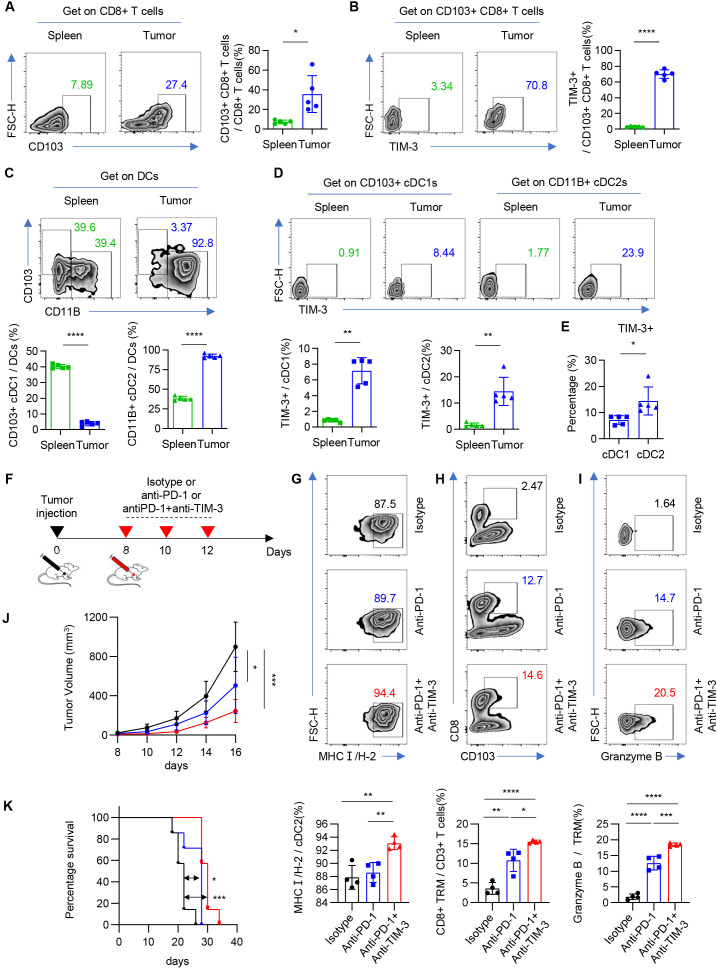
Methods: Multi-omics analysis, including mass cytometry, single-cell RNA-seq, bulk RNA-seq, and polychromatic flow cytometry, was conducted using the resected tumor samples in a cohort of non-small cell lung cancer (NSCLC) patients received neoadjuvant anti-PD-1 therapy. Tumor and paired lung samples acquired from treatment-naïve patients were used as a control. In vitro experiments were conducted using primary cells isolated from fresh tissues and lung cancer cell lines. A Lewis-bearing mouse model was used in the in vivo experiment.

Results: The quantity, differentiation status, and clonal expansion of tissue-resident memory CD8+ T cells (CD8+ TRMs) are positively correlated with therapeutic efficacy of neoadjuvant anti-PD-1 therapy in human NSCLC. In contrast, the quantity of immature CD1c+ classical type 2 dendritic cells (imcDC2) and galectin-9+ cancer cells is negatively correlated with therapeutic efficacy. An epithelium/imDC2 suppressive axis that restrains the antitumor response of CD8+ TRMs via galectin-9/TIM-3 was uncovered. The expression level of CD8+ TRMs and galectin-9+ cancer cell-related genes predict the clinical outcome of anti-PD-1 neoadjuvant therapy in human NSCLC patients. Finally, blockade of TIM-3 and PD-1 could improve the survival of tumor-bearing mouse by promoting the antigen presentation of imcDC2 and CD8+ TRMs-mediated tumor-killing.

Conclusion: Galectin-9 expressing tumor cells sustained the primary resistance of neoadjuvant anti-PD-1 therapy in NSCLC through galectin-9/TIM-3-mediated suppression of imcDC2 and CD8+ TRMs. Supplement of anti-TIM-3 could break the epithelium/imcDC2/CD8+ TRMs suppressive loop to overcome anti-PD-1 resistance.

Trial registration number: NCT03732664.

Keywords: CD8-Positive T-Lymphocytes; Immune Checkpoint Inhibitors; Non-Small Cell Lung Cancer.


Conflict of interest statement

Competing interests: None declared.

Figures

Figure 1
Figure 1. Tumor microenvironment remodeling after anti-PD-1 immunotherapy. (A) Trial schema and the timing of the biopsy and surgery sample collections. (B) Clinical information and pathological outcomes of each anti-PD-1 treated patients. (C) The box plot shows the percentage of each cell type in all cells. Data are shown as mean±SEM; T (Anti-PD-1) (red, tumor after anti-PD-1 immunotherapy, n=23), T (Untreated) (blue, untreated tumor tissues, n=6), N (Untreated) (green, untreated adjacent normal tissues, n=6); NS p≥0.05; *p<0.05; **p<0.01; ****p<0.0001. (D) Correlation analysis showing the correlation between each cell type and the correlation between each cell type and pathological residual rate in tumor after anti-PD-1 immunotherapy. n=23, *p<0.05; **p<0.01; ***p<0.001; ****p<0.0001. (E) Heatmaps showing relative abundance of representative differentially expressed genes between Part-PR (≤60%, n=9) and Non-PR (>60%, n=13), standardized by Z score. (F) Correlation analysis shows a correlation between the percentage of CD8+ T cells and the rate of pathological tumor residual. (G) The bar graph shows the percentage of CD8+ T cells in all cells ≤60% (orange, pathological residual tumor cells ≤60%, n=10), >60% (gray, pathological residual tumor cells >60%, n=13); **p<0.01. (H) The bar graph shows the percentages of CD8+ T cells in all cells ≤10% (red, pathological residual tumor cells ≤10%, n=4), >10% (black, pathological residual tumor cells >10%, n=19); **p<0.01.
Figure 2
Figure 2. CD8+ TRMs are positively correlated with the efficacy of anti-PD-1 immunotherapy. (A) t-SNE plots embedding of CD8+ T cells grouped by organizational source from NSCLC tumor after anti-PD-1 immunotherapy (T (Anti-PD-1), n=23), untreated tumor tissues (T (Untreated), n=6) and untreated paired normal tissues (N (Untreated), n=6) by CyTOF using a PhenoGraph clustering scheme, with each cell color coded to indicate the associated cell types. (B) The box plot shows the percentages (left) and the absolute number (right) of different subgroups in CD8+ T cells. T (Anti-PD-1) (red, n=23); T (Untreated) (blue, n=6); N (Untreated) (green, n=6). NS p≥0.05; *p<0.05; **p<0.01; ***p<0.001; ****p<0.0001. (C) The same t-SNE as (A), grouped by different therapeutic effect. MPR (pathological residual tumor cells ≤10%, n=4), NPR (pathological residual tumor cells >10%, n=19). (D) The box plot shows the percentages (left) and the absolute number (right) of different subgroups in CD8+ T cells. MPR (orange, pathological residual tumor cells ≤10%, n=4); NPR (gray, pathological residual tumor cells >10%, n=19). NS p≥0.05; ***p<0.001. (E) Correlation analysis shows the correlation between the percentages (left) or the absolute number (right) of TRMs (CD69+ CD103+ T cells) and pathological residual rate in tumor after anti-PD-1 immunotherapy. n=23. (F) Correlation analysis shows the correlation between the percentages (left) or the absolute number (right) of CD69− CD103− CD8+ T cells and pathological residual rate in tumor after anti-PD-1 immunotherapy. n=23. (G) Representative flow cytometric analysis of the expression of CD69 and CD103 in CD8+ T cells pre- or post-anti-PD-1 treatment in NSCLC. Numbers in plots indicate the percentages of cells in respective gates. (H) The bar graph shows the percentages of TRMs, CD69+ CD103− T cells and CD69− CD103− in CD8+ T cells pre- or post-anti-PD-1 treatment in NSCLC. Pre (blue, n=15); post (red, n=15). NS p≥0.05; *p<0.05. Pretreatment: tumor samples obtained at the time of lung puncture, post-treatment: tumor samples obtained at the time of surgery after completion of the 1-month course of anti-PD-1 treatment. (I) Heatmap of mean log-normalized expression of different proteins in CD8+ TRMs. T (Anti-PD-1), n=23; T (Untreated), n=6; N (Untreated), n=6; MPR, n=4; NPR, n=19. (J) Normalized expression of IL7R, ENTPD1, and GZMB genes between all samples in ITGAE+ CD69+ CD8+ T cells. Violin plot indicates the range of normalized expression; each black dot refers to a captured cell; width indicates number of cells at the indicated expression level. MPR, major pathological response; NPR, no pathological response; NSCLC, non-small cell lung cancer; t-SNE, t-distributed stochastic neighbor embedding.
Figure 3
Figure 3. CD8+ TRMs differentiation correlates with the efficacy of anti-PD-1 immunotherapy. (A) t-SNE plots embedding of CD8+ TRMs grouped by organizational source from non-small cell lung cancer (NSCLC) tumor after anti-PD-1 immunotherapy (T (Anti-PD-1), n=23), untreated tumor tissues (T (Untreated), n=6) and untreated paired normal tissues (N (Untreated), n=6) by CyTOF using a PhenoGraph clustering scheme, with each cell color coded to indicate the associated cell types. (B) The box plot shows the percentages (left) and the absolute number (right) of different subgroups in CD8+ TRMs. T (Anti-PD-1) (red, n=23); T (Untreated) (blue, n=6); N (Untreated) (green, n=6). NS p≥0.05; *p<0.05; **p<0.01; ***p<0.001; ****p<0.0001. (C) The same t-SNE as (A), grouped by and different therapeutic effect. MPR (pathological residual tumor cells ≤10%, n=4), NPR (pathological residual tumor cells >10%, n=19). (D) The box plot shows the absolute number of different subgroups in CD8+ TRMs. MPR (orange, pathological residual tumor cells ≤10%, n=4); NPR (gray, pathological residual tumor cells >10%, n=19). NS p≥0.05; ***p<0.001. (E) Correlation analysis shows the correlation between the percentages of CD38+ CD39+ CD8+ TRMs and pathological residual rate in tumor after anti-PD-1 immunotherapy. n=23. (F) Correlation analysis shows the correlation between the percentages of CD38− CD39− CD8+ TRMs and pathological residual rate in tumor after anti-PD-1 immunotherapy. n=23. (G) UMAP embedding of transcriptional profiles for ITGAE+ CD69+ CD8+ T cells grouped by and different therapeutic effect from all NSCLC samples after anti-PD-1 treatment (n=6). Each dot represents a single cell, and each cell color coded to indicate the associated cell types. Non-PR (pathological residual tumor cells >60%, n=3), Part-PR (pathological residual tumor cells ≤60%, n=3). (H) The same UMAP as (G). Colors represent the types of clonotype. (I) The pie chart shows the proportion of different clonotypes in different CD8+ TRM subsets. T (Anti-PD-1), n=6. Colors represent the types of clonotype. (J) The bar graph shows the types of clonotype in different CD8+ TRM subsets. Non-PR (pathological residual tumor cells >60%, n=3), Part-PR (pathological residual tumor cells ≤60%, n=3). (K) The bar graph shows the count of TCR diversity in different CD8+ TRM subsets. Non-PR (pathological residual tumor cells >60%, n=3), Part-PR (pathological residual tumor cells ≤60%, n=3). (L) Heatmap of mean log-normalized expression of different genes in CD8+ T cells, standardized by Z score. T (Anti-PD-1), n=6. (M) Pseudotemporal analysis (Monocle2) of ITGAE+ CD69+ CD8+ T cells from all samples. T (Anti-PD-1), n=6. Arrows indicate possible differentiation directions. MPR, major pathological response; NPR, no pathological response; t-SNE, t-distributed stochastic neighbor embedding.
Figure 4
Figure 4. CD1C+ DCs recruited by precursor CD8+ TRMs are enriched in anti-PD-1 resistance groups. (A) Correlation analysis shows a correlation between the percentage of DCs and the rate of pathological tumor residual. Heatmap of mean log-normalized expression of different proteins in DCs. n=35. (B) The bar graph shows the percentage of DCs in all cells ≤60% (orange, pathological residual tumor cells ≤60%, n=10), >60% (gray, pathological residual tumor cells >60%, n=13). (C) The bar graph shows the percentages of DCs in all cells ≤10% (red, pathological residual tumor cells ≤10%, n=4), >10% (black, pathological residual tumor cells >10%, n=19). (D) t-SNE plots embedding of DCs grouped by organizational source from non-small cell lung cancer (NSCLC) tumor after anti-PD-1 immunotherapy (T (Anti-PD-1), n=23), untreated tumor tissues (T (Untreated), n=6), and untreated paired normal tissues (N (Untreated), n=6) by CyTOF using a PhenoGraph clustering scheme, with each cell color coded to indicate the associated cell types. (E) The box plot shows the percentages (top) and the absolute number (bottom) of different subgroups in DCs. T (Anti-PD-1) (red, n=23); T (Untreated) (blue, n=6); N (Untreated) (green, n=6). NS p≥0.05; *p<0.05; **p<0.01; ***p<0.001; ****p<0.0001. (F) The same t-SNE as (B), grouped by different therapeutic effect. MPR (pathological residual tumor cells ≤10%, n=4), NPR (pathological residual tumor cells >10%, n=19). (G) The box plot shows the percentages (left) and the absolute number (right) of different subgroups in DCs. MPR (orange, pathological residual tumor cells ≤10%), n=4; NPR (gray, pathological residual tumor cells >10%), n=19. NS p≥0.05. (H) Correlation analysis shows the correlation between the percentages (top) or the absolute number (bottom) of CD1c+ DC2s and pathological residual rate in tumor after anti-PD-1 immunotherapy. n=23. (I) Experimental setup of in vitro recruitment assay. CD1c+ DC2s are cultured on transwell inserts (5 mm pore size) and CD8+ TRMs are plated in the bottom well. (J) Representative flow cytometric analysis of CD8+ TRMs and CD1c+ DCs in all live (7-AAD+) cells from NSCLC. CD1c+ DCs are cultured on transwell inserts and CD8+ TRMs are plated in the bottom well with nothing (medium), isotype (10 µg/mL) or anti-PD-1 (10 µg/mL) (DC: T=1:4). Cells sorting from untreated tumors were analyzed by flow cytometry. Numbers in plots indicate the absolute number of cells in respective gates. (K) The bar plot shows the absolute number of CD1c+ DCs per 1000 count beads. n=6. *p<0.05. (L) The bar plot shows the absolute number of CD1c+ DCs per 1000 count beads. n=6. *p<0.05. (M) Representative flow cytometric analysis of CD39+/− CD8+ TRM cells and CD1c+ DCs in all live (7-AAD+) cells from NSCLC. CD1c+ DCs are cultured on transwell inserts and CD39+/− CD8+ TRMs are plated in the bottom well with anti-PD-1 (10 µg/mL) (DC: T=1:4). Cells sorting from untreated tumors are analyzed by flow cytometry. Numbers in plots indicate the absolute number of cells in respective gates. (N) The bar plot shows the absolute number of CD1c+ DCs per 1000 count beads. n=8. *p<0.05. (O) The bar plot shows the absolute number of CD1c+ DCs per 1000 count beads. n=8. *p<0.05. DC, dendritic cell; MPR, major pathological response; NPR, no pathological response; t-SNE, t-distributed stochastic neighbor embedding.
Figure 5
Figure 5. Tumor cells inhibit the maturity of CD1c+ DC2 via galectin-9. (A) Heatmap of mean log-normalized expression of different proteins in dendritic cells (DCs). n=35. (B) The box plot shows the mean log-normalized expression of PD-L1, PD-L2, CTLA-4, and TIM-3 in DCs. n=35. NS p≥0.05; *p<0.05; ***p<0.001; ****p<0.0001. (C) The box plot shows the mean log-normalized expression of TIM-3 in CD141+ DC1s and CD1c+ DC2s. T (Anti-PD-1), n=23; T (Untreated), n=6; N (Untreated), n=6. NS p≥0.05; *p<0.05; ***p<0.001. (D) The box plot shows the mean log-normalized expression of TIM-3 in CD141+ DC1s and CD1c+ DC2s. Part-PR, n=10; Non-PR, n=13; T (Untreated), n=6. NS p≥0.05; *p<0.05. (E) Expression plots depict average Z-transformed normalized expression of common immune checkpoint genes in each subgroup of DCs in NSCLC after anti-PD-1 treatment. n=6. (F) The box plot shows the percentage of HLA-A/B/C+ (left) and CD86+ (right) in CD1c+ DC2s. T (Untreated), n=4; N (Untreated), n=4. *p<0.05. (G) The box plot shows the percentage of HLA-A/B/C+ in CD86− or CD86+ CD1c+ DC2s. T (Untreated), n=4; N (Untreated), n=4. **p<0.01. (H) Normalized expression of HLA-A and CD86 genes between all samples in CD1C+ CLEC10A+ DC2s. Violin plot indicates the range of normalized expression; each black dot refers to a captured cell; width indicates the number of cells at the indicated expression level. (I) CD1c+ DC2s and CD8+ TRMs are cocultured with galectin-9+ epithelial cells (Epi) with control, isotype (10 µg/mL) or anti-TIM-3 (10 µg/mL) treatment for 24 hours after anti-PD-1 (10 µg/mL) treatment in vitro (Epi:DC:T=5:1:1). Cells sorting from T (Untreated) (n=6) were analyzed by flow cytometry. The line graph shows the percentage of CD86 (left) and HLA-A/B/C (right) in CD1c+ DC2s. *p<0.05; **p<0.01; ***p<0.001.
Figure 6
Figure 6. Galectin-9+ epithelial cells (Epi) correlates with poor neoadjuvant anti-PD-1 response and limited tumor killing capacity of CD8+ TRMs. (A) Paraffin sections from non-small cell lung cancer (NSCLC) patients (scale bars represent 50 µm) were stained with anti-human Epcam (green), anti-human galectin-9 (red), and DAPI (blue) for immunofluorescent (IF) staining. (B) Expression plots depict average Z-transformed normalized expression of common immune checkpoint ligands genes in each subgroup of Epi in NSCLC after anti-PD-1 treatment. n=6. (C) Volcano plots presenting the differentially expressed genes between Part-PR groups and Non-PR groups. P<0.05, |LogFC|>1. (D) Expression plots depict average Z-transformed normalized expression of representative genes in each subgroup of Epi in NSCLC after anti-PD-1 treatment. n=6. (E) Heatmaps showing relative genes expression of galectin-9+ Epcam, cDC2, and CD8+ TRM. n=19. Standardized by Z score. (F) The box plot shows the percentage of CD39+ CD38+ TRM, CD39− CD38− TRM, CD1c+ cDC2 and pathological residual tumor cells in galecin-9 low or galecin-9 high tumor. n=19, *p<0.05; **p<0.01; ****p<0.0001. (G) A549 were cocultured with CD8+ TRMs and CD1c+ DC2s (1:2:2) for 24 hours with or without anti-TIM-3 (10 µg/mL) treatment in vitro. The line graph shows the percentage of CD39+ in CD8+ TRMs. T (Untreated), n=6; **p<0.01. (H) A549 were cocultured with CD8+ TRMs and CD1c+ DC2s (1:2:2) for 24 hours with or without anti-TIM-3 (10 µg/mL) treatment in vitro. The line graph shows the percentage of 7-AAD+ in A549. T (Untreated), n=9; *p<0.05, ***p<0.001, ****p<0.0001. (I) A549 were cocultured with CD8+ TRMs and CD1c+ DC2s (1:2:2) for 24 hours with or without anti-PD-1 (10 µg/mL) or anti-TIM-3 (10 µg/mL) treatment in vitro. The line graph shows the percentage of 7-AAD+ in A549. T (Untreated), n=9; *p<0.05; **p<0.01, ***p<0.001.
Figure 7
Figure 7. Mouse model and in vivo research. (A) Representative flow cytometric analysis of CD103+ CD8+ T cells in CD8+ T cells. Numbers in plots indicate the positive percentage of cells in respective gates (left). The bar graph shows the percentage of CD103+ CD8+ T cells in CD8+ T cells. n=5. *p<0.05 (right). (B) Representative flow cytometric analysis of TIM-3+ cells in CD103+ CD8+ T cells. Numbers in plots indicate the positive percentage of cells in respective gates (left). The bar graph shows the percentage of TIM-3+ cells in CD103+ CD8+ T cells. n=5. ****p<0.0001 (right). (C) Representative flow cytometric analysis of CD103+ cells or CD11B+ cells in cDCs. Numbers in plots indicate the positive percentage of cells in respective gates (top). The bar graph shows the percentage of CD103+ cells or CD11B+ cells in cDCs. n=5. ****p<0.0001 (bottom). (D) Representative flow cytometric analysis of TIM-3+ cells in CD103+ cDC1s or CD11B+ cDC2s. Numbers in plots indicate the positive percentage of cells in respective gates (top). The bar graph shows the percentage of TIM-3+ cells in CD103+ cDC1s or CD11B+ cDC2s. n=5. **p<0.01 (bottom). (E) The bar graph shows the percentage of TIM-3+ cells in CD103+ cDC1s or CD11B+ cDC2s. n=5. *p<0.05 (bottom). (F) Pattern diagram shows mice were given anti-TIM-3 antibody, anti-mPD-1 antibody, or isotype starting on the eighth day after tumor inoculation and treated on the indicated days for a total of three treatments. (G) Representative flow cytometric analysis of MHCI(H-2) cells in CD11B+ cDC2s. Numbers in plots indicate the positive percentage of cells in respective gates (top). The bar graph shows the percentage of MHCI(H-2) cells in CD11B+ cDC2s. n=4. **p<0.01 (bottom). (H) Representative flow cytometric analysis of CD103+ CD8+ T cells in CD3+ T cells. Numbers in plots indicate the positive percentage of cells in respective gates (top). The bar graph shows the percentage of CD103+ CD8+ T cells in CD3+ T cells. n=4. *p<0.05, **p<0.01, ****p<0.0001 (bottom). (I) Representative flow cytometric analysis of granzyme B+ cells in CD103+ CD8+ T cells. Numbers in plots indicate the positive percentage of cells in respective gates (top). The bar graph shows the percentage of granzyme B+ cells in CD103+ CD8+ T cells. n=4. ***p<0.001, ****p<0.0001 (bottom). (J) Tumor growth in mice bearing Lewis tumors. Mice were given anti-TIM-3 antibody, anti-mPD-1 antibody, or isotype. n=7. *p<0.05, ***p<0.001. Data are presented as the mean±SEM. (K) Survival of mice bearing Lewis tumors. Mice were given anti-TIM-3 antibody, anti-mPD-1 antibody, or isotype. n=7. *p<0.05, ***p<0.001.

References

    1. Sharma P, Allison JP. The future of immune checkpoint therapy. Science. 2015;348:56–61. doi: 10.1126/science.aaa8172. - DOI - PubMed
    1. Morad G, Helmink BA, Sharma P, et al. Hallmarks of response, resistance, and toxicity to immune checkpoint blockade. Cell. 2021;184:5309–37. doi: 10.1016/j.cell.2021.09.020. - DOI - PMC - PubMed
    1. Vesely MD, Zhang T, Chen L. Resistance Mechanisms to Anti-PD Cancer Immunotherapy. Annu Rev Immunol. 2022;40:45–74. doi: 10.1146/annurev-immunol-070621-030155. - DOI - PubMed
    1. Sharma P, Siddiqui BA, Anandhan S, et al. The Next Decade of Immune Checkpoint Therapy. Cancer Discov. 2021;11:838–57. doi: 10.1158/2159-8290.CD-20-1680. - DOI - PubMed
    1. Bagchi S, Yuan R, Engleman EG. Immune Checkpoint Inhibitors for the Treatment of Cancer: Clinical Impact and Mechanisms of Response and Resistance. Annu Rev Pathol. 2021;16:223–49. doi: 10.1146/annurev-pathol-042020-042741. - DOI - PubMed

Publication types

MeSH terms

Substances

Associated data