. 2024 Sep 10;11(9):ENEURO.0167-24.2024.
doi: 10.1523/ENEURO.0167-24.2024. Print 2024 Sep.

Convergent Comodulation Reduces Interindividual Variability of Circuit Output

Affiliations

Convergent Comodulation Reduces Interindividual Variability of Circuit Output

Anna C Schneider et al. eNeuro. .

Abstract

Ionic current levels of identified neurons vary substantially across individual animals. Yet, under similar conditions, neural circuit output can be remarkably similar, as evidenced in many motor systems. All neural circuits are influenced by multiple neuromodulators, which provide flexibility to their output. These neuromodulators often overlap in their actions by modulating the same channel type or synapse, yet have neuron-specific actions resulting from distinct receptor expression. Because of this different receptor expression pattern, in the presence of multiple convergent neuromodulators, a common downstream target would be activated more uniformly in circuit neurons across individuals. We therefore propose that a baseline tonic (non-saturating) level of comodulation by convergent neuromodulators can reduce interindividual variability of circuit output. We tested this hypothesis in the pyloric circuit of the crab, Cancer borealis Multiple excitatory neuropeptides converge to activate the same voltage-gated current in this circuit, but different subsets of pyloric neurons have receptors for each peptide. We quantified the interindividual variability of the unmodulated pyloric circuit output by measuring the activity phases, cycle frequency, and intraburst spike number and frequency. We then examined the variability in the presence of different combinations and concentrations of three neuropeptides. We found that at mid-level concentration (30 nM) but not at near-threshold (1 nM) or saturating (1 µM) concentrations, comodulation by multiple neuropeptides reduced the circuit output variability. Notably, the interindividual variability of response properties of an isolated neuron was not reduced by comodulation, suggesting that the reduction of output variability may emerge as a network effect.

Keywords: central pattern generator; neuromodulation; stomatogastric; variability.


Conflict of interest statement

The authors declare no competing financial interests.

Figures
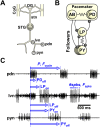
Figure 1.
Figure 1.
The stomatogastric nervous system (STNS) of crabs. A, Schematic of the STNS of the crab C. borealis. Neurons of the pyloric circuit are located in the stomatogastric ganglion (STG). They receive input from neuromodulatory projection neurons that originate in the paired commissural ganglia (CoG) and the unpaired esophageal ganglion (OG) and send their axons through the stomatogastric nerve (stn). Pyloric motor neurons project their axons through the lateral ventricular (lvn), pyloric dilator (pdn), and pyloric constrictor (pyn) nerves. The extracellular recording sites are indicated by circles. B, The core pyloric circuit consists of a group of pacemaker neurons: the anterior burster (AB) and two pyloric dilator (PD) neurons. They inhibit their followers, the lateral pyloric (LP) and 3–5 pyloric constrictor (PY) neurons. Inhibitory synapses are shown as circles, and electrical connections are depicted with resistor symbols. C, The pyloric rhythm and rhythm parameters. The activity of the PD neurons from the pacemaker group is recorded from the pdn. Activity of all neurons can be recorded from the lvn, where LP is typically the largest unit, PD is mid-sized, and PY are the smallest units. In addition, PD and PY activity are also recorded from the pdn and pyn, respectively. Cycle period is defined as the time from the beginning of one PD burst (PDon) to the next. Fcycle is the inverse of cycle period (P). Burst start (on) and end (off) for each neuron is calculated by dividing the latency with respect to PDon by the cycle period. In addition, we counted the number of spikes per burst (#spks) and calculated the average spike frequency (Fspks) by dividing #spks-1 by burst duration (off-on).
Figure 2.
Figure 2.
Comodulation at mid concentrations reduces the interindividual variability of cycle period. A, Schematic indication of neuromodulator target neurons (filled circles) in the different neuromodulatory conditions. In the intact condition, each neuron is targeted by an unknown number of neuromodulators. After decentralization (transection of the stomatogastric nerve), all neuromodulation is removed. Proctolin (PROC, P) targets all pyloric neurons, whereas CCAP (C) and RPCH (R) target only AB and LP neurons. B, Overlapping targets of comodulation by PROC, CCAP, and RPCH. Shading indicates how many of the applied neuromodulators target each neuron of the pyloric circuit. C, Extracellular recordings of the pyloric rhythm from one animal under different neuromodulatory conditions (color coded). After decentralization (dec.), we applied increasing numbers (P, PC, PCR) and increasing concentrations ([low]: 10−9 M, [mid]: 3 × 10−8 M) of neuropeptides (arrows), followed by washing out all neuromodulators. D, Fcycle and the corresponding CV (standard deviation/mean) under different modulatory conditions. Bottom panel: Individual dots represent data from individual experiments; red bars indicate the mean value. N = 15 animals. The asterisk indicates pairwise significant differences between the group indicated with the longer line and those indicated with shorter lines. All other pairwise comparisons were not statistically significant. Statistical results are shown in Table 1. Total modulator concentration for [low]: 10−9 M; [mid]: 3 × 10−8 M.
Figure 3.
Figure 3.
Comodulation at mid concentrations reduces the interindividual variability of pyloric rhythm parameters on the circuit output level. A, Circular plot of a randomly generated phase dataset (N = 10; x¯ = 0.35; µ = 0.15). The length of the r-vector indicates the spread of the data. We use 1 − r as measure for variability of circular data. Markers inside the circle indicate 25, 50, and 75% of the radius of the unit circle. B, Burst start (on) and termination (off) and the corresponding circular variance (1 − r; see Materials and Methods) under different modulatory conditions (color coded). Individual dots represent data from individual experiments; red bars indicate the circular mean. Asterisks indicate pairwise significant differences between the group indicated with the longer line and those indicated with shorter lines. All other pairwise comparisons were not statistically significant. N = 15 animals. Statistical results are shown in Table 1. Total modulator concentration for [low]: 10−9 M; [mid]: 3 × 10−8 M. C, Sum of eigenvalues from the covariance matrix of the phases shown in panel B for each modulatory condition.
Figure 4.
Figure 4.
Comodulation at mid concentrations reduces the interindividual variability of burst parameters on the circuit output level. A, Average number of spikes (#spks) per burst and corresponding CV for each type of neuron at each modulatory condition (color coded). B, Average spike frequency (Fspks) within a burst and corresponding CV for each type of neuron at each modulatory condition (color coded). C, Sum of eigenvalues from the covariance matrix of pooled #spks and Fspks for each modulatory condition. Asterisks indicate pairwise significant differences between the group indicated with the longer line and those indicated with shorter lines. The two groups indicated with daggers in panel A are significantly different from all other groups but not one another. All other pairwise comparisons were not statistically significant. N = 15 animals. Dots represent values from individual experiments; horizontal bars indicate the mean values. Statistical results in Table 1. Total modulator concentration for [low]: 10−9 M; [mid]: 3 × 10−8 M.
Figure 5.
Figure 5.
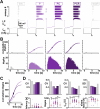
Comodulation does not reduce the interindividual variability of excitability metrics on the single cell level. A, Voltage changes of one example LP neuron in response to increasing and decreasing current step. B, f–I curve of the experiment in A. The average spike frequency at each current level (dots and error bars indicate mean ± SD) was fitted with a power function (black line). To calculate f–I hysteresis between increasing (filled circles) and decreasing (open circles) levels of current steps, we divided the average spiking frequency in increasing by decreasing current levels between 2 and 4 nA (shaded area). C, Fit parameters (scaling factor = a, curvature = b in Eq. 1) and hysteresis with the corresponding metric of variability (CV, or SD for interval data) for different modulatory conditions (color coded). Dots represent values from individual experiments; horizontal bars indicate the mean values. Asterisks indicate pairwise significant differences between two groups or the group indicated with the longer line and those indicated with shorter lines. All other pairwise comparisons were not statistically significant. N = 19, except PCR N = 11. Statistical results are shown in Table 4. Total modulator concentration for [mid]: 1–3 × 10−8 M for P and PC, 3 × 10−8 M for PCR.
Figure 6.
Figure 6.
Comodulation does not add to the reduction of interindividual variability of rebound metrics on the single cell level. A, An example of the rebound experiment in different modulatory conditions (color coded). The top panels show the spike raster plots for all five sweeps. The bottom panels show the intracellular voltage of one example sweep. t0 indicates the time point when LP was released from current injection. B, Bottom row, Spike histograms across all sweeps in different modulatory conditions (color coded). Top row, Corresponding cumulative histograms of the panels in the bottom row (circles) and sigmoid fits to the cumulative spike histograms. Dots indicate the sigmoid midpoint. C, Sigmoid fits to the cumulative spike histograms from panel B overlayed for comparison. Dots indicate the sigmoid midpoint. Dashed gray line indicates wash. D, Latency and fit parameters (#spks = a, slope factor = k in Eq. 2) with the corresponding metric of variability (CV, or SD for interval data) for different modulatory conditions (color coded). Dots represent values from individual experiments; horizontal bars indicate the mean values. Asterisks indicate pairwise significant differences between two groups, or the group indicated with the longer line and those indicated with shorter lines. All other pairwise comparisons were not statistically significant. N = 19, except PCR N = 11. Statistical results are shown in Table 5. Total modulator concentration for [mid]: 1–3 × 10−8 M for P and PC, 3 × 10−8 M for PCR.
Figure 7.
Figure 7.
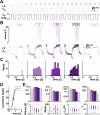
Comodulation does not reduce the interindividual variability of rebound from periodic inhibition on the single cell level. A, One example of LP membrane potential in response to periodic hyperpolarization. B, One example periodic rebound experiment in different modulatory conditions (color coded). The top panels show the spike raster plots for all 20 sweeps. The bottom panels show the intracellular voltage of all sweeps. t0 indicates the time point when LP was released from current injection. C, Spike histogram across the last 10 sweeps in different modulatory conditions. D, Sigmoid fits to the cumulative spike histograms. Dots indicate the sigmoid midpoint. E, Latency and fit parameters (#spks = a, slope factor = k in Eq. 2) with the corresponding metric of variability (CV, or SD for interval data) for different modulatory conditions (color coded). Dots represent values from individual experiments; horizontal bars indicate the means. N = 19, except PCR N = 11. Statistical results in Table 6 indicate no significant difference between the means of the groups. Total modulator concentration for [mid]: 1–3 × 10−8 M for P and PC, 3 × 10−8 M for PCR.
Figure 8.
Figure 8.
Neuropeptides at high concentration reduce the interindividual variability of pyloric rhythm parameters on the circuit output level. A, Fcycle and the corresponding CV under different modulatory conditions (intact, dec., P and PC; color coded) at [high]: 10−6 M concentration. B, Burst start (on) and termination (off) and the corresponding circular variance (1 − r; see Materials and Methods) under different [high] modulatory conditions (same color coding as panel A). C, Number of spikes per burst (#spks) and corresponding CV for each type of neuron at different [high] modulatory conditions (same color coding as panel A). D, Average spike frequency (Fspks) within a burst and corresponding CV for each type of neuron at each [high] modulatory condition (same color coding as panel A). E, The CV or circular variance (1−r) from panels AD for conditions P and PC are shown normalized to the corresponding CV of 1 − r for the decentralized (dec., dashed line) condition. In each panel, the purple bars show the corresponding variability (also normalized to the corresponding dec. value) at [mid] P, PC, and PCR (from Figs. 2–4), for comparison. Separate datasets for P and PC, N = 10 each. Individual dots represent data from individual experiments; red bars indicate the mean value. Asterisks indicate pairwise significant differences between two groups or the group indicated with the longer line and those indicated with shorter lines (Dunn's post hoc test; p ≤ 0.05). The groups indicated with daggers are significantly different from all other groups in that panel. All other pairwise comparisons were not statistically significant. Statistical results in Table 7. Total modulator concentration for [high]: 10−6 M.

Update of

Similar articles

References

    1. Akcay Z, Huang X, Nadim F, Bose A (2018) Phase-locking and bistability in neuronal networks with synaptic depression. Physica D 364:8–21. 10.1016/j.physd.2017.09.007 - DOI - PMC - PubMed
    1. Anwar H, Martinez D, Bucher D, Nadim F (2022) Inter-animal variability in activity phase is constrained by synaptic dynamics in an oscillatory network. eNeuro 9:1–19. 10.1523/ENEURO.0027-22.2022 - DOI - PMC - PubMed
    1. Asahina K, de Bivort BL, Grunwald Kadow IC, Yapici N (2022) Editorial: revisiting behavioral variability: what it reveals about neural circuit structure and function. Front Behav Neurosci 16:1–3. 10.3389/fnbeh.2022.956388 - DOI - PMC - PubMed
    1. Atamturktur S, Nadim F (2011) Effects of neuromodulator RPCH on short-term dynamics of a key synapse in an oscillatory network of crab Cancer borealis. J Appl Biol Sci 5:59–72.
    1. Berens P (2009) Circstat: a MATLAB toolbox for circular statistics. J Stat Softw 31:1–21. 10.18637/jss.v031.i10 - DOI

LinkOut - more resources