. 2024 Aug 12;15(1):6895.
doi: 10.1038/s41467-024-51174-3.

SLC17A1/3 transporters mediate renal excretion of Lac-Phe in mice and humans

Affiliations

SLC17A1/3 transporters mediate renal excretion of Lac-Phe in mice and humans

Veronica L Li et al. Nat Commun. .

Abstract

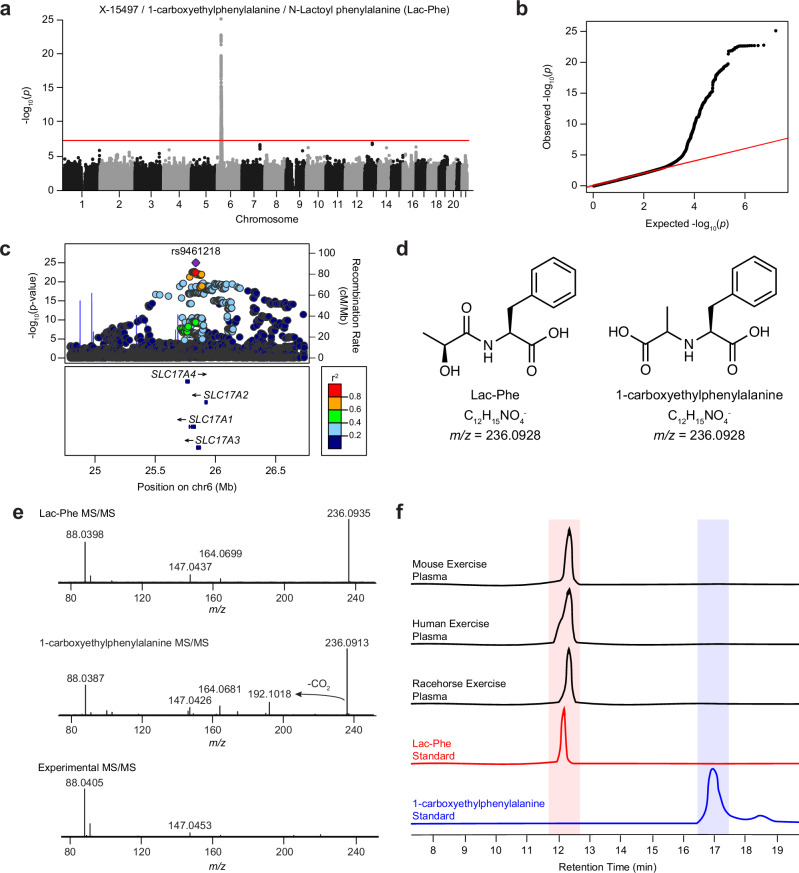
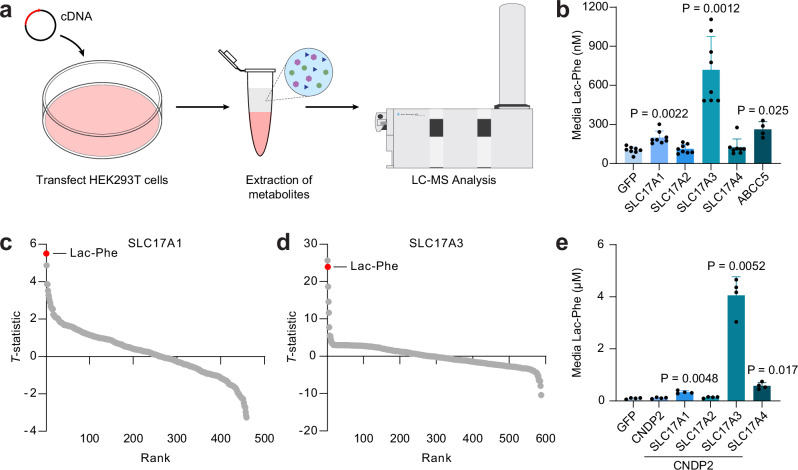
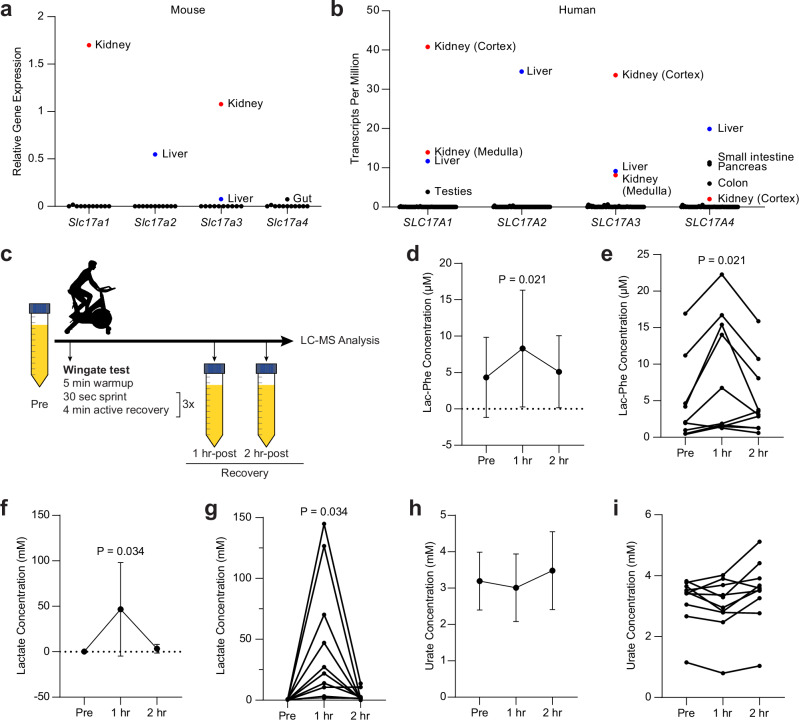
N-lactoyl-phenylalanine (Lac-Phe) is a lactate-derived metabolite that suppresses food intake and body weight. Little is known about the mechanisms that mediate Lac-Phe transport across cell membranes. Here we identify SLC17A1 and SLC17A3, two kidney-restricted plasma membrane-localized solute carriers, as physiologic urine Lac-Phe transporters. In cell culture, SLC17A1/3 exhibit high Lac-Phe efflux activity. In humans, levels of Lac-Phe in urine exhibit a strong genetic association with the SLC17A1-4 locus. Urine Lac-Phe levels are increased following a Wingate sprint test. In mice, genetic ablation of either SLC17A1 or SLC17A3 reduces urine Lac-Phe levels. Despite these differences, both knockout strains have normal blood Lac-Phe and body weights, demonstrating SLC17A1/3-dependent de-coupling of urine and plasma Lac-Phe pools. Together, these data establish SLC17A1/3 family members as the physiologic urine Lac-Phe transporters and uncover a biochemical pathway for the renal excretion of this signaling metabolite.


Conflict of interest statement

The authors declare no competing interests.

Figures

Fig. 1
Fig. 1. Structural assignment and association of X-15497/1-carboxyethylphenylalanine/Lac-Phe with the SLC17A1-4 locus in humans.
a–c Manhattan plot displaying the -log10 (P-values) by chromosomal position (a), QQ plot displaying the expected -log10 (P-values) under the null vs. observed -log10 (P-values) (b), and regional association plot of the SLC17A1-4 locus on chromosome 6 (c) of the genetic association of the urine metabolite, X-15497/1-carboxyethylphenylalanine/N-lactoyl-phenylalanine (Lac-Phe). d Chemical structure of Lac-Phe (left) and 1-carboxyethylphenylalanine (right). e Tandem mass spectrometry fragmentation of an authentic Lac-Phe standard (top), an authentic 1-carboxyethylphenylalanine standard (middle), and the experimental X-15497/1-carboxyethylphenylalanine/N-lactoyl-phenylalanine metabolite (bottom). f Extracted ion chromatograms of the endogenous m/z = 236.0928 peak in mouse, human, and racehorse plasma (black curves) along with authentic Lac-Phe (red curve) and 1-carboxyethylphenylalanine (blue curve) standards. (a-c) Results are based on linear regression and the red line in panel (a) represents the level of significance corrected for multiple testing (two-sided P-value < 5×10⁻⁸) and in panel (b) indicates the diagonal. Source Data are provided as a Source Data File.
Fig. 2
Fig. 2. Overexpression of SLC17 family members drives Lac-Phe efflux in vitro.
a Schematic of in vitro efflux assay. b Lac-Phe levels in conditioned medium of GFP or SLC17A1-4 transfected cells. T-statistic of all conditioned media peaks detected by untargeted metabolomics in GFP versus SLC17A1 (c) or SLC17A3 (d) transfected cells. e Lac-Phe levels in conditioned medium of cells co-transfected with CNDP2 and the indicated SLC17 family member or just with GFP as a control. For b, N = 8 biological replicates per group, except ABCC5 where N = 4 biological replicates per group. For ce, N = 4 biological replicates per group. Data are shown as mean ± SD. P-values in b and e were calculated by one-way ANOVA and Dunnett T3 post-hoc tests. Source Data are provided as a Source Data File.
Fig. 3
Fig. 3. Lac-Phe levels increase in human urine after sprint exercise.
mRNA expression levels of SLC17 family members across mouse (a) and human (b) tissues. Mouse data were obtained from bioGPS; human data from GTEx. c Schematic of human sprint exercise study design. Average (d, f, h) and individual (e, g, i) urine levels of the indicated metabolite before (pre) or at the indicated time point after exercise. For di, subjects were 6 male, 4 female, age 28.3 ± 5.3 (mean ± SD), N = 10 biological replicates per group. Data are shown as mean ± SD. P-values in di were calculated by one-way ANOVA with Dunnett T3 post-hoc tests. Source Data are provided as a Source Data File.
Fig. 4
Fig. 4. Reduced urine Lac-Phe levels in SLC17A1- and SLC17A3-KO mice.
a Schematic of the Slc17a1 and Slc17a3 genes on mouse chromosome 13 and the genetic modifications resulting in the SLC17A1-KO or SLC17A3-KO mouse. b mRNA levels of the indicated genes from kidneys of WT or SLC17A1-KO mice, N = 4 biological replicates per group. Urine Lac-Phe (c) or urate (d) levels from male 3 to 5 month old WT or SLC17A1-KO mice. N = 8 biological replicates in the WT group and N = 7 biological replicates in the SLC17A1-KO group. e Plasma Lac-Phe levels from 3 to 7 month old male and female WT or SLC17A1-KO mice, N = 7 biological replicates in the WT group and N = 6 biological replicates in the SLC17A1-KO group. f Urine Lac-Phe levels 30 min after a single administration of Lac-Phe (50 mg/kg, IP) to 6–9 month old male and female WT or SLC17A1-KO mice. N = 7 biological replicates in the WT group and N = 6 biological replicates in the SLC17A1-KO group. g mRNA levels of the indicated genes from kidneys of WT or SLC17A3-KO mice, N = 4 biological replicates per group. Urine Lac-Phe (h) or urate (i) levels from 1 to 3 month old male and female WT or SLC17A3-KO mice, N = 8 biological replicates in the WT group and N = 6 biological replicates in the SLC17A3-KO group. j Plasma Lac-Phe levels from 2 to 3 month old male WT or SLC17A1-KO mice, N = 11 biological replicates in the WT group and N = 12 biological replicates in the SLC17A3-KO group. k Urine Lac-Phe levels 30 min after a single administration of Lac-Phe (50 mg/kg, IP) to 6–9 month old male and female WT or SLC17A3-KO mice. N = 6 biological replicates in the WT group and N = 8 biological replicates in the SLC17A3-KO group. Data are shown as mean ± SD. P-values for b and g were calculated using multiple t-tests with a false discovery rate approach of two-stage step-up method of Benjamini, Krieger and Yekutieli. P-values for cf and hk were calculated by Student’s two-sided t test. One data point was removed from c due to an outlier based on the Grubb’s test. Source Data are provided as a Source Data File.

Update of

References

    1. Rabinowitz, J. D. & Enerbäck, S. Lactate: the ugly duckling of energy metabolism. Nat. Metab.2, 566–571 (2020). 10.1038/s42255-020-0243-4 - DOI - PMC - PubMed
    1. Brooks, G. A. Lactate as a fulcrum of metabolism. Redox Biol.35, 101454 (2020). 10.1016/j.redox.2020.101454 - DOI - PMC - PubMed
    1. Gladden, L. B. Lactate metabolism: A new paradigm for the third millennium. J. Physiol.558, 5–30 (2004). 10.1113/jphysiol.2003.058701 - DOI - PMC - PubMed
    1. Brooks, G. A. et al. Lactate as a major myokine and exerkine. Nat. Rev. Endocrinol.18, 712 (2022). 10.1038/s41574-022-00724-0 - DOI - PubMed
    1. Liu, C. et al. Lactate inhibits lipolysis in fat cells through activation of an orphan G-protein-coupled receptor, GPR81. J. Biol. Chem.284, 2811–2822 (2009). 10.1074/jbc.M806409200 - DOI - PubMed