. 2024 Aug 12;15(1):6915.
doi: 10.1038/s41467-024-51232-w.

Hypoxia-induced downregulation of PGK1 crotonylation promotes tumorigenesis by coordinating glycolysis and the TCA cycle

Affiliations

Hypoxia-induced downregulation of PGK1 crotonylation promotes tumorigenesis by coordinating glycolysis and the TCA cycle

Zihao Guo et al. Nat Commun. .

Abstract

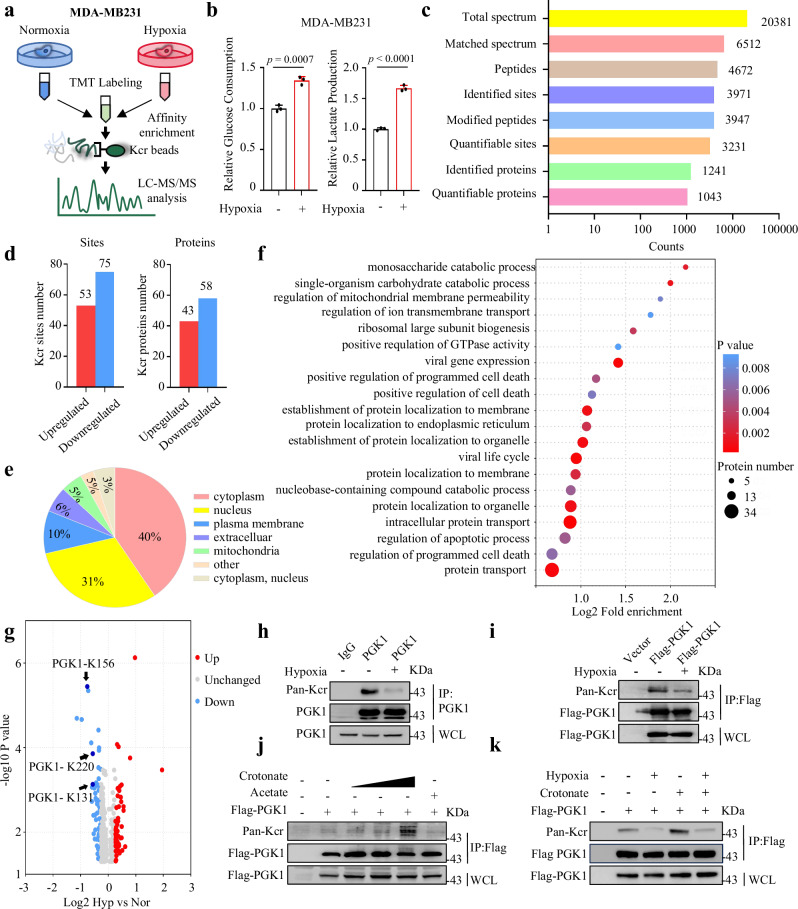
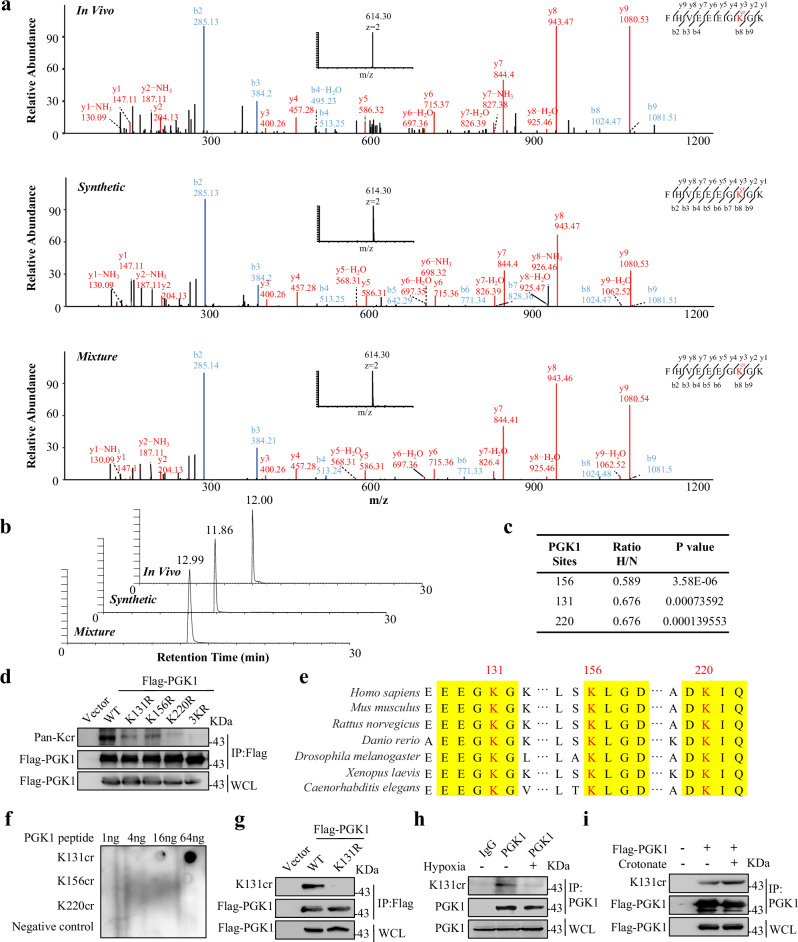
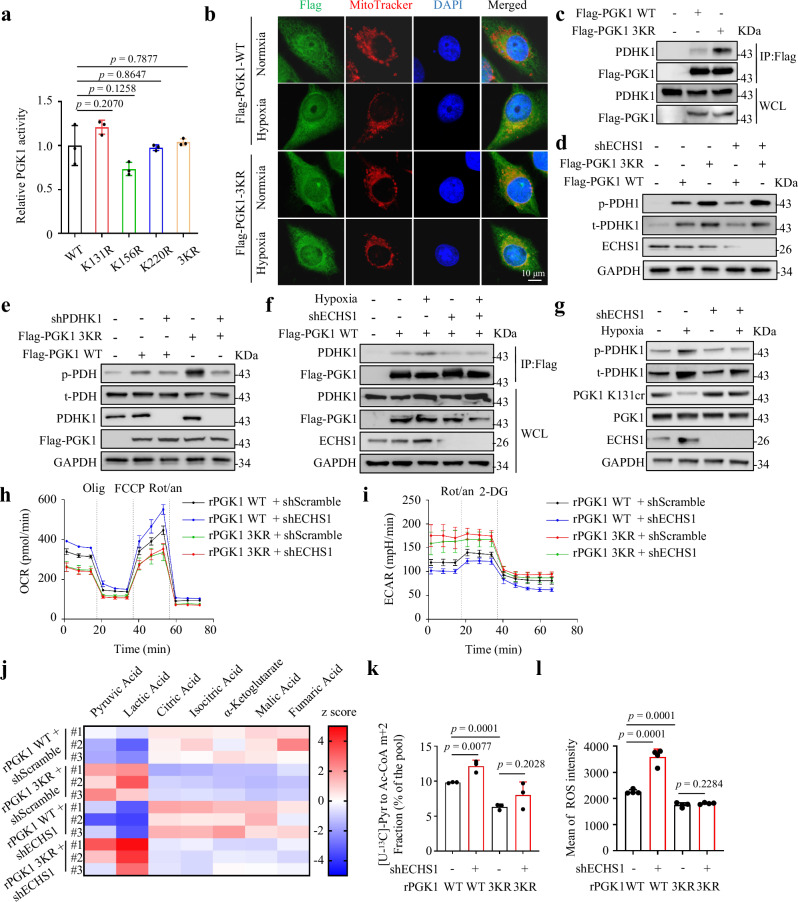
Protein post-translational modifications (PTMs) are crucial for cancer cells to adapt to hypoxia; however, the functional significance of lysine crotonylation (Kcr) in hypoxia remains unclear. Herein we report a quantitative proteomics analysis of global crotonylome under normoxia and hypoxia, and demonstrate 128 Kcr site alterations across 101 proteins in MDA-MB231 cells. Specifically, we observe a significant decrease in K131cr, K156cr and K220cr of phosphoglycerate kinase 1 (PGK1) upon hypoxia. Enoyl-CoA hydratase 1 (ECHS1) is upregulated and interacts with PGK1, leading to the downregulation of PGK1 Kcr under hypoxia. Abolishment of PGK1 Kcr promotes glycolysis and suppresses mitochondrial pyruvate metabolism by activating pyruvate dehydrogenase kinase 1 (PDHK1). A low PGK1 K131cr level is correlated with malignancy and poor prognosis of breast cancer. Our findings show that PGK1 Kcr is a signal in coordinating glycolysis and the tricarboxylic acid (TCA) cycle and may serve as a diagnostic indicator for breast cancer.


Conflict of interest statement

The authors declare no competing interests.

Figures

Fig. 1
Fig. 1. The global crotonylome reveals downregulation of PGK1 crotonylation under hypoxia.
a, b Schematic illustration of TMT quantitative proteomics workflow to determine the levels of Kcr proteins in MDA-MB231 cells cultured under normoxic or hypoxic conditions for 12 h (a). Each group had 3 biologically independent samples. The relative levels of glucose consumption and lactate production were measured to confirm the effectiveness of hypoxia treatment (b). Data are shown as the mean ± SD, n = 3 biologically independent samples (unpaired two-tailed Student’s t-test). c Column chart showing the statistical proteins, peptides and sites information of TMT quantitative proteomics results. d Identified differential Kcr sites and proteins were counted. e Pie graph showing the subcellular distribution of identified Kcr differential proteins. f KEGG pathway enrichment of identified Kcr differential proteins. The dot size and color represent the protein number and the p value (unpaired two-tailed Student’s t-test) of the corresponding pathway, respectively. g Volcano plots showing the quantification and p value (unpaired two-tailed Student’s t test) of identified differential Kcr sites. h MDA-MB231 cells were cultured under normoxia or hypoxia for 12 h and subjected to IP assays using anti-PGK1 or anti-IgG antibodies, followed by immunoblotting with pan anti-Kcr and anti-PGK1 antibodies. WCL, whole-cell lysate. i IP assays were performed with anti-Flag M2 beads using HEK293T cells expressing the Flag-tagged PGK1 cultured under normoxia or hypoxia for 12 h, followed by immunoblotting with pan anti-Kcr and anti-Flag antibodies. j HEK293T cells expressing Flag-tagged PGK1 were pretreated with 2.5, 5, or 10 mM sodium crotonate (pH 7.4) or 10 mM sodium acetate (pH 7.4) for 12 h. IP assays were performed with anti-Flag M2 beads, followed by immunoblotting with the indicated antibodies. k HEK293T cells expressing Flag-tagged PGK1 were pretreated with or without 10 mM sodium crotonate (pH 7.4) and subsequently cultured under normoxia or hypoxia for 12 h. IP assays were performed with anti-Flag M2 beads, followed by immunoblotting with the indicated antibodies. b, hk Data were verified in at least three independent experiments. Source data are provided as a Source Data file.
Fig. 2
Fig. 2. PGK1 Kcr at K131, K156, and K220 sites decrease under hypoxia.
a, b The MS/MS spectrum (a) and extracted ion chromatograms from LC-MS/MS analysis (b) of the in vivo derived PGK K131cr peptide, the synthetic standard PGK K131cr peptide, and their mixture. The b ion refers to the N-terminal parts of the peptide, and the y ion refers to the C-terminal parts of the peptide. c The ratio and p value (unpaired two-tailed Student’s t test) of PGK1 Kcr on different sites under hypoxia versus normoxia. d IP assays were performed with anti-Flag M2 beads using HEK293T cells expressing Flag-tagged PGK1 WT, K131R, K156R, K220R, or 3KR, followed by immunoblotting with pan anti-Kcr and anti-Flag antibodies. e Sequence alignment of the PGK1 amino acid residues across various species. f Dot blot assays were performed to verify the specificity of PGK1 K131cr antibody against PGK1 K131cr, K156cr, and K220cr. g IP assays were performed with anti-Flag M2 beads using HEK293T cells expressing Flag-tagged PGK1 K131R, followed by immunoblotting with the specific antibody against PGK1 K131cr. h MDA-MB231 cells were cultured under the stimulation of normoxia or hypoxia for 12 h and subjected to IP assays using anti-PGK1 or anti-IgG antibodies, followed by immunoblotting with the specific antibody against PGK1 K131cr. i MDA-MB231 cells were incubated with or without 10 mM sodium crotonate (pH 7.4) and subjected to IP assays using the indicated antibodies, followed by immunoblotting with the specific antibody against PGK1 K131cr. d, fi Data were verified in at least three independent experiments. Source data are provided as a Source Data file.
Fig. 3
Fig. 3. ECHS1 mediates the downregulation of PGK1 crotonylation under hypoxia.
a IP assays were performed using HEK293T cells expressing Flag-tagged PGK1, followed by silver staining. b Co-IP assays were performed using HEK293T cells expressing Flag-tagged PGK1. c MDA-MB231 cells were subjected to the Co-IP assays using indicated antibodies. d GST pull-down assays were performed using GST-tagged PGK1, His-tagged ECHS1 or GST proteins. e Co-IP assays were performed using HEK293T cells expressing Flag-tagged PGK1 WT or 3KR. f HEK293T cells were transfected with Flag-tagged PGK1 WT or MUT and subjected to IP assays. g IP assays were performed using HEK293T cells co-expressing Flag-tagged PGK1 WT or 3KR with HA-tagged ECHS1. h MDA-MB231 cells were cultured under normoxia or hypoxia for 12 h and subjected to IP assays. i Immunofluorescence assays were performed using MDA-MB231 cells under normoxia or hypoxia for 12 h. Co-localization was quantified using Pearson’s correlation coefficients. j ECHS1 was detected in MDA-MB231 cells under normoxia or hypoxia for 12 h. k ECHS1 was detected in MDA-MB231 cells expressing scramble or shHIF-1α under normoxia or hypoxia. l ECHS1 mRNA was detected by qPCR in MDA-MB231 cells with or without HIF-1α depletion under normoxia or hypoxia for 12 h. m Agarose-gel-electrophoresis was performed after CUT&Tag assays using HIF-1α antibody in MDA-MB231 cells. The locations of positive #1 and negative #2 primers are shown. n CUT&Tag qPCR assays were performed in MDA-MB231 cells under hypoxia for 12 h using an anti-HIF-1α antibody. o MDA-MB231 cells with or without ECHS1 depletion were cultured under normoxia or hypoxia for 12 h. The levels of crotonyl-CoA in cytosolic and mitochondrial fractions were analyzed by LC-MS/MS. p MDA-MB231 cells were cultured under normoxia or hypoxia for 12 h, followed by fractionation assays. q HEK293T cells with or without ECHS1 depletion were transfected with Flag-tagged PGK1 and subjected to IP assays. In i, l, n, o, data are shown as the mean ± SD, n = 3 (l, n, o) or 6 (i) biologically independent samples (unpaired two-tailed Student’s t test). All experimental data were verified in at least three independent experiments. Source data are provided as a Source Data file.
Fig. 4
Fig. 4. PCAF is the crotonyltransferase of PGK1 Kcr.
a Co-IP assays were performed with anti-Flag M2 beads using HEK293T cells transfected with Flag-tagged PGK1 and HA-tagged HATs, followed by immunoblotting with the indicated antibodies. b Co-IP assays were performed with anti-Flag M2 beads using HEK293T cells transfected with HA-tagged PGK1 and Flag-tagged HDACs, followed by immunoblotting with the indicated antibodies. c Co-IP assays were performed with anti-Flag M2 beads using HEK293T cells expressing Flag-tagged PGK1, followed by immunoblotting with anti-PCAF and anti-Flag antibodies. d MDA-MB231 cells were subjected to IP assays using anti-PGK1 or anti-IgG antibodies, followed by immunoblotting with anti-PCAF and anti-PGK1 antibodies. e GST pull-down assays were performed by mixing purified recombinant GST-tagged PGK1 and HA-tagged PCAF proteins, followed by immunoblotting with the indicated antibodies. f In vitro Kcr assays with 5 μg recombinant GST-tagged PGK1, 50 μM crotonyl-CoA, and different concentrations of HA-tagged PCAF. The reaction mixtures were analyzed by immunoblotting with the indicated antibodies. g IP assays were performed with anti-Flag M2 beads using HEK293T cells expressing the indicated plasmids, followed by immunoblotting with pan anti-Kcr, anti-Flag and anti-HA antibodies. h MDA-MB231 cells treated with or without hypoxia were subjected to Co- IP assays using anti-PGK1 or anti-IgG antibodies, followed by immunoblotting with anti-PCAF and anti-PGK1 antibodies. i MDA-MB231 cells were cultured under normoxia or hypoxia for 12 h, followed by cell fractionation assays. Immunoblotting was performed to detect the indicated proteins. All experimental data were verified in at least three independent experiments. Source data are provided as a Source Data file.
Fig. 5
Fig. 5. PGK1 crotonylation is indispensable for coordinating mitochondrial pyruvate metabolism and glycolysis.
a The enzymatic activity of Flag-tagged PGK1 WT, K131R, K156R, K220R, or 3KR purified from HEK293T cells were measured. b MDA-MB231 cells expressing Flag-tagged PGK1 WT or 3KR were stimulated with or without hypoxia for 12 h and stained with anti-Flag antibody and Mito-Tracker. Nuclei were stained with DAPI. c Co-IP assays were performed using HEK293T cells transfected with Flag-tagged PGK1 WT or 3KR. d PDHK1 and PDH phosphorylation was detected by immunoblotting in PGK1-deleted MDA-MB231 cells expressing sgRNA-resistant PGK1 (rPGK1) WT or 3KR, with or without shRNA targeting ECHS1. e PDH phosphorylation was detected by immunoblotting in PGK1-deleted MDA-MB231 cells expressing sgRNA-resistant PGK1 (rPGK1) WT or 3KR, with or without PDHK1 depletion. f MDA-MB231 cells with or without ECHS1 depletion were transfected with Flag-tagged PGK1 and cultured under normoxia or hypoxia for 12 h, followed by Co-IP assays. g MDA-MB231 cells with or without ECHS1 depletion were cultured under normoxia or hypoxia for 12 h, followed by immunoblotting with the indicated antibodies. h, i The oxygen consumption rate (OCR, h) and the extracellular acidification rate (ECAR, i) in MDA-MB231 cells with endogenous PGK1 deletion and reconstituted expression of rPGK1 WT or rPGK1 3KR, with or without ECHS1 depletion. j Heat map showing the differential metabolites between MDA-MB231/rPGK1 WT cells and MDA-MB231/rPGK1 3KR cells with or without ECHS1 depletion. Each group had 3 biologically independent samples. k The relative levels of [U-13C3]-Pyruvate derived m + 2 acetyl-CoA in MDA-MB231/rPGK1 WT cells and MDA-MB231/rPGK1 3KR cells with or without ECHS1 depletion. l The levels of mitochondrial ROS were measured using a 2’,7’-dichlorodihydrofluorescein diacetate (DCFH-DA) probe. a, hl Data are shown as the mean ± SD, n = 3 (a, j, k) or 4 (h, i, l) biologically independent samples (unpaired two-tailed Student’s t test). All experimental data were verified in at least two ( j, k) or three (ai, l) independent experiments. Source data are provided as a Source Data file.
Fig. 6
Fig. 6. Downregulation of PGK1 crotonylation promotes cell proliferation and tumorigenesis.
a Reconstituted expression of the rPGK1 WT or 3KR proteins was performed in endogenous PGK1-deleted MDA-MB231 cells. The expression of PGK1 was detected by immunoblotting. b, c The colony formation of MDA-MB231 cells with or without PGK1 deletion and with or without reconstituted expression of rPGK1 WT or 3KR. The images (b) and counted colony numbers (c) of indicated groups were shown. d Cell proliferation of MDA-MB231 cells with or without PGK1 deletion and with or without reconstituted expression of rPGK1 WT or 3KR. e, f Cell invasion ability of MDA-MB231 cells with or without PGK1 deletion and with or without reconstituted expression of rPGK1 WT or 3KR. The images (e) and counted invasive cell numbers (f) of indicated groups were shown. g, h Cell migration of MDA-MB231 cells with or without PGK1 deletion and with or without reconstituted expression of rPGK1 WT or 3KR. The images (g) and relative migration distance(h), were shown. i, j MDA-MB231 cells with or without PGK1 deletion and with or without reconstituted expression of rPGK1 WT or 3KR were subcutaneously injected into nude mice. Tumor volume (i) and tumor formation (j) were measured. k PDHK1 and PGK1 expression in MDA-MB231/rPGK1 WT cells, MDA-MB231/rPGK1 3KR cells with or without PDHK1 depletion. l Cell proliferation of MDA-MB231/rPGK1 WT cells, MDA-MB231/rPGK1 3KR cells with or without PDHK1 depletion. mo MDA-MB231/rPGK1 WT cells, MDA-MB231/rPGK1 3KR cells with or without PDHK1 depletion were subcutaneously injected into nude mice. Tumor formation (m), tumor volume (n), and tumor weight (o) were measured. In c, d, f, h, i, l, n, o, data are shown as the mean ± SD, n = 3 (c, d, f, h, l) or 6 (i, n, o) biologically independent samples. P values were obtained using unpaired two-tailed Student’s t test (c, f, h, i, n, o) or two-way ANOVA with Sidak test (d, l). Data were verified in at least two (i, j, mo) or three (ah, k, l) independent experiments. Source data are provided as a Source Data file.
Fig. 7
Fig. 7. Low K131 crotonylation of PGK1 indicates a poor prognosis in breast cancer patients.
ag IHC staining (a) and the quantitative results (bg) of PGK1 K131cr, PGK1, ECHS1, p-PDHK1, t-PDHK1 and HIF-1α expression in the normal breast tissues from wild-type (FVB) mice and tumor tissues from the MMTV-PyMT mice with early (week 7) or late (week 18) stages of spontaneous breast cancer. Data are shown as the mean ± SD, n = 6 biologically independent samples (unpaired two-tailed Student’s t test). h Expression of PGK1 K131cr, PGK1 and ECHS1 were detected by immunoblotting in samples from the adjacent normal breast tissues (N) and breast tumor tissues (T) using the indicated antibodies. i, j IHC staining (i) and the quantitative results ( j) of PGK1 K131cr expression in samples from adjacent normal breast tissues and breast tumor tissues. Data are shown as the mean ± SD, n (N) = 6 and n (T) = 15 biologically independent samples (unpaired two-tailed Student’s t test). k Kaplan–Meier survival curve showing the overall survival of breast cancer patients according to the levels of PGK1 K131cr expression detected by IHC staining. n (high, 3–4 staining degree) = 70, n (low, 0–2 staining degree) = 59 (log-rank). l PGK1 K131cr expression in breast tumor tissues from patients at different grades (left) or from patients with different lymph node-positive rates (right). m IHC staining of ECHS1 in samples from adjacent normal breast and breast tumor tissues. n Kaplan–Meier survival curve depicting the overall survival of breast cancer patients based on ECHS1 expression in the TCGA cohort. n (high) = 749, n (low) = 287 (log-rank). Source data are provided as a Source Data file.

References

    1. Keenan, E. K., Zachman, D. K. & Hirschey, M. D. Discovering the landscape of protein modifications. Mol. Cell81, 1868–1878 (2021). 10.1016/j.molcel.2021.03.015 - DOI - PMC - PubMed
    1. Hitosugi, T. & Chen, J. Post-translational modifications and the Warburg effect. Oncogene33, 4279–4285 (2014). 10.1038/onc.2013.406 - DOI - PubMed
    1. Deribe, Y. L., Pawson, T. & Dikic, I. Post-translational modifications in signal integration. Nat. Struct. Mol. Biol.17, 666–672 (2010). 10.1038/nsmb.1842 - DOI - PubMed
    1. Choudhary, C., Weinert, B. T., Nishida, Y., Verdin, E. & Mann, M. The growing landscape of lysine acetylation links metabolism and cell signalling. Nat. Rev. Mol. Cell Biol.15, 536–550 (2014). 10.1038/nrm3841 - DOI - PubMed
    1. Swatek, K. N. & Komander, D. Ubiquitin modifications. Cell Res.26, 399–422 (2016). 10.1038/cr.2016.39 - DOI - PMC - PubMed

MeSH terms

Substances

LinkOut - more resources