. 2024 Aug 13;15(1):6923.
doi: 10.1038/s41467-024-51236-6.

Sculpting the tumour microenvironment by combining radiotherapy and ATR inhibition for curative-intent adjuvant immunotherapy

Affiliations

Sculpting the tumour microenvironment by combining radiotherapy and ATR inhibition for curative-intent adjuvant immunotherapy

Emmanuel C Patin et al. Nat Commun. .

Abstract

The combination of radiotherapy/chemoradiotherapy and immune checkpoint blockade can result in poor outcomes in patients with locally advanced head and neck squamous cell carcinoma (HNSCC). Here, we show that combining ATR inhibition (ATRi) with radiotherapy (RT) increases the frequency of activated NKG2A+PD-1+ T cells in animal models of HNSCC. Compared with the ATRi/RT treatment regimen alone, the addition of simultaneous NKG2A and PD-L1 blockade to ATRi/RT, in the adjuvant, post-radiotherapy setting induces a robust antitumour response driven by higher infiltration and activation of cytotoxic T cells in the tumour microenvironment. The efficacy of this combination relies on CD40/CD40L costimulation and infiltration of activated, proliferating memory CD8+ and CD4+ T cells with persistent or new T cell receptor (TCR) signalling, respectively. We also observe increased richness in the TCR repertoire and emergence of numerous and large TCR clonotypes that cluster based on antigen specificity in response to NKG2A/PD-L1/ATRi/RT. Collectively, our data point towards potential combination approaches for the treatment of HNSCC.


Conflict of interest statement

E.C. and S.A.S. are employees and stockholders of AstraZeneca. The remaining authors declare no competing interests.

Figures

Fig. 1
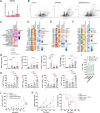
Fig. 1. Highly activated NKG2A and PD-1 double-positive T cells are detected in patients with head and neck cancer.
A TCGA database analyses of the correlation between expression of KLRC1 and both PDCD1 and CD274 in both HPV- and HPV+ HNSCC patients. The blue line and the shaded area indicate the linear regression fit with the 95% confidence interval; two-tailed test p-values are provided for Spearman’s rank correlation coefficients. B Scatter plots showing expression of KLRC1 and PDCD1 in various cell populations (higher panel) and tumours versus blood (lower panels). C UMAP plot showing distribution of identified cell clusters distribution. D Left panel; UMAP plot depicting NKG2A/PD-1 double positive cells in the different identified cell clusters, right panel; UMAP plot depicting intensity expression of NKG2A/PD-1 double positive cells with absolute numbers for each identified cell populations (right table). Dot plots showing average and percentage expression of the KLRC1, PDCD1 and pan-cell markers (E) and activation/effector, co-activation, inhibitory, memory, cell cycle and transcription factors (TFs) markers (F) in NKG2A+/PD-1+ CD8+ T cells versus CD8+T, CD4+T, Tregs and NK cells. Datasets from Kurten et al..
Fig. 2
Fig. 2. NKG2A and PD-1/PD-L1 axis immune checkpoint blockade improves the therapeutic outcome of ATRi/RT.
Experiments in this figure were performed in the MOC1 model. A Tumour growth and survival curves across the different conditions (Control n = 10, ATRi n = 11, RT n = 11, ATRi/RT n = 11; combined from two independent experiments). B Bar chart; % of NKG2A and/or PD-1 positive populations in CD8 and CD4conv T cells, scatter plot with bar; NKG2A/PD-1 positive populations in CD8 and CD4conv T cells (Control n = 8, ATRi/RT n = 12; combined from two independent experiments). C Heatmap showing marker intensity of expression in NKG2A+/PD-1+ versus NKG2A/PD-1 CD8 and CD4conv T cells. D % surface expression of Qa-1b/PD-L1 double positive cancer cells in the different conditions (Control n = 8, ATRi/RT n = 8; from one experiment). Tumour growth and survival curves across the different conditions in ectopic (E; control n = 17, αNKG2A/αPD-L1 n = 17, ATRi/RT n = 16, ATRi/RT/αPD-L1 n = 12, ATRi/RT/αNKG2A/αPD-L1 n = 17; combined from three independent experiments) and orthotopic (F; Control n = 8, αNKG2A/αPD-L1 n = 5, ATRi/RT n = 10, ATRi/RT/αPD-L1 n = 6, ATRi/RT/αNKG2A/αPD-L1 n = 12; combined from two independent experiments). G Tumour growth in control versus rechallenged mice (Rechallenge n = 5, Control n = 6; from one experiment). Results are shown as means ± SEM and n represents number of mouse/groups. Parametric statistics were only applied to normally distributed data. Numbers on graphs represent P values and were determined by Two-tailed Unpaired t test (A, CD4conv T cells and D), Two-tailed Mann–Whitney test (A, CD8 T cells) and Log-Rank Mantel–Cox test (C, E, F).
Fig. 3
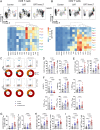
Fig. 3. ATRi/RT and anti-NKG2A/PD-L1 immunotherapy trigger a potent T-cell antitumour immune response.
Experiments presented in this figure were performed in the MOC1 model. RNAseq experiments were performed with n = 4 for each group (A) Number of differentially expressed genes (DEGs) across the different conditions calculated by DESeq2 using Wald test. B Volcano plots showing expression of the different genes in the various conditions (genes characteristic of an immune response are named). C Immune cell population estimates. Immune cell scoring was performed on normalised RNAseq counts using the mMCP-counter package. Heatmaps corresponding to interferon and cytokine signalling, chemoattractant, MHCI and MHCII (D); immune cell populations (E); and immune cell activation status (F). Data shown are z-scores of log2 transformed normalised counts for the treatment conditions shown. This plotted alongside log10 adjusted p-value for each gene calculated from DEG analysis using Wald test. Non-significant adjusted p-values > 0.05 are indicated as grey. G Absolute number/gram of tumour of the indicated lymphocytes in the various conditions (Control n = 8, ImmuT n = 7, ATRi/RT n = 12, ATRi/RT/ImmuT n = 12; combined from two independent experiments). H % Ki67-positive cells in the indicated lymphocytes in the different conditions (Control n = 8, ImmuT n = 7, ATRi/RT n = 12, ATRi/RT/ImmuT n = 12; combined from two independent experiments). I % indicated lymphocytes in the total T cell population across all treatment conditions (Control n = 8, ImmuT n = 7, ATRi/RT n = 12, ATRi/RT/ImmuT n = 12; combined from two independent experiments). J Tumour growth curves across all conditions (Control n = 5, ATRi/RT/ImmuT n = 6, ATRi/RT/ImmuT/aNK1.1 n = 5, ATRi/RT/ImmuT/aCD8 n = 6; from one experiment). K Tumour growth and survival curves across the different conditions (Control n = 5, ATRi/RT/ImmuT n = 5, ATRi/RT/ImmuT/aCD8 n = 5, ATRi/RT/ImmuT/aCD4/CD8 n = 6; from one experiment). Results are shown as means ± SEM and n represents number of mouse/groups. Parametric statistics were only applied to normally distributed data. Numbers on graphs represent P values and were determined by Kruskal–Wallis test with Dunn’s multiple comparison test (G; CD8 T cells, CD4reg T cells and NK cells; H; CD8 T cells, CD4reg T cells and NK cells), ordinary one-way ANOVA with Tukey’s multiple comparison test (G; CD4conv T cells and H; CD4conv T cells), Kruskal–Wallis test with Dunn’s multiple comparison test from area under curve (J) and Log-Rank Mantel–Cox test (K). Significant outliers were removed using Grubb’s test.
Fig. 4
Fig. 4. ATRi/RT and anti-NKG2A/PD-L1 immunotherapy induce the proliferation of PD-1+ effector memory cytotoxic CD8 and CD4 T-cells in the tumour microenvironment.
Experiments presented in this figure were performed in the MOC1 model. A, B Higher panels; intensity of the different subpopulation clusters of CD8 (A) and CD4 (B) T cells identified using TriMap and FlowSOM algorithms, lower panels; heatmap showing the expression of the indicated markers in the different populations identified by FlowSOM algorithm across all treatment conditions (concatenated from Control n = 7, ATRi/RT n = 8, ATRi/RT/ImmuT n = 8; from one experiment). C Dot plot and donut chart representing % of CD8 and CD4conv T cells in the different cell cycle phases across all conditions (concatenated from Control n = 5, ATRi/RT n = 6, ATRi/RT/ImmuT n = 6; from one experiment). Across all conditions the following graphs show % (D) PD-1+, (E) ICOS+, (F) naïve (N; CD62L+ CD44-), effector (EM; CD62L- CD44+ CD103-) and tissue-resident (TRM; CD62L- CD44+ CD103+) memory, (G) Ki67/PRF+ EM, (H) NKG2D+ and (I) T-BET+ CD8 and CD4conv T cells (Control n = 15, ATRi/RT n = 17, ATRi/RT n = 17; combined from two independent experiments). Results are shown as means ± SEM and n represents number of mouse/groups. Parametric statistics were only applied to normally distributed data. Numbers on graphs represent P values and were determined by Kruskal-Wallis test with Dunn’s multiple comparison test (E; CD8 T cells; F; CD8 TN, CD4conv TN, CD8 TEM, CD4conv TTRM; G; CD8 T cells) or ordinary one-way ANOVA with Tukey’s multiple comparison test (E; CD4conv T cells, F; CD4conv TEM, CD8 TTRM; G; CD4conv T cells; H, I).
Fig. 5
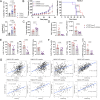
Fig. 5. CD40 signalling mediates the efficacy of ATRi/RT and immunotherapy combination.
Experiments presented in this figure were performed in the MOC1 model. A % of PD-1/CD40L double positive CD8 and CD4conv T cells across indicated treatment conditions (Control n = 10, ATRi/RT n = 12, ATRi/RT/ImmuT n = 15; combined from three independent experiments). B Tumour growth and survival curves across the different conditions (n = 5 for each group; from one experiment). C Tumour weight collected from mice in the indicated conditions (n = 10 for each group; from one experiment). D Absolute number/gram of tumour tissue of CD8 and CD4conv T cells in the various conditions (n = 10 for each group; from one experiment). % PD-1+, Ki67+ and PRF/NKG2D+ CD8 (E) and CD4conv (F) T cells in treatment conditions (n = 10 for each group; from one experiment). G TCGA database analyses of the correlation between expression of KLRC1 and PDCD1 with CD40 and CD40LG in both HPV- and HPV+ HNSCC patients. The blue line and the shaded area indicate the linear regression fit with the 95% confidence interval; two-tailed test p-values are provided for Spearman’s rank correlation coefficients. Results are shown as means ± SEM and n represents number of mouse/groups. Parametric statistics were only applied to normally distributed data. Numbers on graphs represent P values and for in vivo experiments were determined by ordinary one-way ANOVA with Tukey’s multiple comparison test (A); Log-Rank Mantel–Cox test (B) and Two-tailed Unpaired t test (CF). Significant outliers were removed using Grubb’s test.
Fig. 6
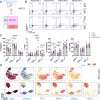
Fig. 6. RT, DDRi and anti-NKG2A/PD-L1 immunotherapy modulate the dynamics of TCR activity in both CD8 and CD4 T cells.
Experiments presented in this figure were performed in the MOC1 model. A Higher panel; schematic explaining production and decay of the Timer protein; lower panel: gating strategy for the detection of the different Timer populations, negative, new, persistent and arrested. B Dot plots showing the % of the different Timer population in NKG2A-/PD-1-, NKG2A+/PD-1-, NKG2A-/PD-1+ and NKG2A+/PD-1+ CD8 and CD4conv T cells (concatenated n = 6; from one experiment). C % of the indicated Timer population in CD8, CD4conv and CD4reg T cells across all conditions (Control n = 10, ATRi/RT n = 12, ATRi/RT/ImmuT n = 15; combined from three independent experiments). D UMAP plot showing Tocky angle and expression intensity as well as indicated markers expression intensity (concatenated from n = 14, independent of condition from one experiment). Results are shown as means ± SEM and n represents number of mouse/groups. Parametric statistics were only applied to normally distributed data. Numbers on graphs represent P values and were determined by two-way ANOVA with Tukey’s multiple comparison test (C). Significant outliers were removed using Grubb’s test.
Fig. 7
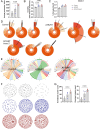
Fig. 7. Variations in tumour TCR repertoire following ATR/RT and anti-NKG2A/PD-L1 immunotherapy.
One single experiment was performed with n = 3 for each group in the MOC1 model. A Absolute number of unique productive clonotypes across the different conditions. B Clonality (Gini Simpson coefficient) across different conditions. C Comparison of the proportion (in percentage) of the TCR repertoire occupied by the first quantile of clonotypes. D Clonality plots for each condition. The plots present 3 layers to visualise the TCR repertoire clonality: the first layer includes the frequency of singleton (“1”, met once), doubleton (“2”, met twice) and high-order (“3+”, met three or more times) clonotypes; the second layer (“quintile”), displays the abundance of top 20% (“Q1”), next 20% (“Q2”), … (up to “Q5”) clonotypes for clonotypes from “3+” set; and the last layer (“top”) displays the individual abundances of top 5 clonotypes. E Representative of V–J junctions by circus plot for each condition. Arcs correspond to different V and J segments, scaled to their frequency in samples and ribbons represent V–J pairings and their size is scaled to their pairing frequency. F Network diagrams of CDR3B amino acid triplet clusters for each condition. Clusters containing expanded CDR3s are shown. G Comparison of normalised cluster count and dominant cluster count for each condition. Results are shown as means ± SEM and n represents number of mouse/groups. Parametric statistics were only applied to normally distributed data. Numbers on graphs represent P values and were determined by ordinary one-way ANOVA with Tukey’s multiple comparison test (AC, G).

References

    1. Burtness, B. et al. Pembrolizumab alone or with chemotherapy versus cetuximab with chemotherapy for recurrent or metastatic squamous cell carcinoma of the head and neck (KEYNOTE-048): a randomised, open-label, phase 3 study. Lancet394, 1915–1928 (2019). - PubMed
    1. Cohen, E. E. W. et al. Pembrolizumab versus methotrexate, docetaxel, or cetuximab for recurrent or metastatic head-and-neck squamous cell carcinoma (KEYNOTE-040): a randomised, open-label, phase 3 study. Lancet393, 156–167 (2019). - PubMed
    1. Ferris, R. L. et al. Phase II trial of post-operative radiotherapy with concurrent cisplatin plus panitumumab in patients with high-risk, resected head and neck cancer. Ann. Oncol.27, 2257–2262 (2016). - PMC - PubMed
    1. Lee, N. Y. et al. Avelumab plus standard-of-care chemoradiotherapy versus chemoradiotherapy alone in patients with locally advanced squamous cell carcinoma of the head and neck: a randomised, double-blind, placebo-controlled, multicentre, phase 3 trial. Lancet Oncol.22, 450–462 (2021). - PubMed
    1. Tao, Y. et al. Pembrolizumab versus cetuximab concurrent with radiotherapy in patients with locally advanced squamous cell carcinoma of head and neck unfit for cisplatin (GORTEC 2015-01 PembroRad): a multicenter, randomized, phase II trial. Ann Oncol.34, 101–110 (2023). - PubMed

MeSH terms

Substances