. 2024 Aug 12;15(1):6914.
doi: 10.1038/s41467-024-51109-y.

Defective mitochondrial COX1 translation due to loss of COX14 function triggers ROS-induced inflammation in mouse liver

Affiliations

Defective mitochondrial COX1 translation due to loss of COX14 function triggers ROS-induced inflammation in mouse liver

Abhishek Aich et al. Nat Commun. .

Abstract

Mitochondrial oxidative phosphorylation (OXPHOS) fuels cellular ATP demands. OXPHOS defects lead to severe human disorders with unexplained tissue specific pathologies. Mitochondrial gene expression is essential for OXPHOS biogenesis since core subunits of the complexes are mitochondrial-encoded. COX14 is required for translation of COX1, the central mitochondrial-encoded subunit of complex IV. Here we describe a COX14 mutant mouse corresponding to a patient with complex IV deficiency. COX14M19I mice display broad tissue-specific pathologies. A hallmark phenotype is severe liver inflammation linked to release of mitochondrial RNA into the cytosol sensed by RIG-1 pathway. We find that mitochondrial RNA release is triggered by increased reactive oxygen species production in the deficiency of complex IV. Additionally, we describe a COA3Y72C mouse, affected in an assembly factor that cooperates with COX14 in early COX1 biogenesis, which displays a similar yet milder inflammatory phenotype. Our study provides insight into a link between defective mitochondrial gene expression and tissue-specific inflammation.


Conflict of interest statement

A.C. is now an employee of Dewpoint Therapeutics GmbH. C.L. is now an employee of BioNTech. The other authors declare no competing interests.

Figures
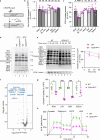
Fig. 1
Fig. 1. COX14M19I mice display reduced complex IV amounts.
a Cartoon depicting the generation of COX14M19I mouse using CRISPR/CAS9 mediated double stranded cut in Cox14 allele and subsequent single stranded Oligonucleotide DNA (ssODN) mediated repair. b Expression of Cox14 mRNA in indicated tissues of 35-week-old COX14M19I mice compared to wild-type (WT). Means ± SEM, n = 3, unpaired t test, ns = non-significant. c Western blot analysis and quantification of relative amounts of COX14 protein in indicated tissues from 22-week-old COX14M19I mice (Supplementary Fig. 1b). Presented relative COX14 amount as percent of WT after normalization to RIESKE. Means ± SEM, n = 4, unpaired t test, Brain p = 0.0175; Liver p < 0.0001; Muscle p = 0.0242; Kidney p = 0.0393. d [35S] methionine labeling of mitochondrial translation products in isolated brain mitochondria from WT and COX14M19I mice. Samples were analyzed by SDS-PAGE and digital autoradiography The figure is representative of n = 3. e Mitochondrial translation products pulse labeled with [35S] methionine for 1 h in WT and COX14M19I mice brain mitochondria and chased with non-radioactive methionine for indicated times. Samples were analyzed by SDS-PAGE and digital autoradiography. Quantification of COX1 presented. Means ± SEM, n = 3. f Volcano plot of mass spectrometric analysis of mitochondrial proteomes from WT and COX14M19I mice liver mitochondria, n = 4. g Measurement of cytochrome c oxidase activity from indicated tissues of 12-week-old WT and COX14M19I mice plotted as percentage of the average of WT. Means ± SEM, n = 5, One-way ANOVA, Brain p = 0.0312; Liver p < 0.0001; Heart p < 0.0001; Muscle p = 0.0405. h Real-time respirometry analysis of 35-week-old WT and COX14M19I mice liver mitochondria; oxygen consumption rates, OCR. Means ± SEM, n = 3. Source data are provided as a Source Data file.
Fig. 2
Fig. 2. Pathophysiology of COX14M19I mice.
a Body weights of wild-type (WT) and COX14M19I mice at 30 weeks of age. Means ± SD, n = 12, One-way ANOVA, ns non-significant, WT females vs. WT males p < 0.0001; COX14 M19I females vs. COX14 M19I males p < 0.0001; WT males vs. COX14 M19I males p = 0.0305. b Survival curve of WT and COX14M19I female mice. c Serum biochemical parameters for 16-week-old COX14M19I mice compared to WT mice, n = 8, Unpaired t test. d Heatmap depicting steady state immune cell populations from WT and COX14M19I mice spleen showing differences in ones with p-value < 0.05; One-way ANOVA; n = 6. e Representative H&E-stained sections from heart, skeletal muscle, liver and eye of COX14M19I mice. Scale bar 200 μm. The figure is representative of n = 8. f Representative fundus images from WT and COX14M19I eyes. Scale bar 400 μm. The figure is representative of n = 8. g Retina thickness WT and COX14M19I eyes at indicated age determined by Optical Coherence Tomography. Means ± SD, n = 24, One-way ANOVA, 5 weeks p = 0.0005; 15 weeks p < 0.0001; 30 weeks p < 0.0001. h Echocardiography (left panel, left ventricle anterior wall thickness; right panel, ejection fraction) of WT and COX14M19I mice. Means ± SD, n = 12, One-way ANOVA, ns=non-significant, left panel: WT females vs. COX14 M19I females p < 0.0001; WT males vs. COX14 M19I males p = 0.0018; right panel: WT females vs. COX14 M19I females p < 0.0001; COX14 M19I females vs. COX14 M19I males p = 0.0134. Source data are provided as a Source Data file.
Fig. 3
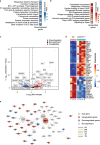
Fig. 3. Altered gene expression in COX14M19I mice.
a Over-representation analysis of genes significantly downregulated in COX14M19I samples and b over-representation analysis of genes significantly upregulated in COX14M19I samples. For both (c) and (d): Functional pathways were derived from the Reactome database, and statistically significant over-represented (enriched) pathways were determined with a cutoff of FDR < 0.05 (Benjamini–Hochberg procedure). Pathways are arranged in increasing order of FDR values from top to bottom, and the colour indicates the enrichment ratio. c Volcano plot presentation of differentially expressed genes between liver samples from WT and COX14M19I mice. X-axis denotes fold change in expression (log2 scale), y-axis denotes adjusted p-value (negative log10 scale) for the analysed genes in the data set (each dot represents a single gene). Blue and red dots represent genes significantly downregulated and upregulated respectively in the COX14 mutant samples compared to WT (DESeq2; cut-offs used: adjusted p-value < 0.05 and absolute value of fold change <1.15). Non-significant genes are depicted in black. Selected genes involved in pathways relevant for the study are labelled in the plot. d Heatmap representing normalized expression (centered and scaled) for genes labelled in A in WT and COX14M19I liver samples. e Irf7 interaction network, with first degree (direct) and second degree (neighbours of direct) connections of Irf7. (Green node: hub gene (Irf7); red nodes: genes upregulated genes in COX14M19I samples; blue nodes: genes upregulated genes in COX14M19I samples; grey nodes: interactors in the network which are not significantly up- or downregulated.) The different kinds of (directed) interactions considered were: protein-protein (PP), RNA-RNA (RR), transcription factor-protein (TP), transcription factor-RNA (TR) and RNA-transcription factor (RT) interactions. The size of the nodes denotes the degree (number of outgoing + incoming interactions).
Fig. 4
Fig. 4. Altered mitochondria lipid droplet contacts in COX14M19I mice.
a Total amount of different classes of lipid species in wild-type (WT) and COX14M19I mice liver samples analyzed by mass spectrometry. Means ± SEM, n = 8. b Cytochemistry of isolated primary hepatocytes from WT and COX14M19I mice using Oil Red O. n = 3, scale bar 100 μm. c Statistical analysis of images from b, number of lipid droplets per cell (left) and average lipid droplet area per cell (right). Means ± SEM, n = 3 biological replicates, > 6 technical replicates pre mouse, Unpaired t test, left panel p = 0.0374; right panel p = 0.0691. d Representative TEM and FIB-SEM images of liver tissue samples from WT and COX14M19I mice. n = 3, scale bar 1 μm. e Representative 3D reconstructions of interaction between mitochondrion and lipid droplets observed in FIB-SEM images of liver tissue samples from COX14M19I mice. n = 3, scale bar 2 μm. Source data are provided as a Source Data file.
Fig. 5
Fig. 5. Activation of inflammatory pathways in COX14M19I and COA3Y72C mice.
a qPCR analysis of the gene expression of nucleic acid sensing pathway target genes in total mRNA isolated from 12-week-old WT and COX14M19I mice liver samples. Means ± SEM, n = 4. b Western blot analysis and quantification of tissue lysates from 12-week-old WT and COX14M19I mice livers with indicated antibodies. Means ± SEM, n = 4, Unpaired t test, ISG15 p = 0.0005; OASL1a p < 0.0001; IFIT1 p = 0.0003. c Graphical presentation on the generation of the COA3Y72C mouse line using CRISPR/CAS9-mediated double stranded cut in the Coa3 allele and subsequent single stranded Oligonucleotide DNA (ssODN) mediated repair. d Enzyme activity of cytochrome c oxidase from 60-week-old WT and COA3Y72C brain, heart, liver and muscle plotted as percentage of average of WT. Means ± SEM, n = 3, One-way ANOVA, ns=non-significant, Brain p = 0.0028; Liver p < 0.0001; Muscle p = 0.0004 e qPCR analysis of gene expression of nucleic acid sensing pathway target genes in total mRNA isolated from 22-week-old WT and COA3Y72C mice liver samples. Means ± SEM, n = 4. f Measurement of relative mRNA abundance in the cytosolic fractions of 12-week-old WT and COX14M19I mice liver samples. Means ± SEM, n = 4. g Immunoblot analysis and quantification of tissue lysates from 24-week-old WT and COX14M19I mice liver for indicated proteins. Means ± SEM, n = 4, Unpaired t test, RIG1 p = 0.0002; MDA5 p = 0.0051; STING p = 0.0416; ZBP1 p = 0.0015. Source data are provided as a Source Data file.
Fig. 6
Fig. 6. Metabolic analysis of COX14M19I.
Levels of different classes of metabolites determined by mass spectrometry in wild-type (WT) and COX14M19I mice liver samples. Means ± SD, n = 4 (WT); n = 6 (COX14M19I), Unpaired t test, UTP p = 0.0039; ATP p = 0.0005; IMP p = 0.0003; Glucose-6-phosphate p = 0.0036; Citric acid p = 0.0001; Alpha-ketoglutaric acid p = 0.0107; Glutamate p = 0.0006; Carbamoyl-aspartatic acid p = 0.0005; Orotic acid p = 0.0014. Blue—similar amount in WT and COX14M19I; red—decreased amount in COX14M19I compared to WT; green—increased amount in COX14M19I compared to WT. PPPE, early metabolites of the oxidative phase of pentose phosphate pathway not individually resolved by the analysis. Source data are provided as a Source Data file.
Fig. 7
Fig. 7. mRNA release triggered by increased reactive oxygen species.
a Mitochondrial membrane potential measured in WT and COX14M19I primary hepatocytes using TMRM staining. Means ± SEM, n = 5, Unpaired t test, p = 0.0003. b ROS production measured in WT and COX14M19I primary hepatocytes using MitoSOX Red Mitochondrial Superoxide Indicator. Means ± SEM, n = 8, Unpaired t test, p < 0.0001. c qPCR analysis of gene expression of nucleic acid sensing pathway target genes in total mRNA isolated from WT and COX14M19I primary hepatocytes treated with either vehicle control or NAC for 24 h. Means ± SEM, n = 3. d Measurement of relative mRNA abundance in the cytosolic fractions from WT and COX14M19I hepatocyte fractionation samples. Means ± SEM, n = 4. e, f Western blot analysis of cell lysates from WT and COX14M19I primary hepatocytes with indicated antibodies and quantification Means ± SEM, n = 3, Unpaired t test, ns = non-significant, e: IFIT1 p = 0.0047, OAS1a p = 0.0061, ISG15 p = 0.0054; f IFIT1 p = 0.0113, OAS1a p < 0.0001. g ROS production measured in WT and COX14M19I primary hepatocytes using MitoSOX Red Mitochondrial Superoxide Indicator. Means ± SEM, n = 6; p < 0.0001. Source data are provided as a Source Data file.

References

    1. Guerrero-Castillo, S. et al. The assembly pathway of mitochondrial respiratory chain complex I. Cell Metab.25, 128–139 (2017). 10.1016/j.cmet.2016.09.002 - DOI - PubMed
    1. Lobo-Jarne, T. et al. Multiple pathways coordinate assembly of human mitochondrial complex IV and stabilization of respiratory supercomplexes. EMBO J.39, e103912 (2020). 10.15252/embj.2019103912 - DOI - PMC - PubMed
    1. Priesnitz, C. & Becker, T. Pathways to balance mitochondrial translation and protein import. Genes Dev.32, 1285–1296 (2018). 10.1101/gad.316547.118 - DOI - PMC - PubMed
    1. Signes, A. & Fernandez-Vizarra, E. Assembly of mammalian oxidative phosphorylation complexes I–V and supercomplexes. Essays Biochem.62, 255–270 (2018). 10.1042/EBC20170098 - DOI - PMC - PubMed
    1. Homberg, B., Rehling, P. & Cruz-Zaragoza, L. D. The multifaceted mitochondrial OXA insertase. Trends Cell Biol. 33, 765–772 (2023). - PubMed

MeSH terms