. 2024 Aug 12;14(1):18679.
doi: 10.1038/s41598-024-65148-4.

Somatic mutational landscape across Indian breast cancer cases by whole exome sequencing

Affiliations

Somatic mutational landscape across Indian breast cancer cases by whole exome sequencing

Rahul Kumar et al. Sci Rep. .

Abstract

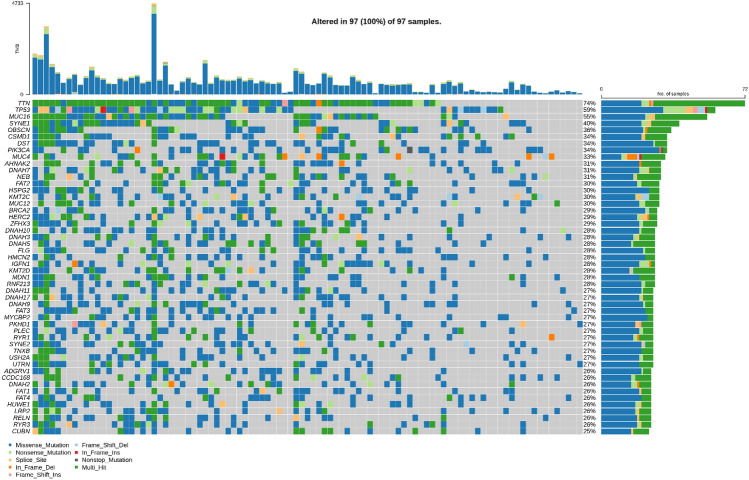
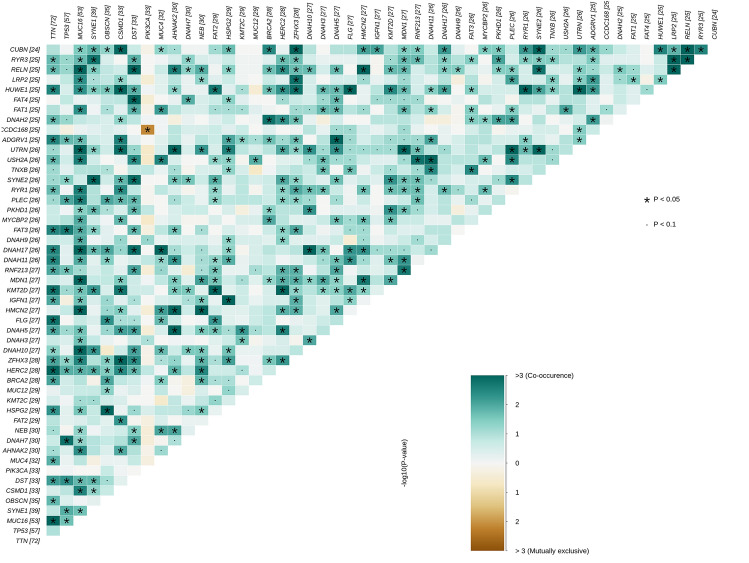
Breast cancer (BC) has emerged as the most common malignancy among females. The genomic profile of BC is diverse in nature and complex due to heterogeneity among various geographically different ethnic groups. The primary objective of this study was to carry out a comprehensive mutational analysis of Indian BC cases by performing whole exome sequencing. The cohort included patients with a median age of 48 years. TTN, TP53, MUC16, SYNE1, and OBSCN were the frequently altered genes found in our cohort. The PIK3CA and KLC3 genes are driver genes implicated in various cellular functions and cargo transportation through microtubules, respectively. Except for CCDC168 and PIK3CA, several gene pairings were found to be significantly linked with co-occurrence. Irrespective of their hormonal receptor status, RTK/RAS was observed with frequently altered signaling pathways. Further analysis of the mutational signature revealed that SBS13, SBS6, and SBS29 were mainly observed in our cohort. This study supplements the discovery of diagnostic biomarkers and provides new therapeutic options for the improved management of BC.

Keywords: Breast cancer; Driver gene; Oncogenic pathway; SBS signature; Whole-exome sequencing.


Conflict of interest statement

The authors declare no competing interests.

Figures

Figure 1
Figure 1
Overview of mutagenesis in AIIMS breast cancer cohort including (A) shows the classification of variants identified in the cohort. The Y-axis represents different variant classifications while the X-axis indicates the number of variants corresponding to each classification. (B) Illustrates the types of variants observed. The Y-axis lists the types of variants including single nucleotide variants (SNVs), insertions, deletions, and indels. (C) The specific classes of SNVs are depicted. The Y-axis includes various SNV classes such as transitions (e.g., T>C & C > T) and transversions (e.g., T>G, T>A, C>G & C>A). (D) The stacked barplot present the number of variants identified in each sample. The Y-axis denotes the number of variants, while the X-axis corresponds to individual samples.
Figure 2
Figure 2
Oncoplot provides a detailed overview of the mutation landscape in the AIIMS breast cancer cohort, focusing on the top 50 highly mutated genes. Each column in the plot represents an individual sample from the AIIMS breast cancer cohort while each row corresponds to one of the top 50 genes. The upper panel displays the mutational burden for each sample and bar graph on the right side of the plot shows the number of samples that have alterations in each gene.
Figure 3
Figure 3
Quantile plot illustrates the driver genes identified by OncodriveCLUSTL in the AIIMS breast cancer. The plot highlights genes predicted to be drivers among the top mutated genes. Among these, PIK3CA and KLC3 were identified as driver genes.
Figure 4
Figure 4
Somatic interaction analysis of the top 50 genes. Co-occurrence and mutual exclusive gene pairs were analyzed with pair-wise Fisher’s exact test. Gene pairs with statistically significant interactions are highlighted by darker color with dots or asterisks depending on whether the p value is < 0.1 or < 0.05.
Figure 5
Figure 5
Pathway enrichment analysis. (A) Bar plot on the left panel shows the fraction of pathways affected while the right panel (B) shows the number of samples affected (C) visualize the complete RTK-RAS pathway. Tumor suppressor genes and oncogenes are indicated in red, and blue font.
Figure 6
Figure 6
The plot depicts the overall comparison between APOBEC and non-APOBEC samples. (A) Difference in mutation burden between APOBEC and non-APOBEC enriched samples (B) tCw motifs load in APOBEC samples (C) tCw motifs load in non-APOBEC samples (D) topmost altered genes in non-APOBEC samples.
Figure 7
Figure 7
Best match single base substitution (SBS) mutational signatures. The plot highlights the most frequently observed mutational aetiology within the AIIMS breast cancer cohort.

References

    1. Mathur, P. et al. Cancer statistics, 2020: Report from national cancer registry programme, India. JCO Glob. Oncol.6, 1063–1075 (2020). 10.1200/GO.20.00122 - DOI - PMC - PubMed
    1. Hirko, K. A. et al. Trends in breast cancer incidence rates by age and stage at diagnosis in Gharbiah, Egypt, over 10 Years (1999–2008). J. Cancer Epidemiol.2013, 916394 (2013). 10.1155/2013/916394 - DOI - PMC - PubMed
    1. Pereira, B. et al. The somatic mutation profiles of 2,433 breast cancers refines their genomic and transcriptomic landscapes. Nat. Commun.7, 11479 (2016). 10.1038/ncomms11479 - DOI - PMC - PubMed
    1. Network, C. G. A. Comprehensive molecular portraits of human breast tumours. Nature490, 61–70 (2012). 10.1038/nature11412 - DOI - PMC - PubMed
    1. Stephens, P. J. et al. The landscape of cancer genes and mutational processes in breast cancer. Nature486, 400–404 (2012). 10.1038/nature11017 - DOI - PMC - PubMed

Substances